






Crypto 米国株ウォッチ:CRCL、HOOD、COIN、MSTR、最近何を取引しているのか?


- 核心的な見解:最近、米国株とCryptoのクロスオーバー領域における3つの主要企業(Circle、Robinhood、Strategy)の株価を牽引する要素は明確に分散化しており、ビジネスモデルと競争環境は構造的な調整期に入っている。市場は、それぞれ異なる核心的変数を織り込むようになり始めている。
- 重要な要素:
- Circle(CRCL.M)の株価のアンカーは、再びUSDCの流通量に連動している。その収益は「平均USDC流通量×準備金利回り」に大きく依存しており、現在のUSDC流通量は3月の高値から約7.4%減少し、737億ドルとなっている。
- Robinhood(HOOD.M)はRobinhood Chainをローンチし、従来型の証券会社からオンチェーン金融へと逆方向に浸透し、Coinbaseのバリュエーションの希少性を脅かしている。しかし、Baseは依然として世界の調整後ステーブルコイン取引量の62%を占めており、ネットワーク効果は顕著である。
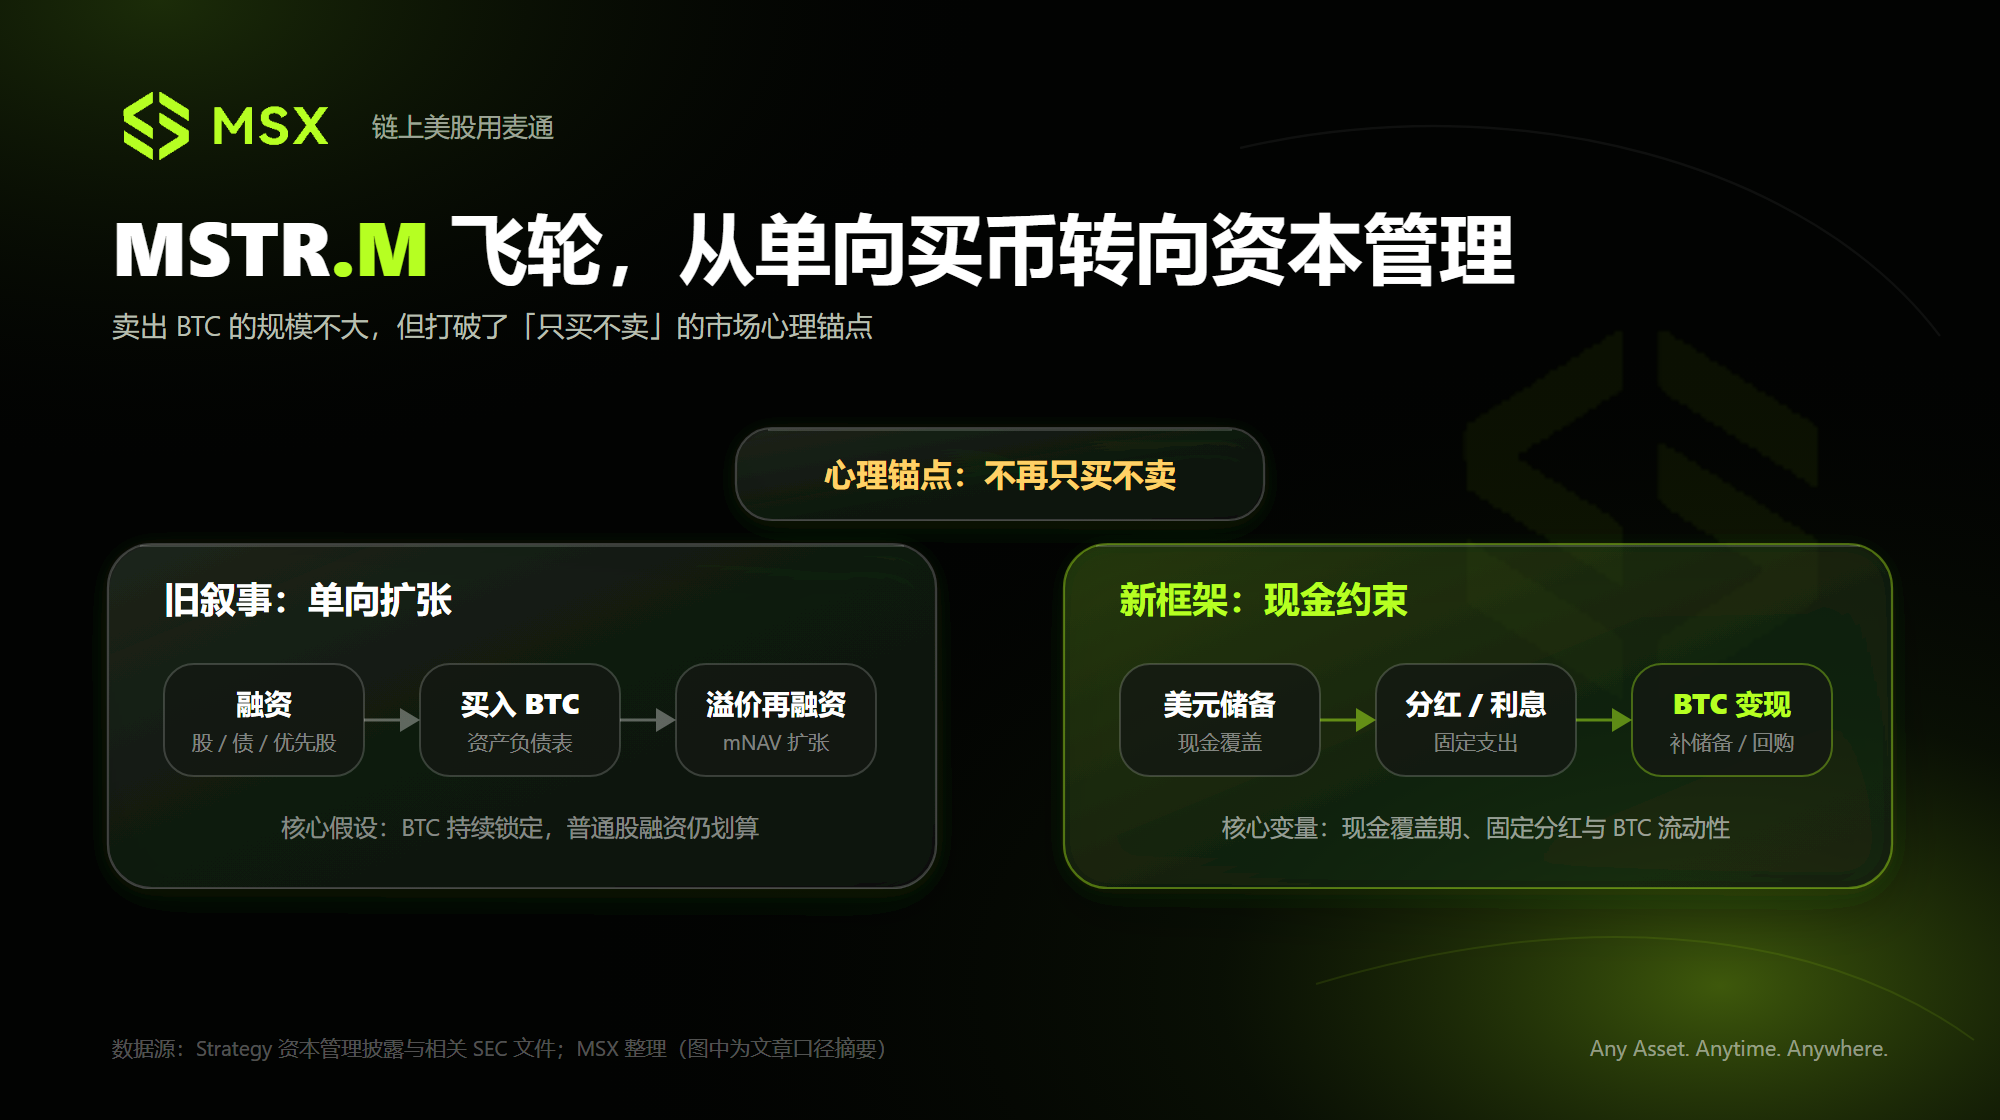
- Strategy(MSTR.M)は「買うだけで売らない」という認識を覆し、最近3,588 BTC(約2億1600万ドル)を売却し、優先株の配当支払いに充てた。これは、一方向的な資金調達のフライホイールから、能動的な資本管理への移行を示している。
- Circleの株価の転換点を見極めるには、以下の3つの共鳴シグナルを観察する必要がある:DeFiの活性度回復、USDCの継続的な純増発、そして利下げや販売コストによって収益予想が相殺されないこと。
- RobinhoodとCoinbaseの競争の本質は、「クロスアセット金融エントリー」の争いである。前者は伝統的な投資家と証券資産を掌握し、後者は暗号資産ネイティブユーザーとステーブルコイン流通の優位性を有している。
In the past few weeks, three noteworthy trends have emerged at the intersection of US stocks and Crypto.
Circle (CRCL.M) is still digesting the pressure from a decline in USDC circulation and the cooling of on-chain DeFi; Robinhood (HOOD.M) has regained market favor by building its own public chain, further transferring competitive pressure to Coinbase (COIN.M); Strategy (MSTR.M) has begun to substantially sell Bitcoin, breaking the market's long-held one-way perception that it would "only buy, never sell."
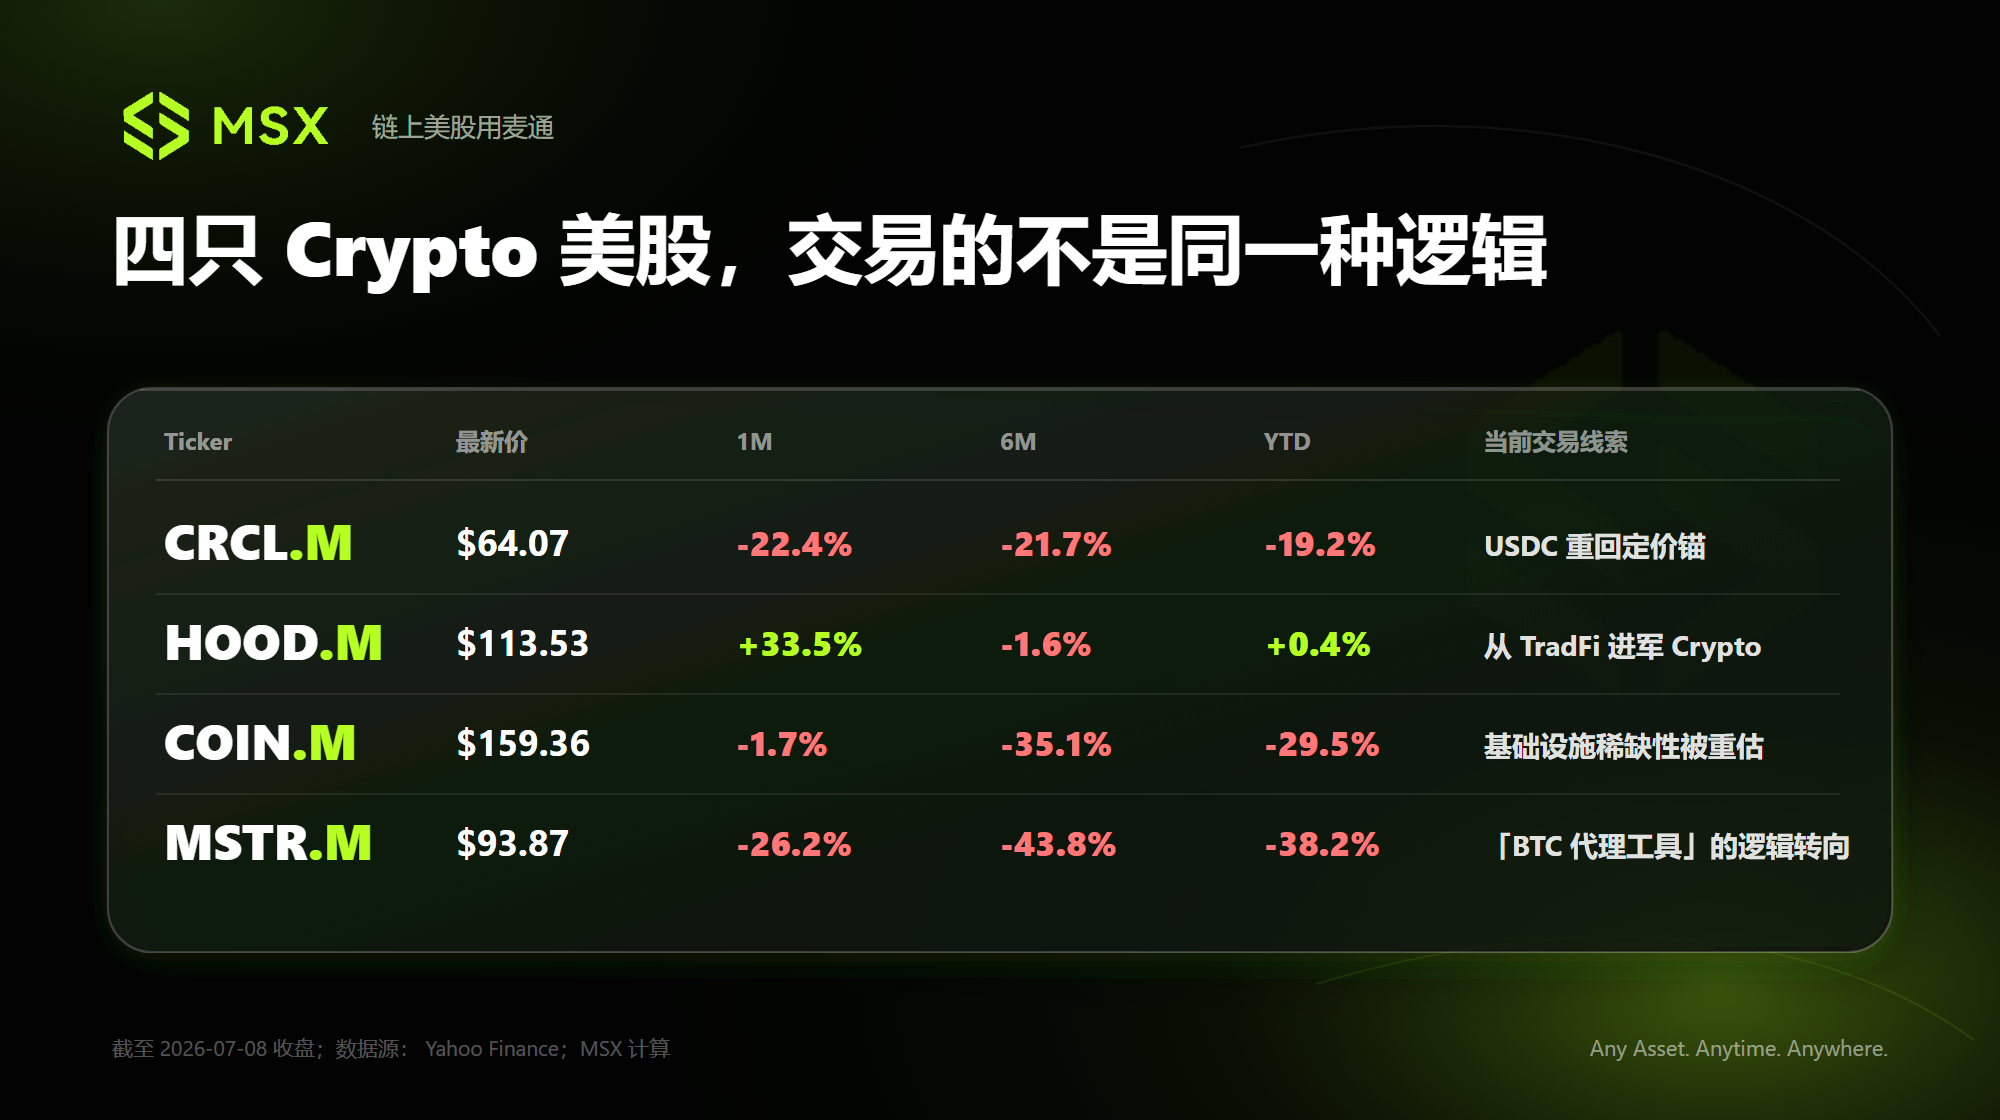
As of the close on July 8, CRCL.M, HOOD.M, COIN.M, and MSTR.M were at $64.07, $113.53, $159.36, and $93.87 respectively. On the surface, they all lie at the intersection of US stocks and Crypto, but the core variables driving their stock prices have recently shown clear divergence:
- Circle's focus is returning to USDC circulation and DeFi activity;
- The competition between Robinhood and Coinbase has extended from trading platforms to asset issuance, user acquisition, and on-chain settlement;
- Strategy is no longer just facing Bitcoin price fluctuations, but the balance between mNAV, financing costs, and cash expenditures;
In other words, the market is pricing different things for each of them.
I. Circle: Bubble Deflating, USDC Returning as CRCL's Pricing Anchor
The most noteworthy change for Circle currently is that the relationship between the CRCL.M stock price and USDC is gradually shifting from a phase of decoupling post-IPO to a fundamental resonance.
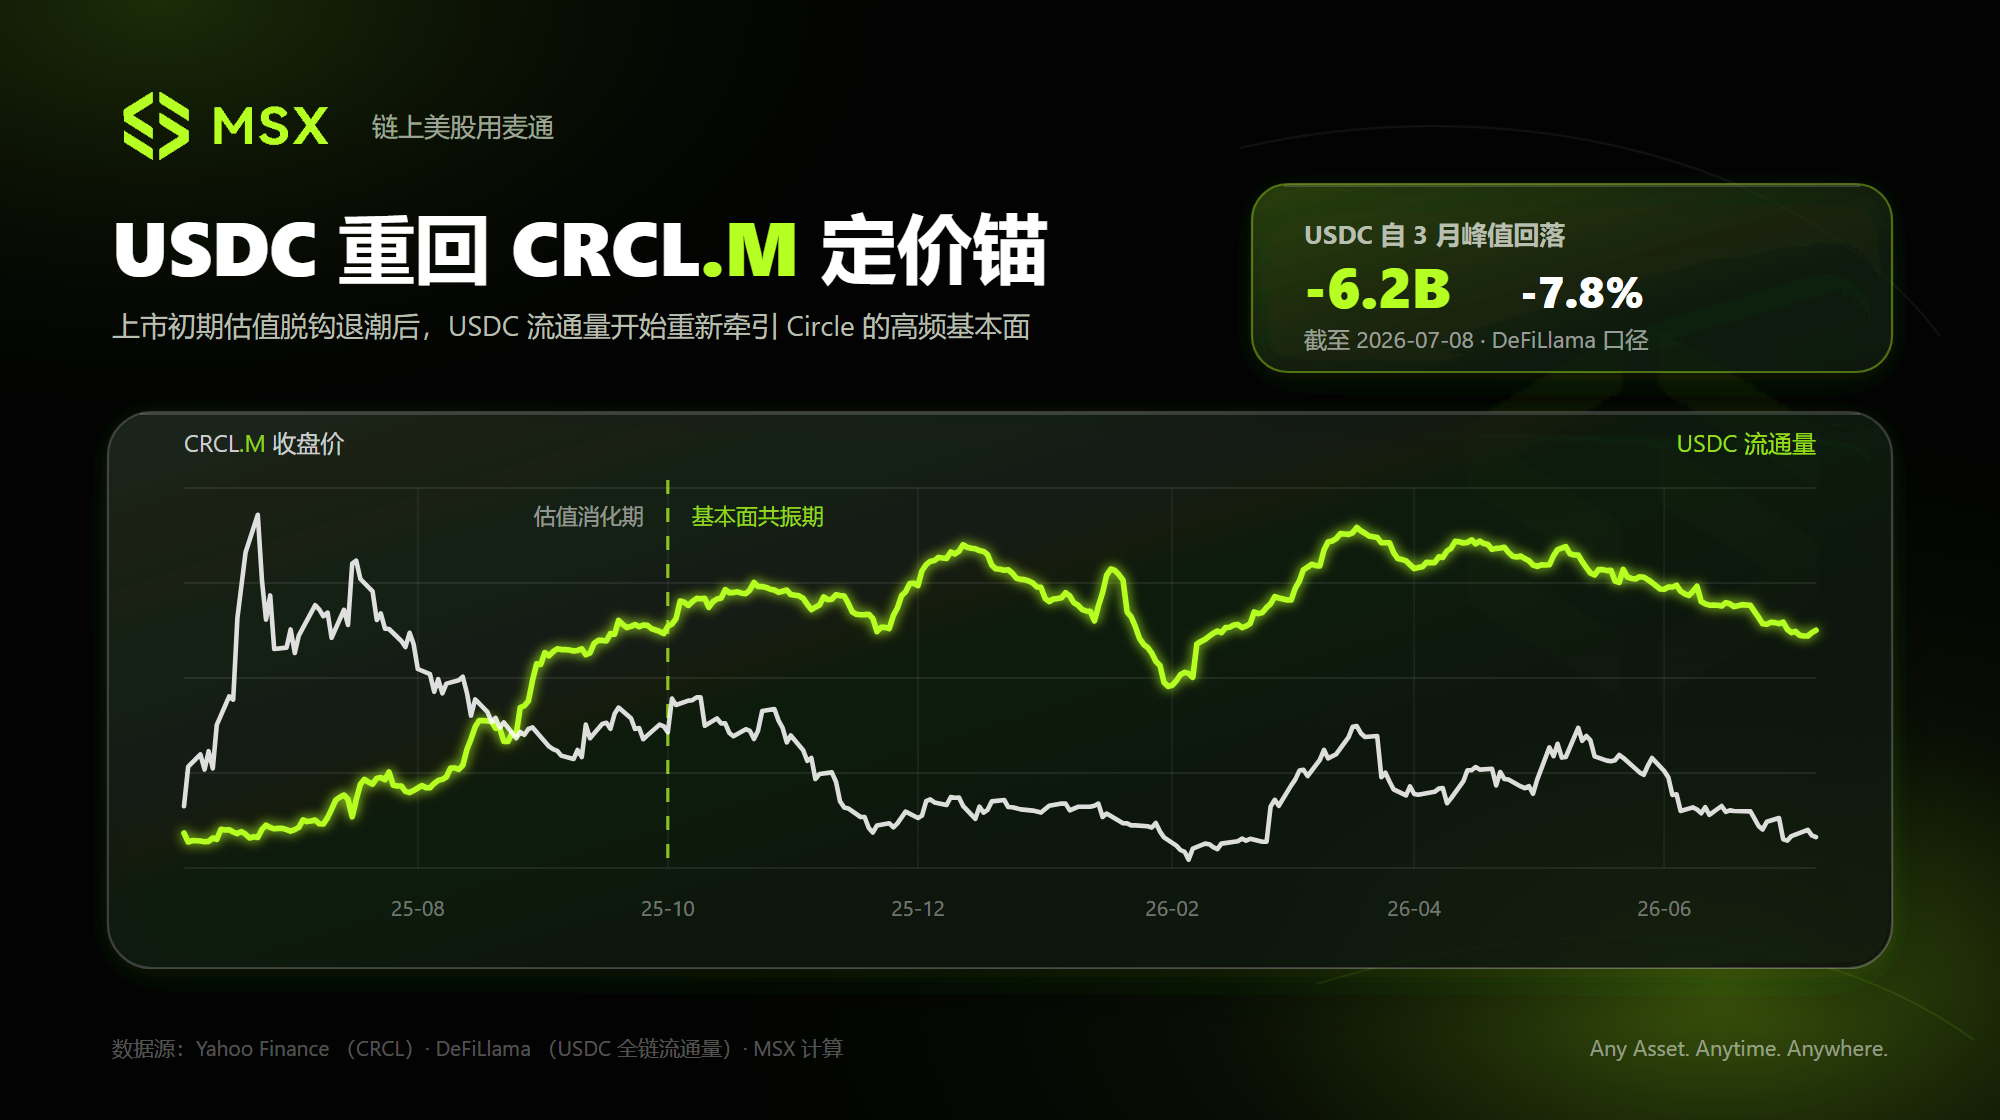
MSX Maitong has charted the comparison curve between the CRCL.M stock price and USDC circulation since Circle's listing, clearly showing two distinct pricing phases.
The first phase was the post-IPO valuation digestion period, roughly from June 2025 to the end of the year.
At that time, CRCL.M, as the first major stablecoin issuer listed on US stocks, saw its price soar to an all-time closing high of $263.45, driven by scarcity, low float, and IPO sentiment, far outpacing changes in USDC's fundamentals.
Subsequently, as the low float premium and IPO sentiment faded, a persistent valuation regression began. Meanwhile, USDC circulation continued to grow, causing the two curves to move in opposite directions during this phase, significantly lowering the full-cycle correlation coefficient.
The second phase began around the end of 2025 and early 2026. As the initial valuation bubble post-IPO gradually cleared, the marginal pricing of CRCL started to realign with USDC circulation and Circle's operational data. The directional resonance of the two curves noticeably strengthened:
- Late January to early February: USDC circulation rapidly declined, and CRCL simultaneously tested its phase lows;
- February to mid-March: USDC resumed expansion, rising to a phase peak of approximately $79.6 billion, and CRCL saw a significant rebound;
- After late March: USDC growth stalled and gradually turned into net contraction, with CRCL subsequently re-entering a downward channel;
- By July 6, USDC circulation had fallen to about $73.7 billion, a decrease of roughly $5.9 billion or about 7.4% from the March high.
The fundamental reason behind this is that USDC is the core balance sheet variable in Circle's current revenue model. For instance, in Q1 2026, its reserve revenue reached $653 million, accounting for approximately 94% of total revenue and reserve revenue, a 17% year-over-year increase.
This growth was primarily driven by a 39% year-over-year increase in average USDC circulation, partially offsetting the impact of a 66 basis point decline in reserve yields.
After all, Circle's other revenue during the same period was only about $42 million...
This also means that Circle's current profit logic can still be roughly simplified to 'Average USDC Circulation × Reserve Asset Yield - Distribution Costs - Operating Expenses'.
Of course, reserve revenue does not equal shareholder profit. Circle still needs to pay substantial fees to Coinbase, exchanges, and other distribution channels, but this is sufficient to illustrate the sensitivity of operating results to USDC scale.
Further tracking reveals that USDC circulation itself is closely tied to the Crypto market, particularly DeFi's risk appetite and capital demand. This is why a DeFi downturn directly impacts USDC – because the vast majority of USDC demand comes from on-chain lending protocols, perpetual contracts, liquidity pools, and institutional on-chain settlements.
A common feature of these use cases is that capital doesn't just pass through USDC temporarily; it needs to remain in protocols or accounts in USDC form for extended periods.
Therefore, when DeFi activity rises and capital enters lending, trading, and liquidity protocols, the demand for USDC stock tends to increase simultaneously. Conversely, when confidence in DeFi wanes, investors redeem funds, deleverage, and exit on-chain yield strategies, potentially leading to USDC being transferred back to exchanges, swapped for other stablecoins, or directly redeemed for US dollars.
The KelpDAO/rsETH incident in April this year was a classic stress test. In this attack, the undercollateralized rsETH was used as collateral for borrowing in protocols like Aave, rapidly spreading risk across collateral, lending pools, and yield strategies.
Within 48 hours of the incident, total DeFi TVL dropped from approximately $99.497 billion to $86.286 billion, a decrease of about $13.21 billion, or roughly 13.3%.
Aave's TVL alone fell from about $26.4 billion to $17.9 billion. A large number of users tried to withdraw stablecoins, creating continuous net outflow pressure on on-chain capital. Temporally, this also corresponds to the point where USDC began to contract after reaching its phase peak of around $79.6 billion, and CRCL weakened again after its March rebound.
However, in theory, the CRCL stock price is also influenced by factors like interest rate expectations, market risk appetite, earnings guidance, and valuation levels. USDC cannot explain all volatility, but after the IPO scarcity premium faded, it has indeed become Circle's most important high-frequency fundamental indicator.
So, how should we judge the turning point for CRCL's stock price going forward?
From a trading perspective, observing a single week's increase in USDC issuance isn't enough to confirm a CRCL reversal. A short-term increase could stem from a single institution rebalancing, an exchange replenishing liquidity, or temporary settlement needs. What's more noteworthy is whether three sets of signals resonate continuously:
- Is DeFi activity recovering? Focus on whether the TVL, lending demand, stablecoin deposits, and protocol revenue of core protocols like Aave/Sky, Morpho, Pendle, and Lido are recovering simultaneously. Only when capital re-enters protocols generating real collateral, trading, and yield demand will sustainable demand for USDC stock be created;
- Is USDC transitioning from single-week increases to consecutive net issuance? Circle discloses USDC minting, redemption, and circulation changes weekly. Consecutive net issuance for two to four weeks is more significant, reducing noise from short-term capital movements;
- Are Circle's profit expectations no longer being offset by rate cuts and distribution costs? Even if USDC resumes growth, if the Fed cuts rates rapidly, or if Circle concedes more reserve revenue to compete for channels like Hyperliquid, exchanges, etc., the contribution of USDC growth to shareholder profits might be lower than expected. Therefore, monitor whether reserve yields, distribution costs, and profit margins after distribution costs are stabilizing;
In a nutshell, when DeFi TVL, stablecoin lending demand, and protocol revenue begin to recover simultaneously, accompanied by several consecutive weeks of net USDC issuance, CRCL.M's fundamentals may present a tradable upward inflection point.
Beyond this, Circle is also promoting USDC as the core quote and settlement asset for on-chain trading platforms like Hyperliquid, while expanding CPN cross-border payments, the Arc public chain, and AI Agent payment infrastructure.
These initiatives will determine whether Circle can gradually break free from its single valuation framework of "relying on US Treasury reserves for interest spreads and depending on Coinbase/Base for distribution."
But at least in the short term, the resonance between DeFi activity and weekly net USDC issuance remains the most direct signal for judging CRCL's fundamental turning point.
II. Robinhood Chain: Squeezing Coinbase, More Than Just Another L2
On July 1st, Robinhood officially launched its Robinhood Chain mainnet.
This is an Ethereum L2 built on Arbitrum technology, but Robinhood's goal is clearly not just to build another general-purpose public chain. Instead, it aims to gradually connect its brokerage business, stock tokens, wallet, lending, perpetual contracts, and AI trading capabilities into an on-chain issuance and settlement system under its own control.
Currently, the new generation of Robinhood stock tokens can be traded 24/7 on Robinhood Chain, can enter lending pools, or be used as collateral for other DeFi trades. Its wallet also connects to on-chain trading platforms like Uniswap and Lighter, and Robinhood Earn provides stablecoin lending services via Morpho.
The capital market responded swiftly. Robinhood's stock price rose 8.35% on July 1st alone, closing at $113.53 on July 8th, up approximately 13% from June 30th.
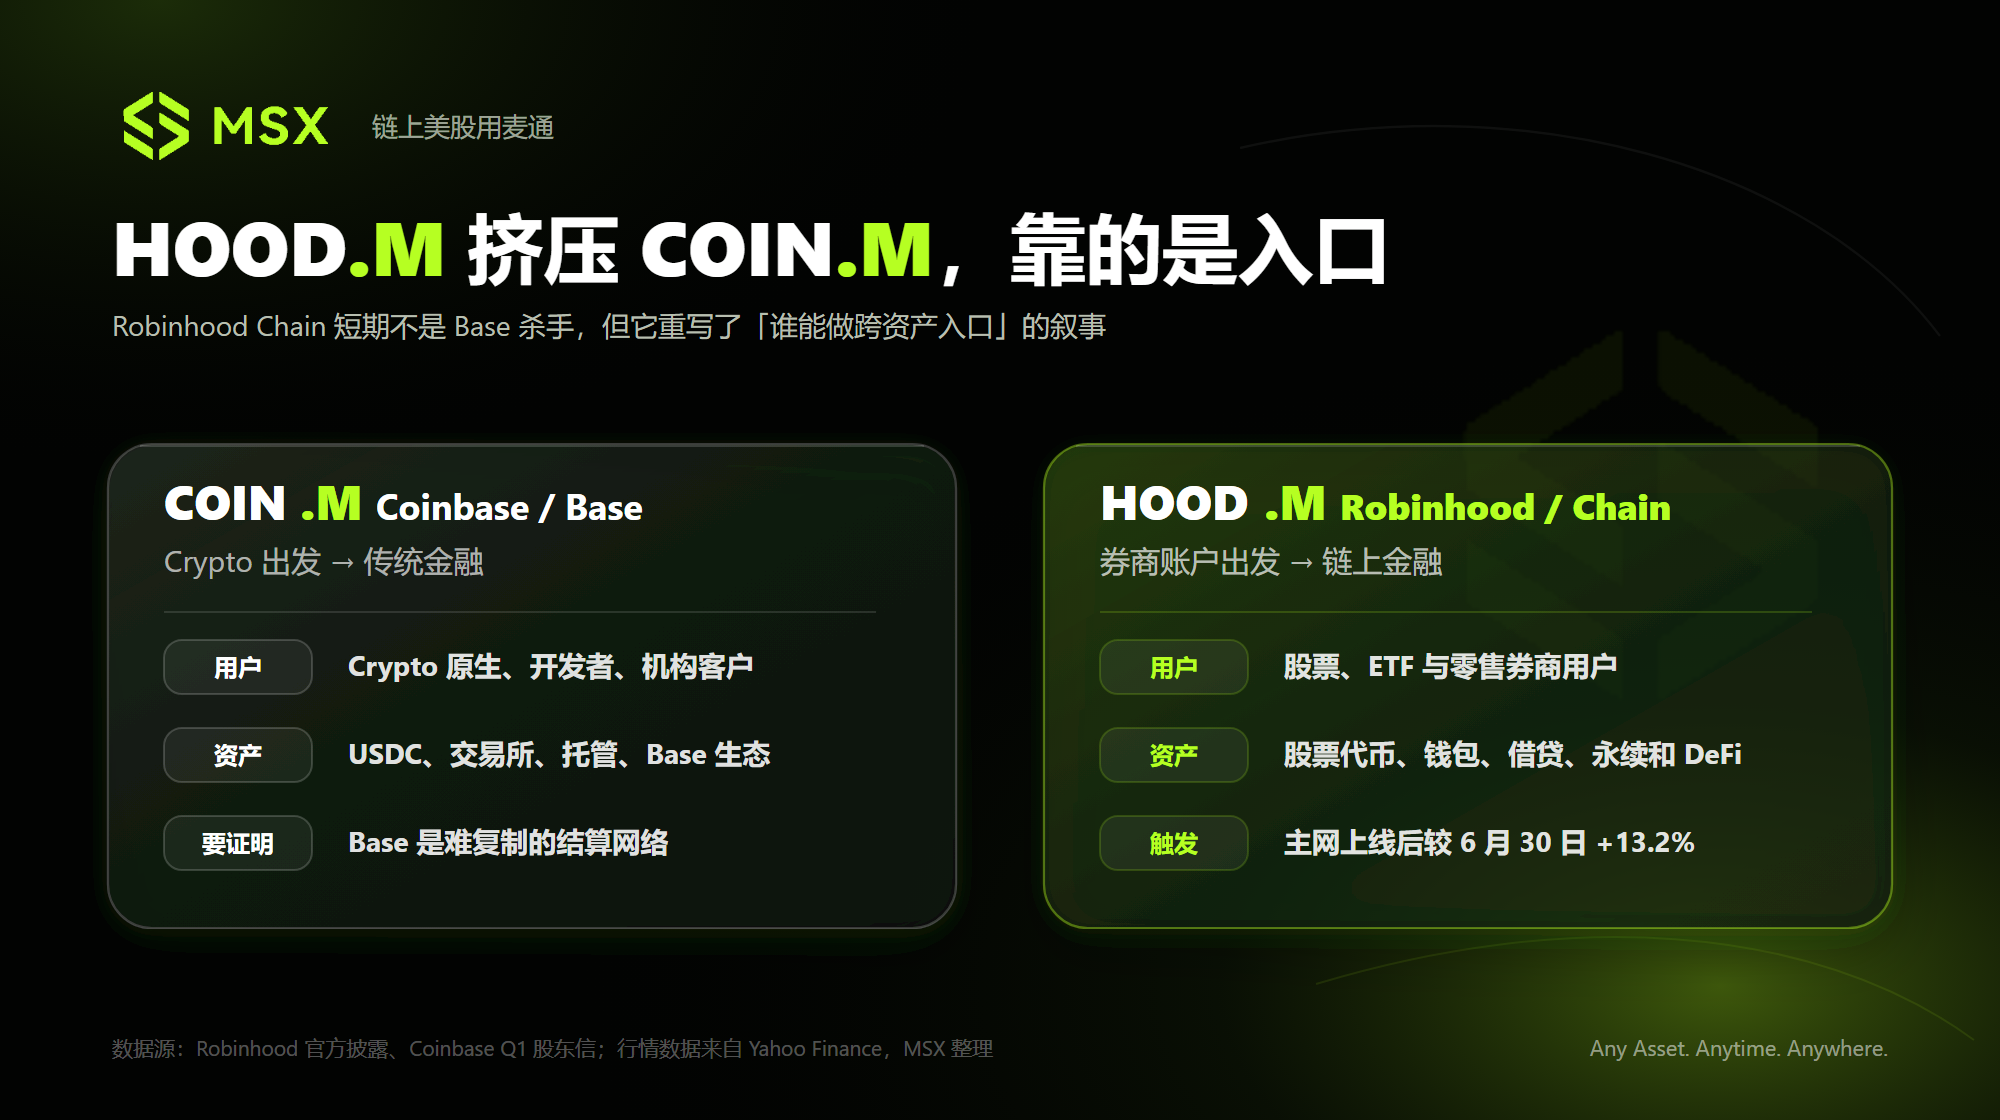
However, a closer comparison reveals that the difference between this chain and Coinbase's Base isn't primarily in the underlying technology or TPS, but in the user bases and distribution channels they control:
- Base is closer to native crypto users, aiming to be a universal on-chain operating system for developers, stablecoin payments, and AI agents;
- Robinhood Chain starts with traditional brokerage users, attempting to bring stocks, ETFs, and other RWA assets directly into on-chain trading and DeFi;
Realistically speaking, Robinhood Chain cannot yet be called a "Base killer" in the short term.
According to statistics disclosed by Coinbase based on Artemis data, Base accounted for approximately 62% of global adjusted stablecoin transaction volume in Q1 2026. During the same period, over 90% of on-chain AI agent stablecoin transaction volume occurred on Base.
Coinbase also holds a strong advantage in stablecoin distribution. In Q1, its products held an average of about $19 billion in USDC, exceeding a quarter of the total USDC circulation, and captured approximately 50% of the overall economic benefits from USDC over the past year.
This means Base currently possesses not just on-chain traffic, but the network effects formed by Coinbase exchange, custody, institutional clients, and USDC distribution. Whether in terms of stablecoin balances, developer ecosystem, or on-chain liquidity, Robinhood Chain will find it difficult to directly challenge Base's established advantages in the short term.
But Robinhood's deeper threat to Coinbase has never really been about taking Base's TVL in the short term.
It instead proves that a publicly traded brokerage with tens of millions of retail users, brokerage licenses, and a securities asset gateway can also build its own wallet, public chain, and on-chain financial products, keeping users, assets, order flow, and fees within its own ecosystem as much as possible.
If Coinbase follows the path of "starting from Crypto and expanding into traditional finance," then Robinhood Chain represents the opposite direction – starting from US stocks and the brokerage system to enter Crypto and on-chain finance.
From this perspective, Coinbase controls native crypto users, stablecoins, and on-chain infrastructure; Robinhood controls traditional investors, securities accounts, and stock assets. When both types of platforms eventually evolve into complete systems of "accounts + assets + trading + wallet + public chain," the battle is no longer just for developers or TVL on a single chain, but for who can become the next cross-asset financial gateway.
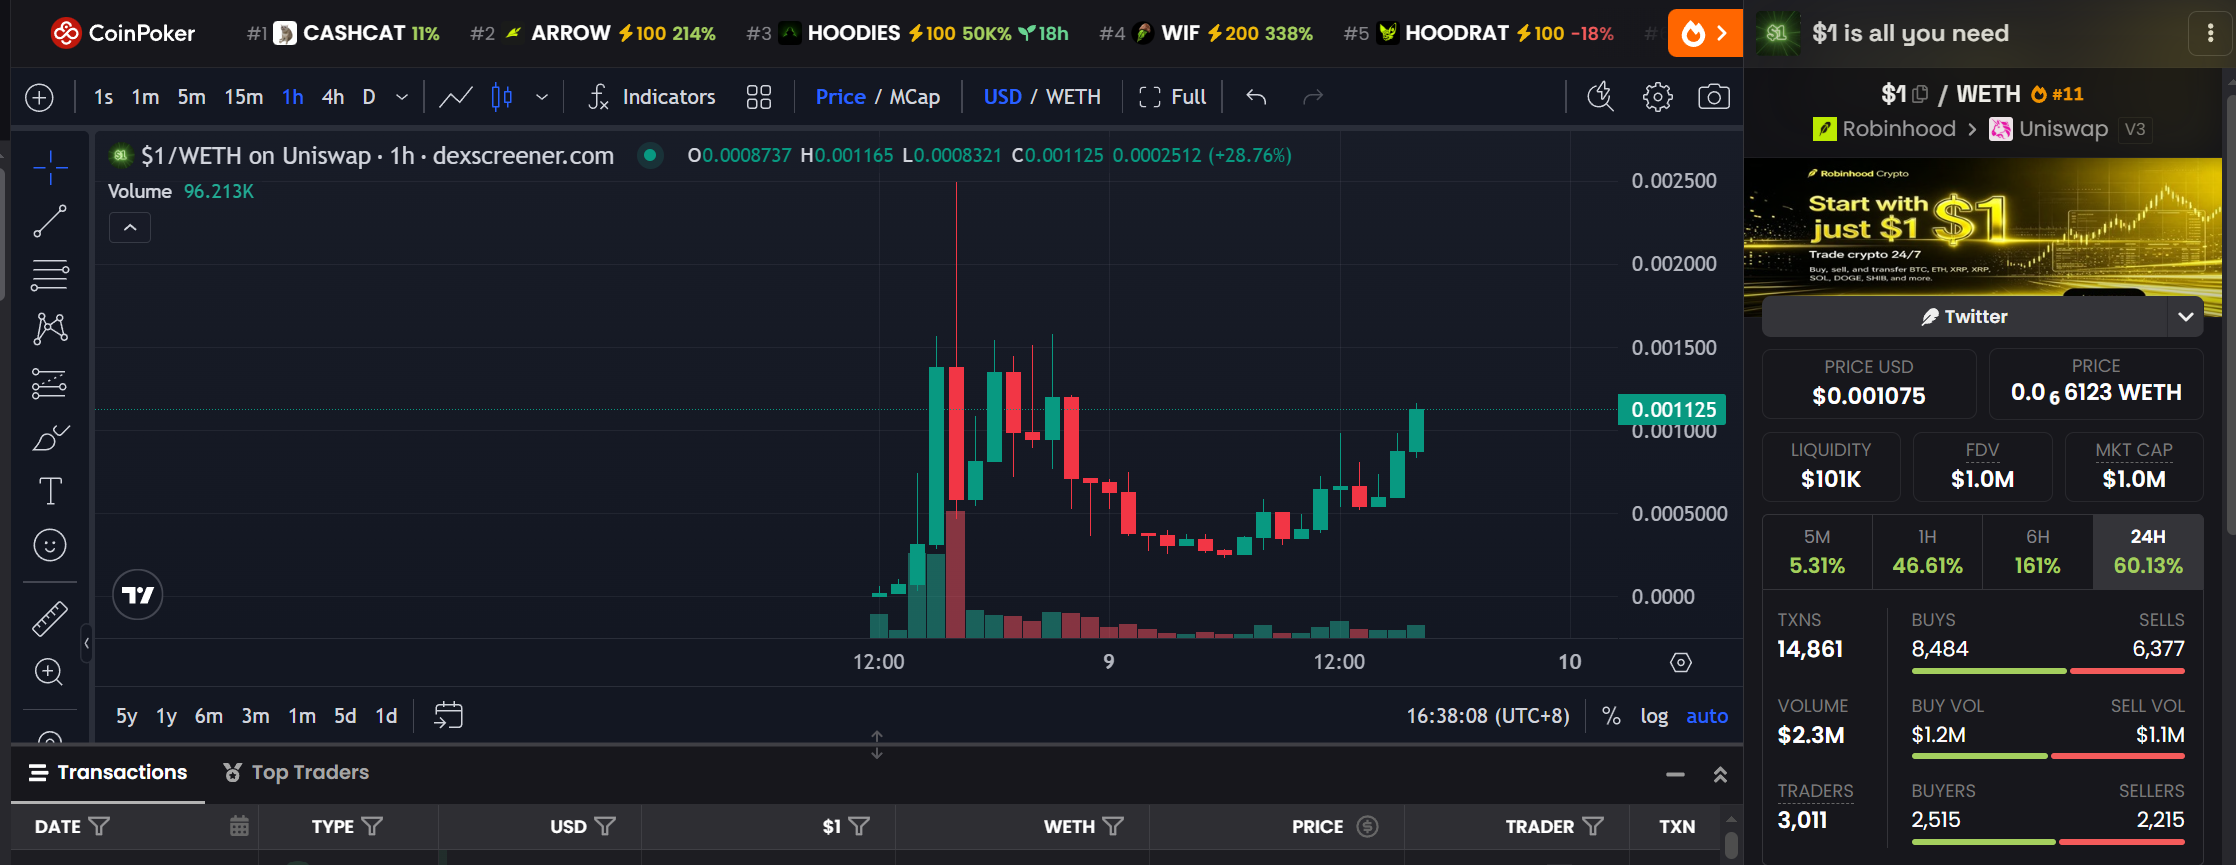
A very interesting observation sample is that after the Robinhood Chain mainnet launch, a wave of meme token speculation similar to Base's early days quickly emerged. For example, "$1," a name leveraging Robinhood's long-standing brand memory of "low-barrier investing" allowing purchases for as little as $1.
As the speculative sentiment for related tokens rapidly heated up, even many Robinhood users who typically trade US stocks began asking en masse how to access the chain and purchase memes.
These memes naturally have no direct relationship with the stock tokens officially launched by Robinhood, but for a new chain, they are undoubtedly the most efficient bootstrap tool, quickly attracting on-chain native capital, traders, and developers into the new ecosystem.
From this perspective, the meme craze at least suggests that Robinhood Chain can not only carry traditional assets but also has the potential to attract native crypto capital and speculative traffic, potentially becoming the most differentiated source of incremental on-chain traffic growth.
Of course, the business loop for Robinhood Chain is not yet fully formed. According to Robinhood's official disclosures, Robinhood Chain currently operates independently of its main brokerage and crypto accounts. It is not yet a settlement network fully integrated with existing brokerage accounts, funds, and order systems.
But the change is irreversibly underway.
Previously, Coinbase enjoyed a scarcity premium as "the purest Crypto infrastructure platform in the US stock market." However, as Robinhood builds its own on-chain settlement network, this scarcity is gradually being diluted. Coinbase is no longer the only listed company capable of packaging traditional financial assets, stablecoins, trading, and a public chain together.
Therefore, the near-term impact of Robinhood Chain on Coinbase may not immediately manifest in Base's TVL or Coinbase's current revenue. Instead, what warrants more caution is that COIN.M's long-term valuation narrative and infrastructure scarcity are being re-evaluated.
III. Strategy's Giant Shift: From 'Buy, Buy, Buy' to 'Starting to Sell'
Another piece of news altering market perception comes from MicroStrategy, now Strategy.
Strictly speaking, this is not Strategy's first time selling Bitcoin. The company sold 32 BTC in early June, but the consecutive sale of 3,588 Bitcoin from June 29th to July 5th truly carried symbolic significance from a capital management perspective:
- June 29-30: Sold 1,363 BTC at an average price of approximately $59,256, generating about $80.8 million;
- July 1-5: Sold 2,225 BTC at an average price of approximately $60,773, generating about $135.2 million;
The total proceeds from the two transactions amounted to approximately $216 million. The funds were used to pay preferred stock dividends and replenish the USD reserves consumed for this purpose. As of July 5th, Strategy still held 843,775 BTC, with an average purchase price of approximately $75,476; USD reserves stood at $2.55 billion.
In terms of scale, this sale accounted for only about 0.42% of the Bitcoin holdings before the sale, clearly not indicating that Strategy has begun to systematically turn bearish on Bitcoin. However, it breaks an important psychological anchor for the market – Strategy's Bitcoin is no longer just a reserve permanently locked on the balance sheet; it can also be actively sold to meet the real costs of the capital structure.
So why now?
In the past few years, Strategy's business model could be simplified into a one-way funding flywheel: 'Issue common stock, convertible bonds, or preferred stock → Raise funds to buy Bitcoin → BTC rise boosts net assets and stock price → Continue financing to buy coins based on valuation premium.'
The most critical variable is MSTR's premium relative to its Bitcoin net assets, commonly known in the market as mNAV.
This also means:
- When MSTR's mNAV is significantly above 1x, the company can issue shares at a price higher than the Bitcoin net asset value, then use the proceeds to buy BTC. As long as the issuance price is high enough, this operation can increase the Bitcoin per share, achieving so-called "accretion";
- But when mNAV contracts to near 1x, the effect of further issuing common stock weakens rapidly. At this point, the financing scale the company can obtain may be insufficient to compensate for the dilution from new shares.
Ultimately, when common stock financing is no longer advantageous, the optimal direction of capital allocation might reverse, leading to the active choice of selling BTC to supplement cash.
This is the core change in the new capital management framework launched by Strategy on June 29th. The framework includes a USD reserve policy, STRC dividend policy, authorization to repurchase up to $1 billion in preferred securities, authorization to repurchase up to $1 billion in MSTR common stock, and a Bitcoin monetization plan





