
我们から暗号弱気相場の終わりまであとどれくらい?
- 核心見解:Coinbase ビットコインプレミアム指数が46日連続でマイナスとなり、過去最長記録を更新。BTC、ETHの価格下落と主要サポートラインの喪失が重なり、現在の弱気相場サイクルは確定しており、まだ底値に達しておらず、少なくともあと2~3ヶ月は続く見込み。
- 主要要素:
- Coinbaseプレミアム指数は5月19日以来46日連続でマイナスとなり、1月に記録した40日を上回り、米国市場の需要低迷が続いていることを反映。
- Strategyが6月初旬に32BTCを売却したことで市場にパニックが広がり、ビットコイン現物ETFの連続純流出も重なり、今回の暴落の直接的な引き金となった。
- BTCは6月第1週に16%以上下落し、6万ドルおよび200週移動平均線を割り込み、2022年のFTX破綻以来の最悪の週間パフォーマンスとなった。
- 長期保有者の含み損が過去最大に拡大し、1083万BTCが損失状態にある。ETHの大口保有者(クジラ)は2019年以来初めて全体として損失を計上。
- 複数の機関が以前に予想した底値(CryptoQuantは5.36万ドル、BITは8月に終了と予想)はその後の下落によって否定され、市場の信頼感はさらに損なわれた。
- STRC優先株価は一時73ドルと過去最安値を記録したが、その後Strategyが自社株買い計画で危機を一時的に回避。しかし、その価格が100ドルに戻ることが弱気相場終了の重要な指標の一つであることに変わりはない。
- アナリストの見解は大きく分かれており、易理華氏は7~8月に底値(BTC 4.3万~5.1万ドル)、江卓爾氏は10~12月に底値(4.2万~4.4万ドル)と予想。9月下旬から10月上旬が重要な反発の窓口となる。
Original|Odaily Planet Daily (@OdailyChina)
Author|Wenser (@wenser 2010)
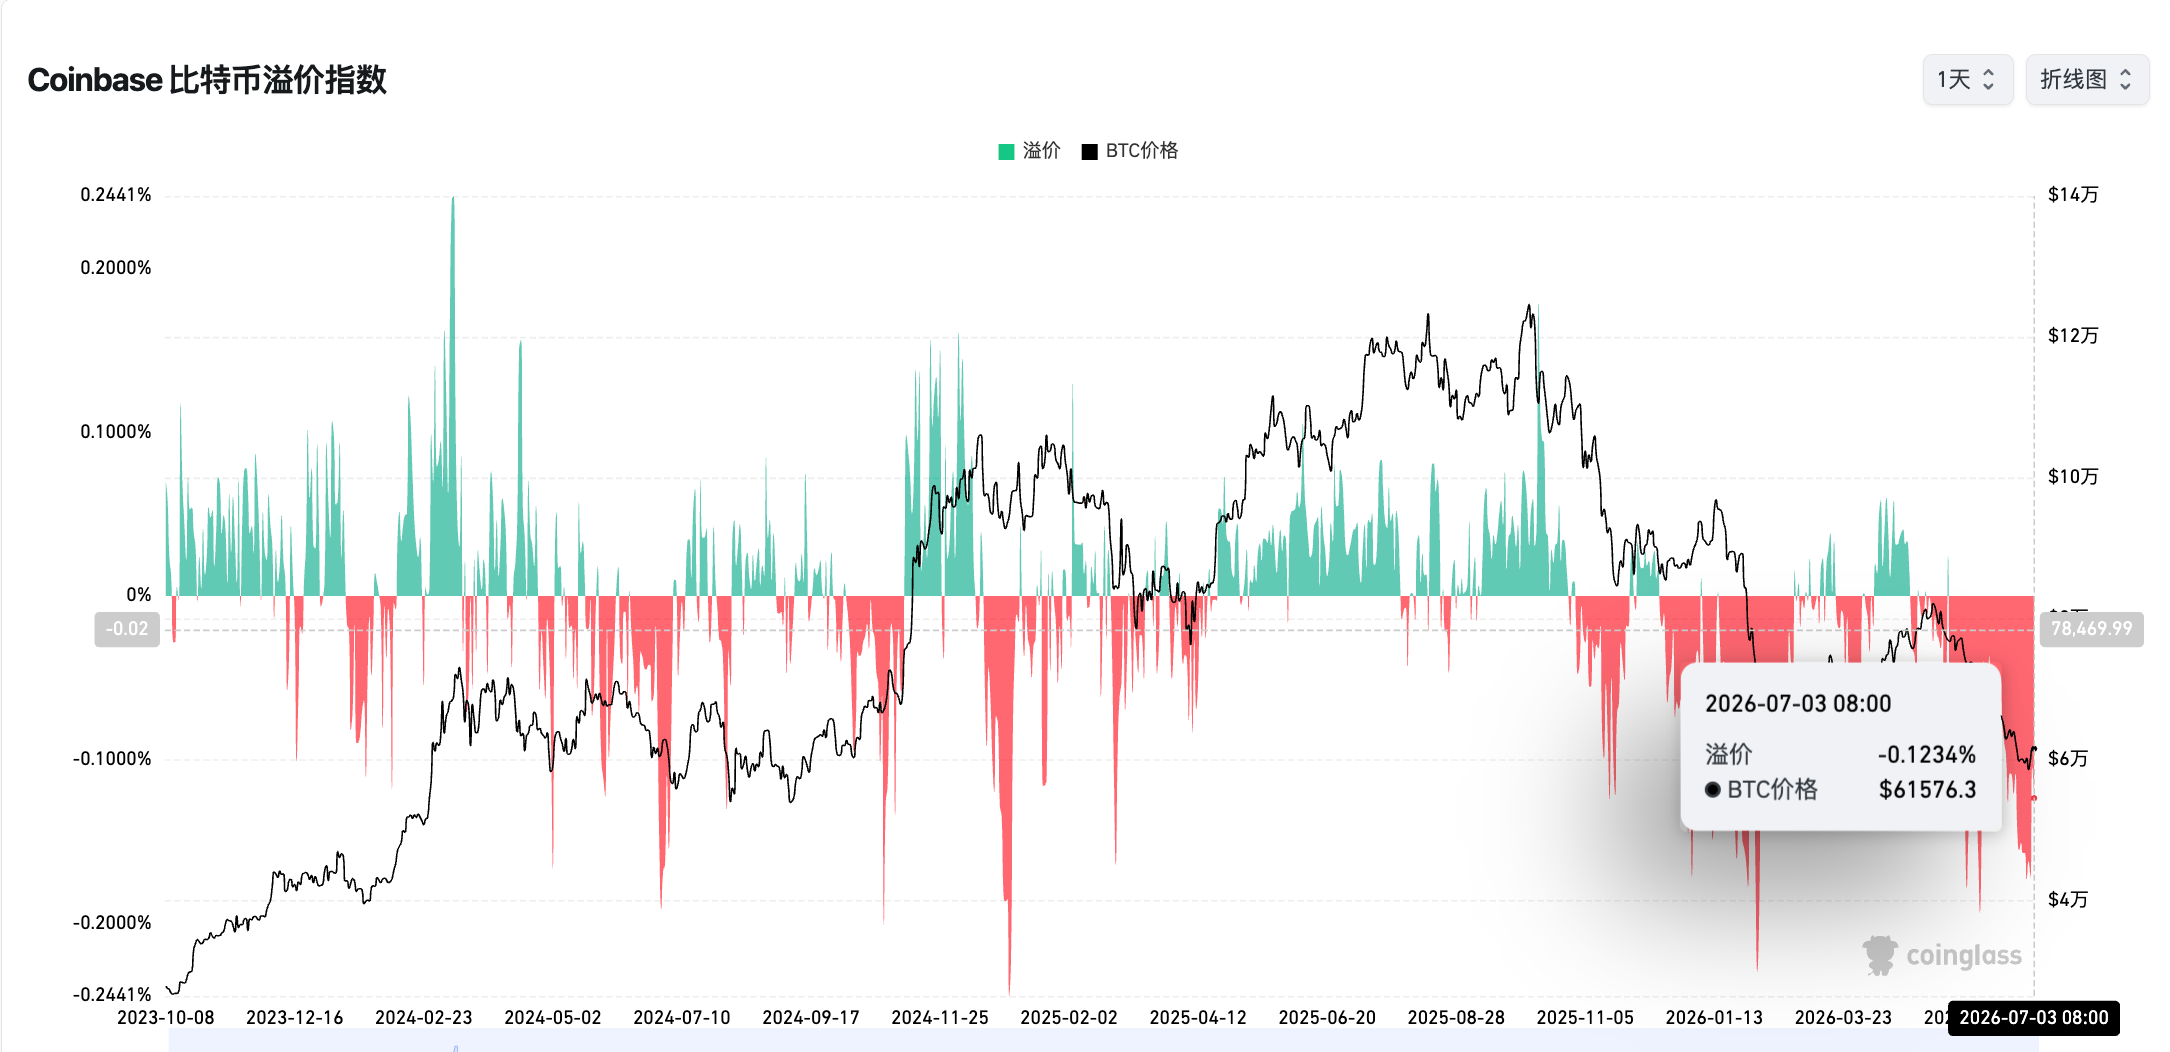
According to Coinglass data, from May 19 to today (July 3), the Coinbase Bitcoin Premium Index has been in a "negative" state for 46 consecutive days, setting a record for the "longest consecutive negative" streak. Previously, the index was in a negative premium for 40 consecutive days from January 16 to February 24 of this year, setting the longest consecutive negative record since the indicator's launch, surpassing the approximately 30-day consecutive negative premium period during last year's "October 11 crash."
Considering that BTC and ETH have broken through key price points like $58,000 and $1,600, the specific time for the end of the bear market remains unclear, and the wait is particularly agonizing for many.
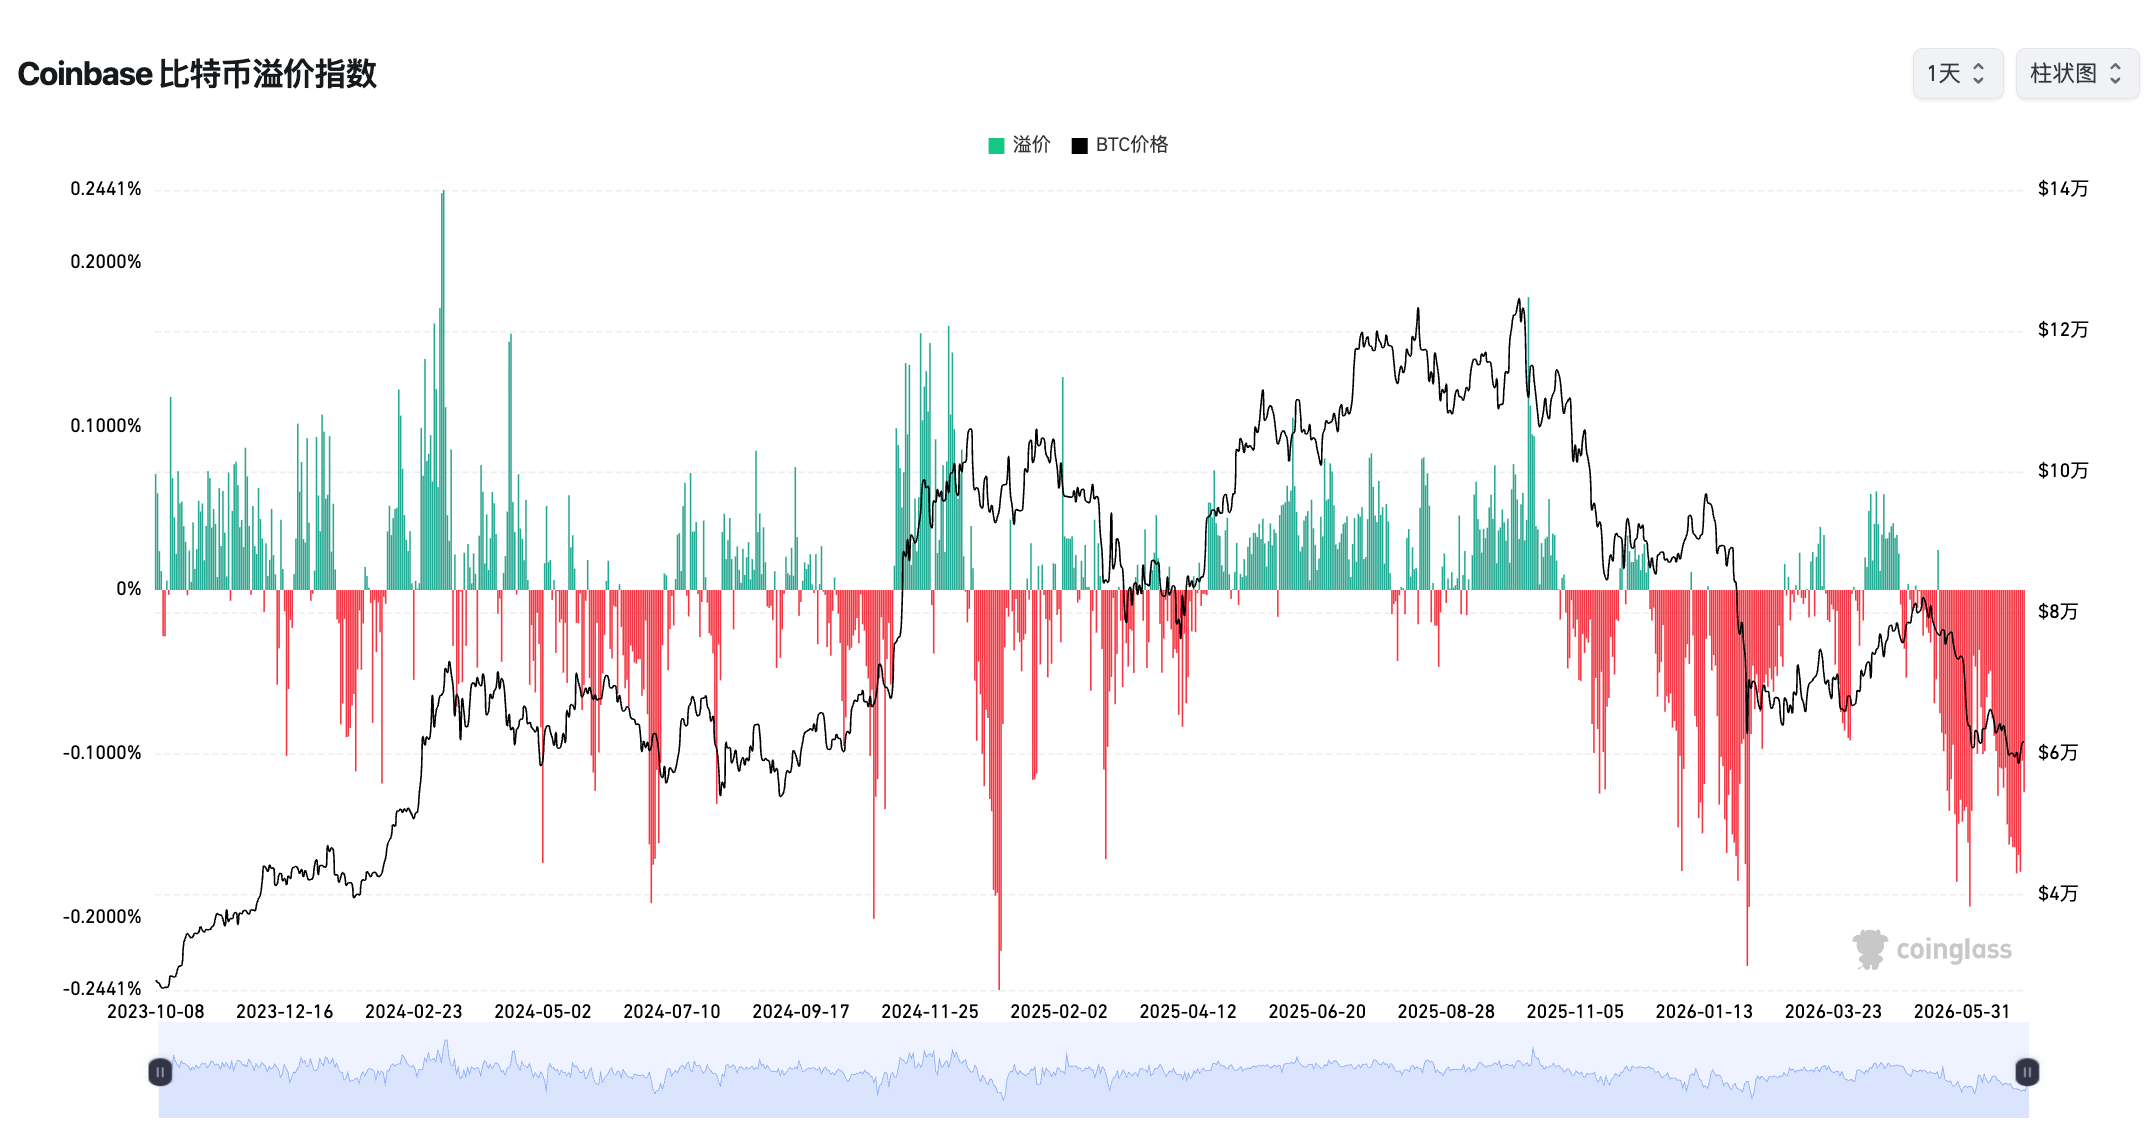
Overview of Coinbase Bitcoin Premium Index
The Biggest Trigger for BTC's Plunge: Strategy Sells BTC to Survive, Expanding the Circle of Losses
At the end of May and the beginning of June, Strategy, the largest BTC treasury company and a leading cryptocurrency concept stock, sold BTC for the first time in three years. This transaction, involving only 32 BTC, quickly triggered panic in the crypto market, acting like the last straw that broke the camel's back. The prices of mainstream coins like BTC, ETH, and SOL subsequently plummeted.
Combined with factors such as sustained net outflows from Bitcoin spot ETFs and continuous capital drain from the crypto market, the shadow of the crypto bear market once again looms over everyone in the industry.
Bear Market Onset: BTC Records Worst Weekly Performance Since 2022 in Early June
In the first week of June, Bitcoin briefly fell below $60,000, recording its worst weekly performance since the FTX exchange collapse in 2022. In the nearly 7 days up to June 7, Bitcoin had accumulated a decline of 16%, a retracement of over 50% from its historical high of over $126,000 in 2025.
Regarding the data at that time, U.S. spot Bitcoin ETFs had recorded net outflows for 13 consecutive trading days, with cumulative outflows of approximately $5.5 billion. Additionally, Bitcoin's price fell below the widely watched "200-week moving average," a key support level, further weakening market confidence.
Paul Howard, Senior Director at crypto trading firm Wincent, described the current market conditions as a "silent bear market," believing that breaking below the 200-week moving average is a crucial confirmation signal that the market has entered a bear phase.
Although BTC subsequently rebounded slightly to around $65,000, multiple market analysts warned at the time that the rebound might be unsustainable, and Bitcoin may not have hit the bottom of this cycle yet. Griffin Ardern, co-founder of Primal Fund, stated that the market is still a considerable distance from the "true bottom."
From the author's perspective, if the market still held hopes for a significant BTC rebound in May, Strategy's action of selling BTC to survive directly shattered people's last illusions, symbolically raising the curtain on "bear market confirmation."
Bear Market Continues: Predictions of Bear Market's End by Many Institutions Proved Wrong
On June 11, crypto research institution CryptoQuant stated in a post that Bitcoin might form a bottom around $53,600, which corresponds to the current realized price of Bitcoin – the average on-chain cost basis for all market participants. The report pointed out that in previous major bear market cycles, Bitcoin typically bottoms near or slightly below its realized price.
On June 12, BIT released its latest weekly report "Will the FIFA World Cup Mark the End of the Bitcoin Bear Market?" It argued that Bitcoin's current bearish trend is broadly consistent with its outlook from early February 2026, with the previously predicted A-B-C correction structure entering its final phase. After the A-wave decline to the $60,000-$69,000 range, Bitcoin rebounded to the $80,000-$90,000 range, peaked around $83,000, and then the rebound momentum gradually weakened.
BIT noted that the current Fear and Greed Index has approached historically low levels with significant reference value, still showing some similarity to the bottom structure of the 2022 bear market. It maintained its previous view that the seasonal summer trading lull during the 2026 World Cup could mark the end of the current Bitcoin bear market.
On June 17, crypto research firm K33 indicated that the supply of Bitcoin held by long-term holders has reached an all-time high, suggesting the bear market might be nearing its end. It emphasized that the reactivation of old coins in 2026 has been notably subdued, with only 218,421 Bitcoins reactivated as of June 6, indicating a significant decrease in on-chain selling pressure. In comparison, by the same period in 2024, 1.18 million Bitcoins had been reactivated. K33 believes that the decline in old coin activity signals a lower willingness of long-term holders to sell, and patient participants are continuously absorbing the supply.
However, the further decline in BTC soon shattered the illusions of these views, and the bear market's march continued.
Bear Market Indicators: STRC Decouples from $100, Losses Widen for Long-Term BTC and ETH Holders
On June 18, after falling below $95 earlier in the month, the price of STRC, a preferred stock issued by Strategy, dropped below $90, closing at $89, marking its lowest daily closing price since its IPO and its lowest dividend-adjusted closing price since November last year.
Subsequently, STRC continued to decline, remaining decoupled.
On June 26, STRC's pre-market price briefly fell to $73, hitting an all-time low. Market focus then shifted to two things: First, the ex-dividend date on June 30, where eligible holders would receive a $0.48 per share dividend on July 15; Second, the resetting of the monthly dividend rate, with STRC's effective yield near 15% at the time, leading investors to expect Strategy to raise the dividend rate from 11.50% to at least 12% or 12.50%.
Three days later, on June 29, Strategy officially announced a $1 billion digital credit security buyback program and a board-approved "up to $1.25 billion BTC monetization plan." Its dollar reserves also increased to $2.55 billion following the implementation of various fundraising plans, giving it the capacity to pay dividends on preferred stocks like STRC. STRC's discount crisis was temporarily resolved for the time being, with its price recovering to above $80, and it is currently trading at $87.87.
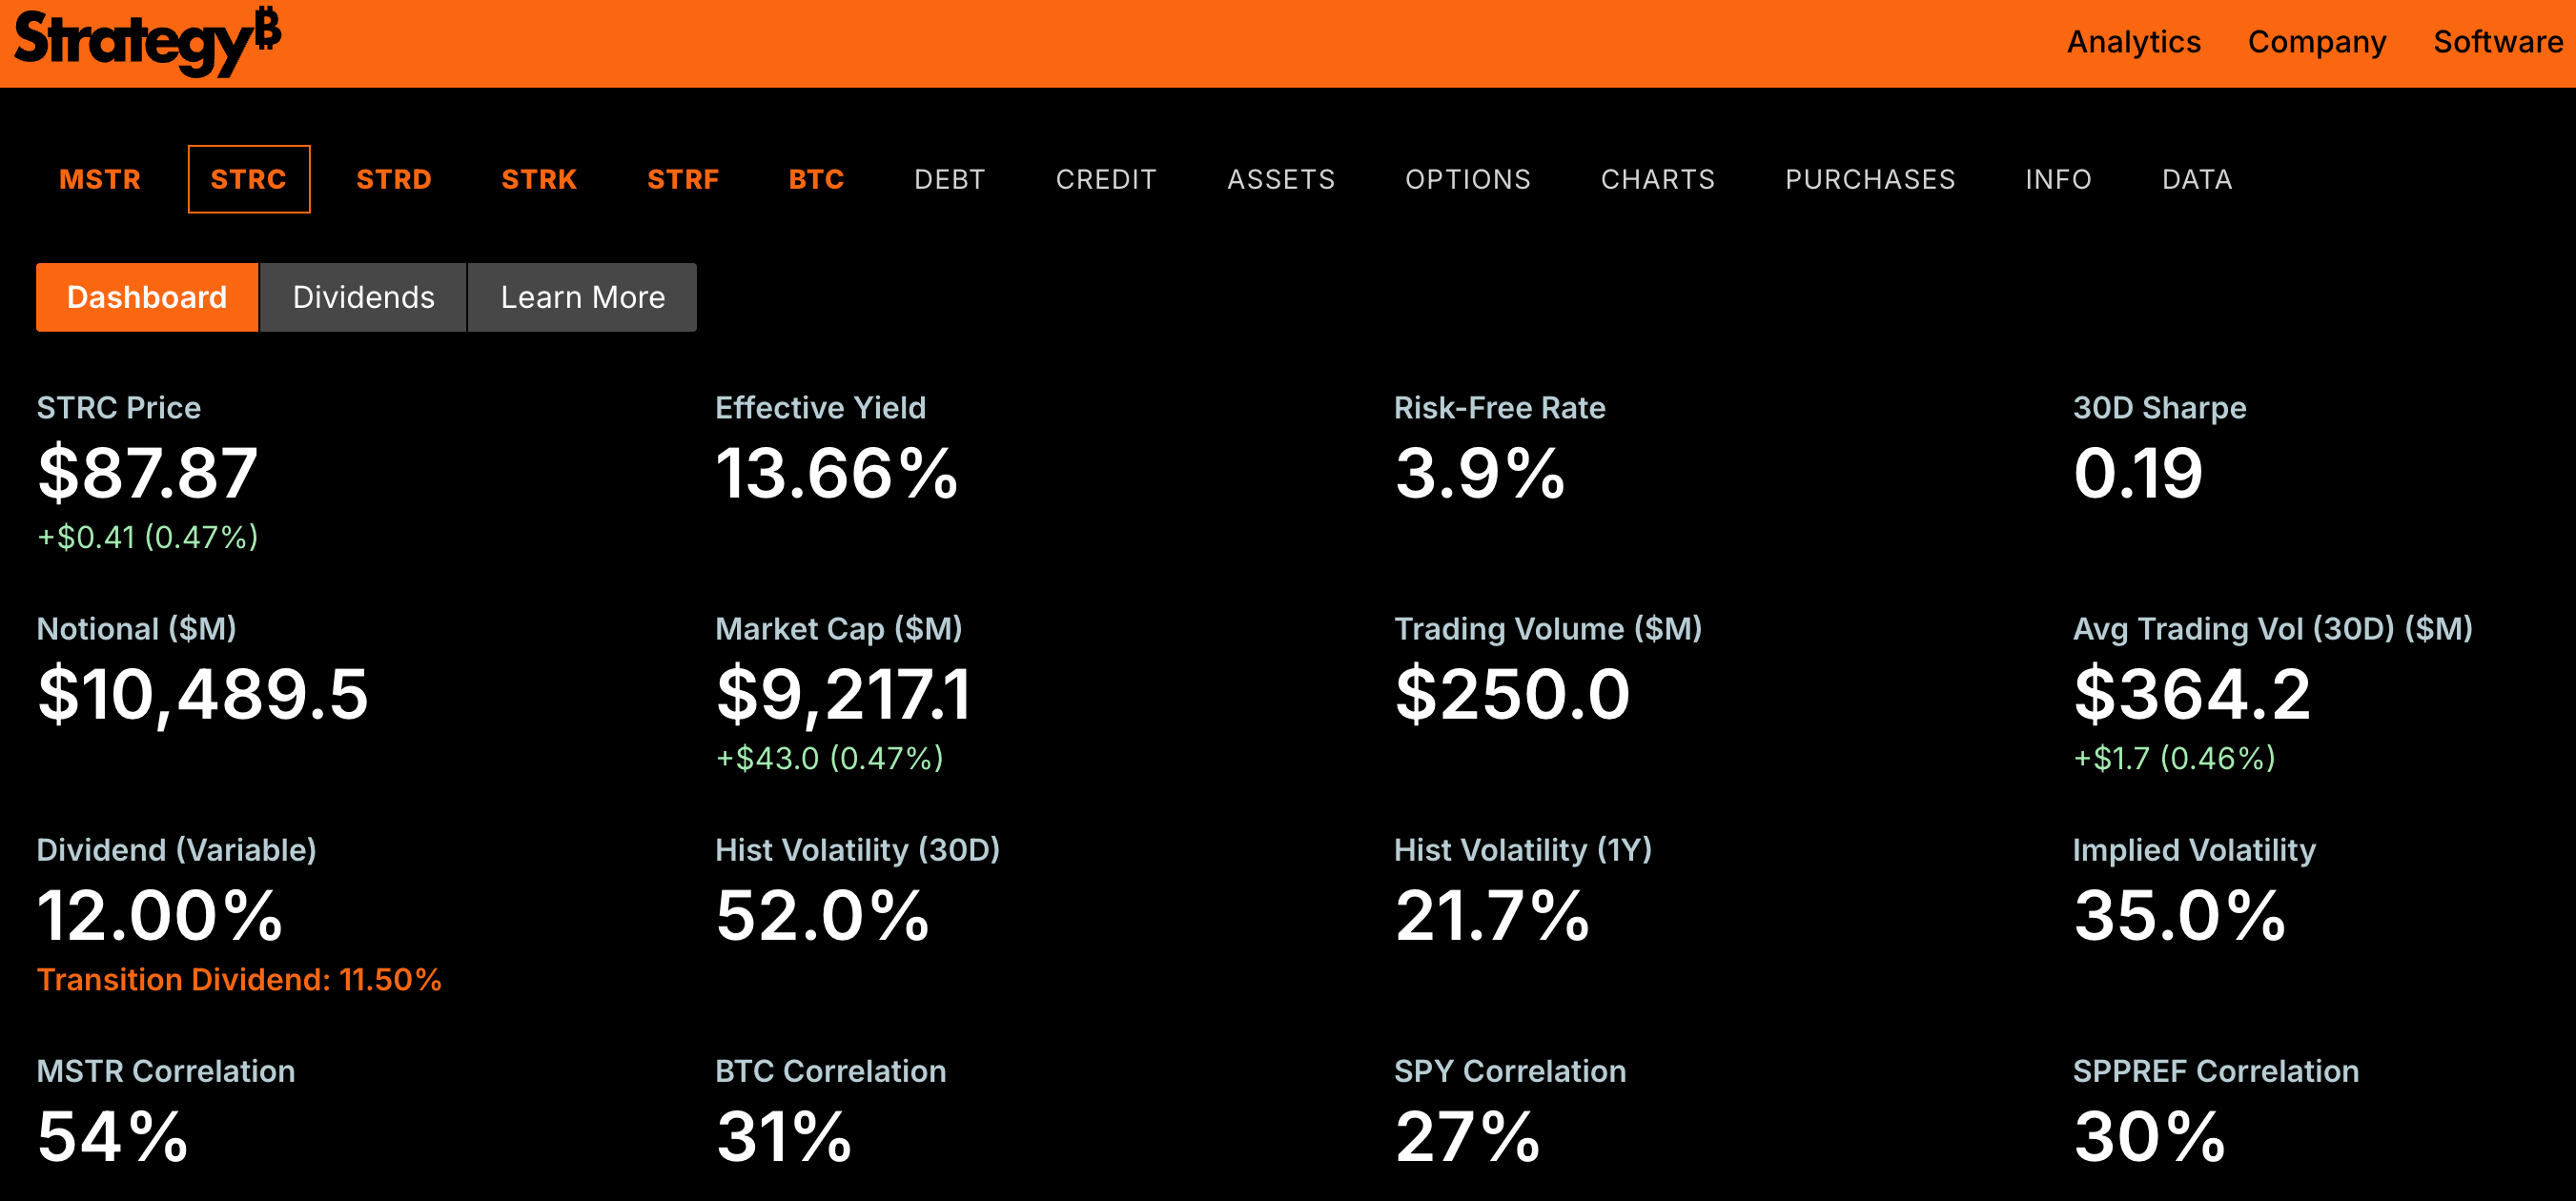
Source: Strategy Official Website
However, due to the continued decline of BTC and ETH, losses for long-term holders have further widened.
On June 25, Bitcoin briefly fell to around $59,100, with 10.83 million BTC in a loss-making state, a scale setting a new all-time high, exceeding the previous bear market bottom peak of about 10.5 million. Long-term holders (holding for at least 155 days) held a record 14.8 million BTC (Note from Odaily Planet Daily: The total circulating supply of Bitcoin is approximately 20 million coins), with 37% of them in a loss-making state. The latest data shows that the amount of BTC held long-term has increased to 16.61 million BTC today, while the average cost basis has dropped to around $49,700.
Data from June 26 showed that ETH whales have fallen into losses for the first time since 2019. Even during the 2022 bear market, the largest whales holding over 100,000 ETH remained profitable. The unrealized profit ratios for the three current categories of whale groups are all negative: -0.26 for the 1,000 to 10,000 ETH range, -0.21 for the 10,000 to 100,000 ETH range, and -0.05 for the 100,000+ ETH range. This situation has persisted for several weeks.
On June 28, Bitcoin UTXO data showed that the ratio of loss-making transactions to profitable transactions in the market has fallen to its lowest level of the current bear market cycle, indicating investors are entering a clear "capitulation" phase. A similar low was last seen during the depth of the mid-2023 bear market, when Bitcoin's price briefly fell to around $26,000.
Earlier, due to the continuous price decline, ETH's market cap briefly fell below $185 billion, being overtaken by USDT. Following a price rebound above $1,700, ETH's market cap is currently around $207 billion.
In summary, key indicators for the end of the bear market include STRC re-anchoring to $100 and long-term BTC and ETH holders moving out of their loss-making state.
Conjecturing the End of the Bear Market: August or December?
There is currently no mainstream consensus on the specific end date of the bear market. Here we only take the views of some industry participants as reference.
Yi Lihua: July-August Could Be a Prime Buying Opportunity
At the end of June, TrendResearch founder Yi Lihua stated in an article that the current decline is the third wave since the October 11 event. According to wave theory and cyclical patterns, this could be the last major wave of decline for Bitcoin.
The market is most concerned about Bitcoin's bottom price this time, with major factors being the US stock market and MicroStrategy. The Fed's concerns about CPI could trigger expectations of rate cuts or even hikes, leading to a continued correction in US stocks. Secondly, tail ends of past bear markets often featured black swan or blow-up events, which have not yet occurred this time and require close monitoring.
Based on Bitcoin's peak of $126,000, a 60% decline corresponds to $51,000, and a 66% decline corresponds to $43,000. In any case, July to August should be the final window, and also the best time to buy the dip, potentially the most worthwhile opportunity in the next three years.
Jiang Zhuoer: BTC Will Bottom at $42,000-$44,000 Between October and December
On June 25, LakeBTC mining pool founder Jiang Zhuoer posted a prediction that the current BTC bear market will bottom at $44,016 on October 31 this year. Integrating the pattern where mNAV leads the coin price by 6 months, the bottoming time window is revised to October to December 2026, with a bottom price range of $42,000 to $44,000.
He pointed out the underlying logic: Strategy's common stock MSTR's mNAV (ratio of stock price to BTC value per share) has fallen to 0.72, close to the lowest point of 0.7 during the previous bull market on May 11, 2022. Based on recent market sentiment events like the significant decoupling of STRC, it can be predicted that this is the lowest region for mNAV in this cycle. However, the lowest mNAV does not correspond to the lowest BTC price. In the previous cycle, when mNAV bottomed at 0.7 on May 11, 2022, the BTC price was $31,017, but BTC bottomed at $15,476 on November 21, 2022, when mNAV was 1.2, a gap of 6 months.
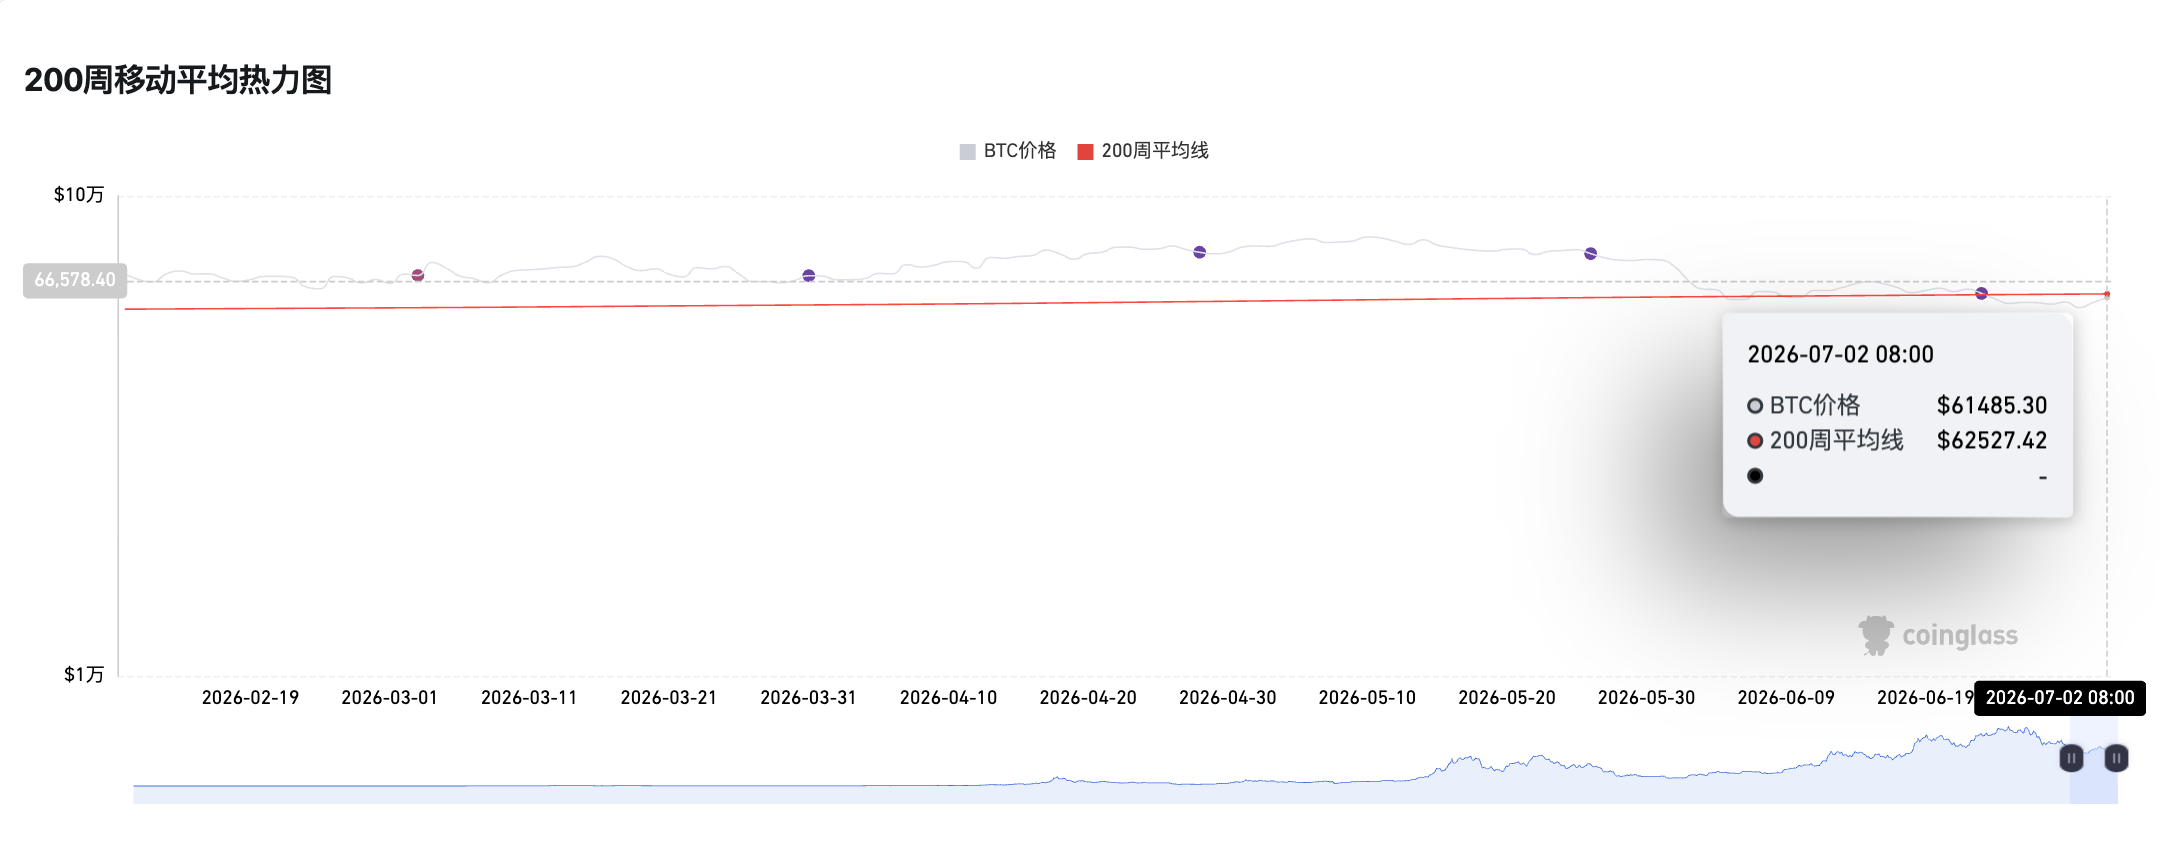
BTC Price Indicators: 4-Year Moving Average, 200-Week Moving Average Heatmap
According to Coinglass data, the BTC 4-Year Moving Average index showed that from June 25 to June 30, affected by BTC briefly falling below $59,000, the index briefly dropped to 0.95. It has now recovered to around 1 as BTC rebounded above $61,000.
According to the BTC 200-Week Moving Average Heatmap, BTC's price is currently roughly flat with the 200-week moving average and has been consistently below it since June 23, potentially suggesting a price bottom is forming.
Additionally, returning to the Coinbase Bitcoin Premium Index mentioned at the beginning of the article, it is currently still at the -0.123% level. Based on previous positive ranges, the index would likely need BTC prices to rebound to around $77,000 to turn positive again.
In summary, without strong external positive catalysts, this bear market will likely persist for at least another 2-3 months. The period from late September to early October will be a critical window for determining whether BTC can rebound.
Recommended Reading
4 Classic Bottom-Buying Indicators Have All Failed, 3 New Indicators Signal Buying Opportunity?


