
BTC Short-term Bullish Structure Confirmed, HYPE Buying Opportunity Window Opens | Analyst Insight
- Core Viewpoint: This week, the market is influenced by geopolitical and sentiment-driven fluctuations, with both BTC and HYPE at key technical levels. BTC needs to verify the effectiveness of the $65,000 support level. If it holds, it will challenge the $70,000 area. After completing a four-wave adjustment, HYPE needs to focus on its performance around the $62.5-$64.57 resistance zone, presenting short-term trading opportunities.
- Key Elements:
- After a complex 12-wave adjustment from the May 6 high of $82,850, BTC is currently in the 38-39 wave rebound. After breaking above $65,000, the next resistance zone is $69,500-$70,500.
- The medium-term bearish strategy for BTC is divided into three tiers: If BTC holds above $65,000, enter short positions upon encountering resistance in the $69,500-$70,500 zone (position size below 60%). If it loses $65,000, open a 30% short position tactically. If it breaks below $59,000-$60,000, increase the position to 60%.
- Key support levels for BTC are $65,000 (first support), $59,000-$60,000 (second support), and $55,000; core resistance levels are $69,500-$70,500 and $72,500-$74,500.
- Since its June 2 high of $75.87, HYPE has undergone a four-wave adjustment. It has now stabilized and bounced from the $52 support level. The upside resistance zone is $62.5-$64.57, where a descending high is highly likely to form.
- The short-term strategy for HYPE is "buying on dips": When the price retests the support zones of $52-$54.5 or $47-$49, combined with bottom signals from the model, one can cautiously open long positions, keeping the position size below 30%.
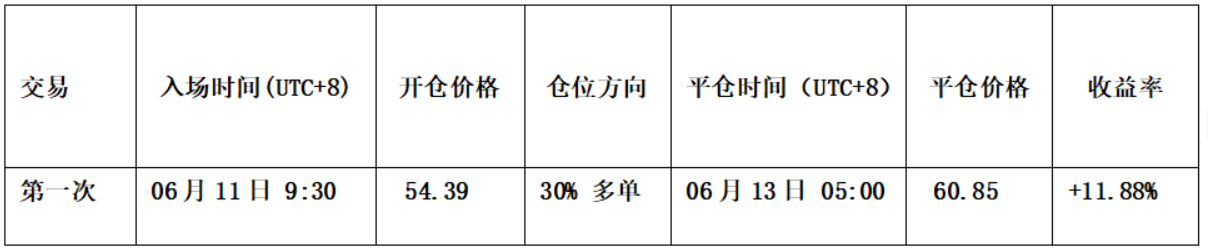
- Last week's short-term HYPE operation was successful: Based on the spread trading model and momentum quantification model, a long position was entered at $54.39 and closed at $60.85, achieving an 11.88% return.
This week's market environment is exceptionally complex—the unexpected implementation of the US-Iran agreement and the unblocking of the Strait of Hormuz have triggered a dramatic repricing of global assets. Amidst such intense emotional volatility, structural analysis proves most valuable. The louder the noise, the more crucial the framework.
This week, we focus on two main themes: After BTC surpassed the $65,000 mark, how will the outcome of the pullback confirmation game determine the subsequent direction; and for HYPE, after completing a four-segment adjustment, will the resistance test in the $62.5–$64.57 range present new short-term opportunities.
A complete structural analysis, market outlook, and trading strategies are detailed in the main text below.
This Week's Core Trading Thesis Summary:
• Analysis of BTC's hourly-level price structure. (Detailed in Part 1)
• BTC price forecast for this week and medium/short-term trading strategies. (Detailed in Part 2)
• Analysis of HYPE's hourly-level price structure. (Detailed in Part 3)
• HYPE price forecast for this week and short-term trading strategy. (Detailed in Part 4)
Market Validation of Last Week's Trading Strategy and Core Views:
• HYPE Short-term Trade Outcome: Completed one short-term long trade (1x leverage) last week, achieving a profit of approximately 11.88%. (Detailed in Table 1)
• BTC Price Forecast Market Validation: Last week's article pointed out that after an instantaneous dip below the $60,000 mark, support was found, triggering a short-term bounce to confirm the validity of the breakdown. Current market action validates our previous forecast.
• HYPE Price Forecast Market Validation: Last week's article pointed out that when HYPE retested the $55-$57 key support zone and showed signs of stabilization, combined with bottom signals triggered by our two proprietary models, one could consider opening light long positions. Current market action is highly consistent with our forecast.
I. In-Depth Analysis of Bitcoin's Hourly-Level Price Structure
Bitcoin 4-Hour K-line Chart
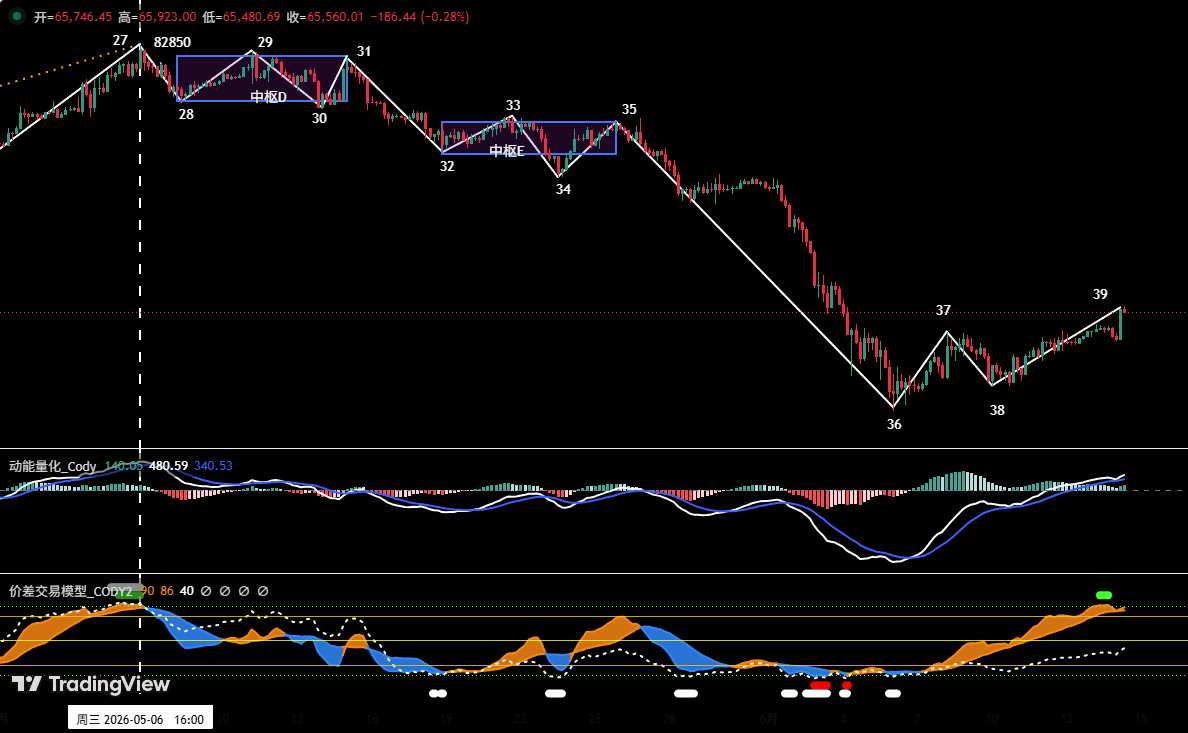
Figure 1
① As shown in Figure 1, since the correction from the $82,850 high on May 6, the 4-hour chart can be broken down into a 12-segment correction structure. This includes two downward consolidation ranges: Range D and Range E. The overall structure is clear, exhibiting a typical complex corrective pattern.
② According to the 4-hour structure, the market is currently in the 38th-39th segment of a rebound. The price has now reclaimed the $65,000 level. If the breakout is confirmed as valid in the coming sessions, the next major resistance for this rebound lies in the $69,500–$70,500 zone.
II. Bitcoin Price Forecast and Trading Strategy for This Week
1. BTC Price Forecast for This Week:
Core Thesis for the Week: Focus on the result of the pullback confirmation after the breakout above $65,000.
• If the pullback fails to hold, the market may retest the core support zone of $60,000–$62,000.
• If the price holds effectively, it will challenge the core resistance zone of $69,500–$70,500. This area is our primary target for planning medium-term short positions.
2. Key Resistance Levels:
• First Resistance Zone: $69,500–$70,500 (Previous high-volume trading area)
• Second Resistance Zone: $72,500–$74,500 (Previous high-volume trading area)
3. Key Support Levels:
• First Support Level: Around $65,000
• Second Support Zone: $59,000–$60,000 (Previous key support level)
• Third Support Level: Around $55,000 (Previous key support level)
4. This Week's Trading Strategy (Excluding Sudden News Impact)
① Medium-Term Strategy:
Bitcoin Daily K-line Chart: (Position Monitoring Model)
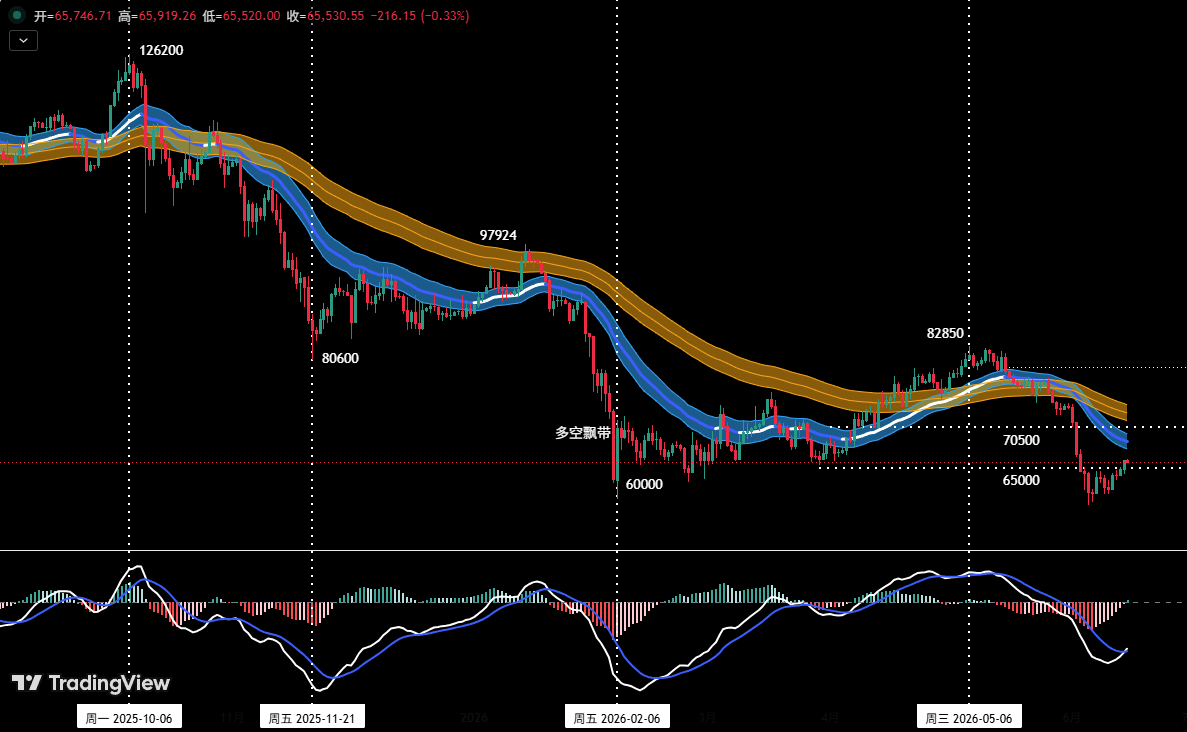
Figure 2
Position Monitoring Model: As shown in Figure 2, the current price has effectively broken below the "Bull-Bear Channel," transitioning the technical structure into a bearish-dominant pattern. Last week, the market did not trigger our planned short-position setup, so we currently hold no medium-term positions.
This week, based on the outcome of the battle between bulls and bears around $65,000, we can build medium-term short positions following a three-tier strategy:
• Add on Strong Resistance: If the price successfully holds the $65,000 zone and subsequently rallies to the $69,500–$70,500 zone showing clear signs of resistance (rejection), consider establishing medium-term short positions. Total position size should be kept below 60%.
• Go Short on Breakdown: If the price loses the $65,000 support level with a confirmed breakdown signal, initiate a base 30% medium-term short position accordingly.
• Add on Breakdown: If the price loses the $65,000 support and effectively breaks below the $59,000–$60,000 support zone, add to the short position. Total position size should be kept below 60%.
② Short-Term Strategy: Use 30% of capital with a stop-loss. Look for "Spread" opportunities based on support and resistance levels (using 30-min/60-min timeframe for operations).
③ To dynamically navigate complex market scenarios, we have prepared two specific operation plans in advance: Plan A/B.
• Plan A: Enter at Strong Resistance Zone.
• Entry: If the price successfully holds the $65,000 zone and subsequently rallies to the $69,500–$70,500 zone showing signs of exhaustion (stalling), combined with top signals from quantitative models, open short positions totaling less than 30% of capital.
• Risk Management: Set the initial stop-loss immediately.
• Exit: When the price pulls back near a key support level, combined with model signals, gradually close positions to lock in profits.
• Plan B: Sell Short upon Valid Breakdown of Support.
• Entry: If the price loses the $65,000 support level with a confirmed breakdown signal, open short positions totaling less than 30% of capital.
• Risk Management: Set the initial stop-loss immediately.
• Exit: When the price declines to a key support level, combined with model signals, gradually close positions to lock in profits.
III. Analysis of HYPE's Hourly-Level Price Structure
HYPE_4-Hour K-line Chart
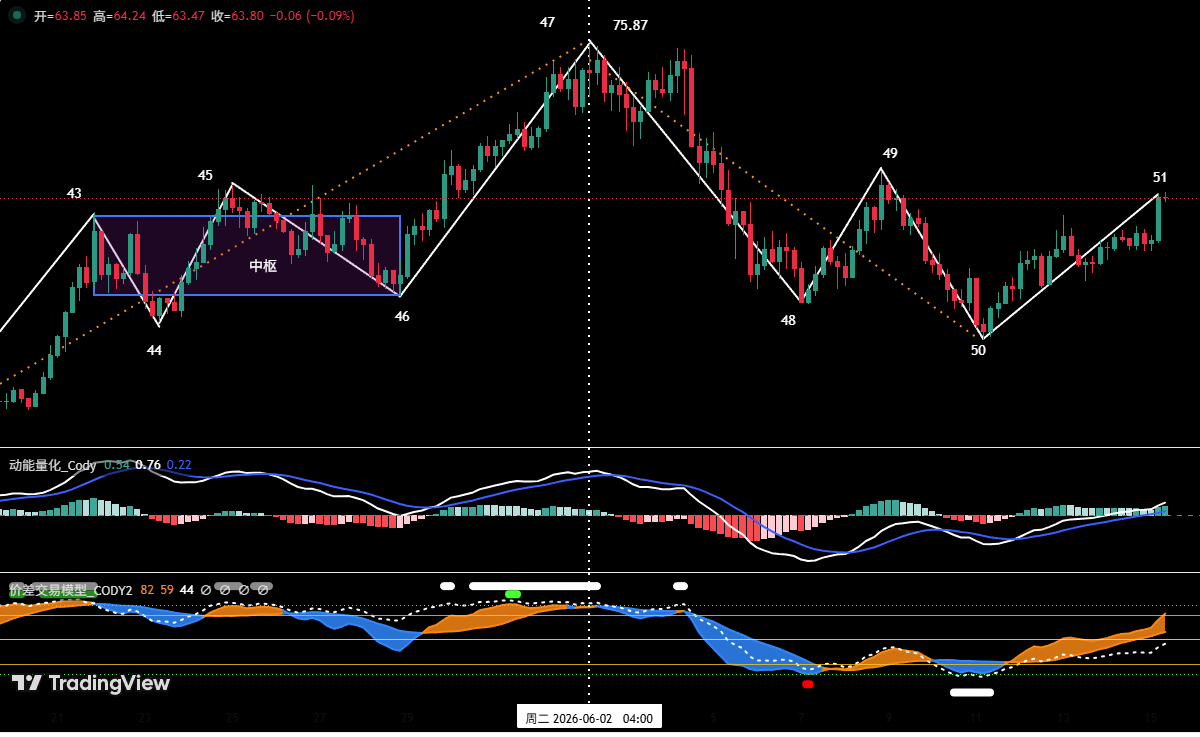
Figure 3
1. As shown in Figure 3, within the 4-hour timeframe, since the correction started from the high of $75.87 on June 2, HYPE can be broken down into a four-segment corrective structure: segments (47-48), (48-49), (49-50), and (50-51).
2. Currently, HYPE has stabilized and rebounded from the $52 support zone and is in the middle of the (50-51) rebound phase. The upside resistance lies in the $62.5 to $64.57 zone. If (point 51) forms a high within this zone (there is a high probability that the overall price structure will build a "downward consolidation range" here), then the price will continue to seek stronger support lower down.
IV. HYPE Price Forecast and Short-Term Trading Strategy for This Week
1. HYPE Price Forecast for This Week:
① Key Resistance Levels:
• First Resistance Zone: $62.5 – $64.57;
• Second Resistance Zone: $68 – $70;
② Key Support Levels:
• First Support Zone: $52 – $55.5;
• Second Support Zone: $47 – $49;
Core Thesis for HYPE This Week:
• Observe the resistance effect in the $62.5–$64.57 zone and the location where "End Point 51" forms the price high.
2. HYPE Short-Term Trading Strategy for This Week: (Go Long on Support)
This week's HYPE short-term trading should follow the strategy of "positioning for dips, avoiding chasing rallies."
Short-Term Strategy: Try Longs on Support Stabilization
When HYPE retests the $52–$54.5 zone or the deeper $47–$49 key support zone and shows signs of stopping its decline and stabilizing, combined with bottom signals triggered by our two major models, consider going long with a small test position. Position size must be kept under 30%, and strictly adhere to stop-loss discipline.
V. HYPE Trade Review
1. Short-Term Trade Review: (See Table 1)
Strictly following our operational plan and trade signals generated by our proprietary "Spread Trading Model" and "Momentum Quantitative Model," we completed one short-term long trade last week, achieving a profit of 11.88%.
2. HYPE Short-Term Trade Detail Summary: (Leverage*1x)
3. Short-Term Trade Review: (See Figure 4)
① Entry Strategy:
• A relatively complete downward correction structure had already unfolded previously;
• Our proprietary "Spread Trading Model" had issued a strong bottom warning signal in advance (red and white dots in the chart);
• Our proprietary "Momentum Quantitative Model" had issued a momentum bullish divergence signal;
Based on the above three conditions, we entered a 30% long position near $54.39.
② Exit Strategy:
• When the price rose near $62.5, it showed signs of meeting resistance;
• Our proprietary "Spread Trading Model" had issued a top warning signal in advance (white dots in the chart);
• Our proprietary "Momentum Quantitative Model" had issued a momentum bearish divergence signal;
Therefore, we closed all positions near $60.85.
③ Summary: This trade was successfully executed at a profit of approximately 11.88%.
HYPE_30-Minute K-line Chart: (Momentum Quantitative Model + Spread Trading Model)
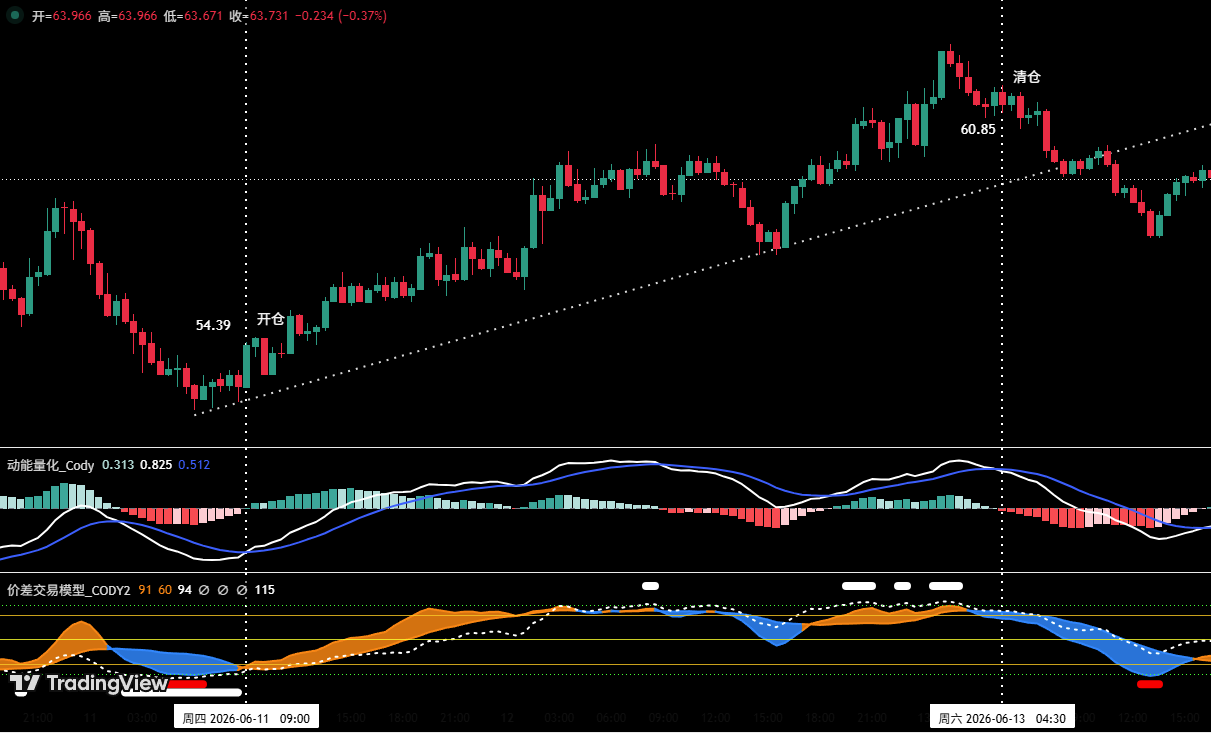
Figure 4 (Short-Term Trade Illustration)
VI. Special Reminders:
1. Upon Entry: Immediately set the initial stop-loss.
2. When Profit Reaches 1%: Move the stop-loss to the entry cost (break-even point) to protect capital.
3. When Profit Reaches 2%: Move the stop-loss to the 1% profit level.
4. Continuous Tracking: For every additional 1% profit thereafter, move the stop-loss up by 1% to dynamically protect and lock in profits.
Financial markets change rapidly; all market analysis and trading strategies require dynamic adjustment. All views, analytical models, and trading strategies mentioned in this article are derived from personal technical analysis. They serve solely as personal trading logs and do not constitute any investment advice or operational basis. The market carries risks, and investment requires caution. Please do not make decisions based solely on this content.


