
Bitcoin Tests the $80,000 Watershed Moment, HYPE Show Signs of a Potential Trend Shift | Sponsored Analysis
- Core Thesis: Bitcoin is currently at the critical resistance zone of $80,000-$81,000. This level is an important watershed for determining market direction; a successful breakout could signal a trend reversal, while failure could lead to a deep pullback. Simultaneously, HYPE exhibits a bearish structure, requiring a breakout confirmation before action.
- Key Factors:
- On the daily timeframe, Bitcoin's key resistance band is $79,500-$80,600. A clean break and consolidation above this level could mark the end of the correction since the October 2025 high, potentially initiating impulsive Wave I.
- If Bitcoin experiences a fake breakout or a "one-day wonder" reversal at this zone, the bounce's character would be a Wave D correction within a bearish continuation pattern, potentially leading to a breakdown below the prior low of $60,000.
- The hourly structure shows that the rebound from the March 30 low of $65,000 has formed a bullish consolidation center, making a test of the $80,600 level highly probable.
- HYPE's price action exhibits a potential reversal structure characterized by "breaking the prior low during a correction, failing to make a new high during the rally." The uptrend on the daily chart may have concluded at $45.76.
- This week's trading strategy suggests maintaining a neutral position for medium-term trades. Short-term traders can trade the range based on support and resistance levels, awaiting a clear resolution of Bitcoin's breakout before committing.
- If HYPE fails to break above its prior high of $45.76, the bearish structure will be confirmed; otherwise, it may follow Bitcoin's strength.
Bitcoin is standing before what I believe is its most critical price level in recent months. The $80,000 to $81,000 range is not just ordinary technical resistance; it's the "ceiling" of this long period of sideways volatility, and the true fork in the road determining the market's next direction.
If you've been watching and waiting during this time, I believe that patience has been correct. This week is still not the time to chase long positions. Whether the price can truly stand above this platform requires time to verify, and the risk of a "one-day wonder" fakeout remains. Before the structure is confirmed, the cost of a hasty entry often outweighs the regret of missing out.
However, I don't want to avoid another possibility: If Bitcoin truly breaks through effectively and holds this time, then these months of consolidation may be coming to an end. At that point, we will actively position for long trades, following the trend.
Key Trading Views Summary for This Week:
- BTC Multi-timeframe Structure Analysis (Detailed in Part 1)
- BTC Price Prediction & Medium/Short-term Trading Strategy for This Week (Detailed in Part 2)
- In-depth HYPE Hourly Structure Analysis (Detailed in Part 3)
- HYPE Price Prediction & Short-term Trading Strategy for This Week (Detailed in Part 4)
- Last Week's Trade Review: HYPE Short-term Long Trade Gained ~5.77% (Detailed in Part 5)
Therefore, the core of this week revolves around this one question—Can Bitcoin truly break through $80,000 to $81,000? Let's break it down layer by layer, from the daily chart down to the hourly level.
1. Bitcoin Multi-timeframe Structure Analysis
1.1 BTC Daily Level Structure Analysis: (Based on the market since the February 6, 2026 low)
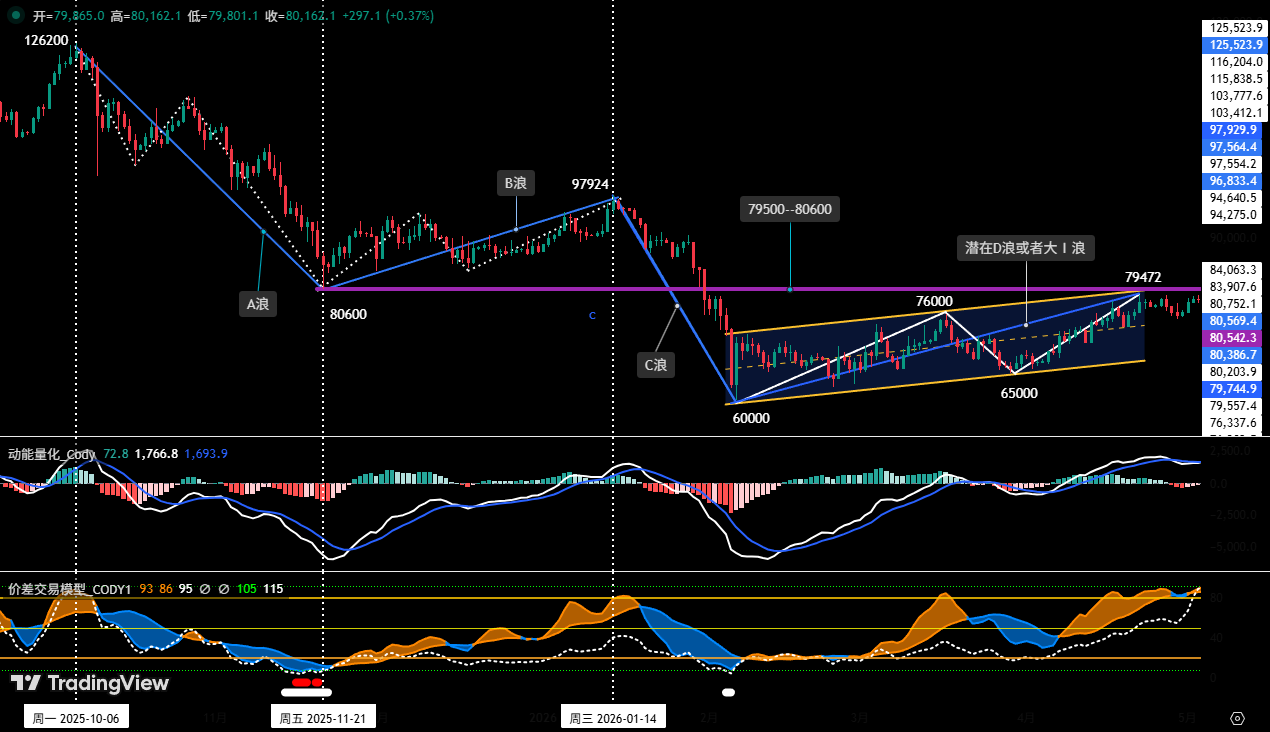
Figure 1
As shown in (Figure 1), Bitcoin is currently at a key price zone of $79,500 to $80,600 (marked in purple). This area has become the market's core "watershed." The effectiveness of this resistance will directly determine the nature and subsequent direction of the corrective rally that began from the February 6 low of $60,000.
Below is the analysis of the two core paths:
Path 1: Effective Breakout and Hold Upwards, Increasing the Likelihood of a Trend Reversal
- Trigger Condition: If the price effectively breaks through and stabilizes above this zone, with the upward momentum (in both price and time) continuing to expand.
- Technical Judgment: This could signify that the daily-level correction that started from the October 2025 high ($126,200) has ended at the February 6 low (~$60,000), and the market trend has potentially undergone a fundamental reversal.
- Outlook: This rally could be viewed as the start of a potential Primary Wave I (impulsive wave). A subsequent Primary Wave II (corrective wave) retracement is likely, but the probability of it completing above $60,000 is relatively high.
Path 2: Failed Breakout Upwards, Increasing Risk of a Bearish Continuation Pattern
- Trigger Condition: The price meets resistance in this zone, exhibits a "one-day wonder" or "fakeout" pattern, and then rapidly declines.
- Technical Judgment: The nature of this rally is more likely a Wave D bounce within a potential downtrend, rather than a trend reversal.
- Outlook: The bounce will be followed by a Wave E decline, with a relatively high probability of breaking below the previous low of $60,000.
Summary: In short, this price zone is a litmus test for market sentiment. Holding above it opens up bullish potential; failure suggests a possible deeper retracement. The outcome of the battle between bulls and bears in this zone will guide the core direction for the next phase and is a key reference for analyzing potential shifts in market structure.
2. BTC Hourly Level Structure In-depth Analysis: (Using 4-hour timeframe)
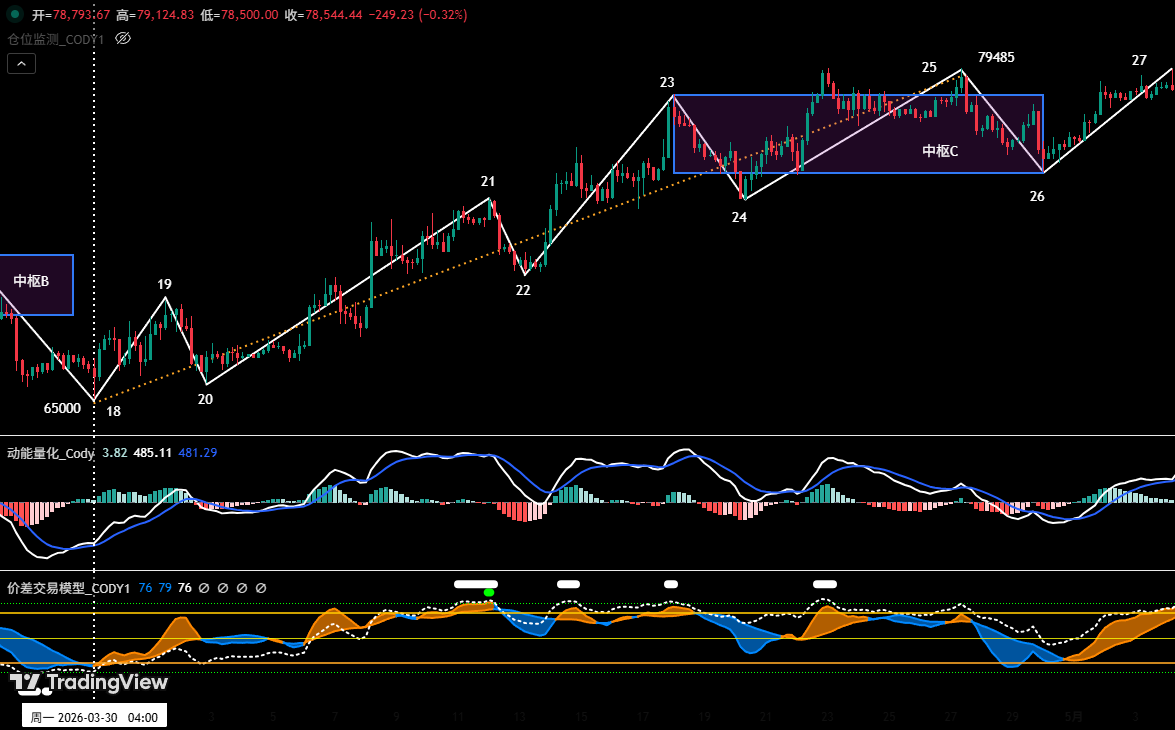
Figure 2
As shown in (Figure 2), the daily-level rally starting from the March 30 low of $65,000 can be subdivided into nine structural segments on the 4-hour chart: 18-19, 19-20, 20-21, 21-22, 22-23, 23-24, 24-25, 25-26, and 26-27. Among these, segments 23-24, 24-25, and 25-26 overlap with each other, forming a "Consolidation Zone C." Currently, the market is running the departure segment (26-27).
Since Consolidation Zone C is a bullish consolidation zone, it is highly probable that the end point of the departure segment (point 27) will break the previous high of $79,485 and challenge the $80,600 level.
2. BTC Price Prediction & Trading Strategy for This Week
1. BTC Price Prediction for This Week:
Core View for This Week: It is expected that the price will likely test the resistance effect around $80,600 this week. Focus on whether it can effectively break through the key resistance zone of $79,500 to $80,600. Although easing geopolitical tensions provide short-term upward momentum, the market is more likely to exhibit a wide-range consolidation pattern under macro pressures and structural contradictions.
2. Key Resistance Levels:
- First Resistance Zone: $79,500 ~ $81,000 (Near the November 2025 low)
- Second Resistance Zone: $83,500 ~ $84,500 (Previous high-volume consolidation area for bulls and bears)
3. Key Support Levels:
- First Support Level: Around $78,500 (Near the upper boundary of the consolidation zone)
- Second Support Zone: $73,500 ~ $75,000 (Previous important support level)
- Third Support Zone: $69,500 ~ $70,500 (Previous important support level)
4. Trading Strategy for This Week (Excluding unexpected news impact)
① Medium-term Strategy:
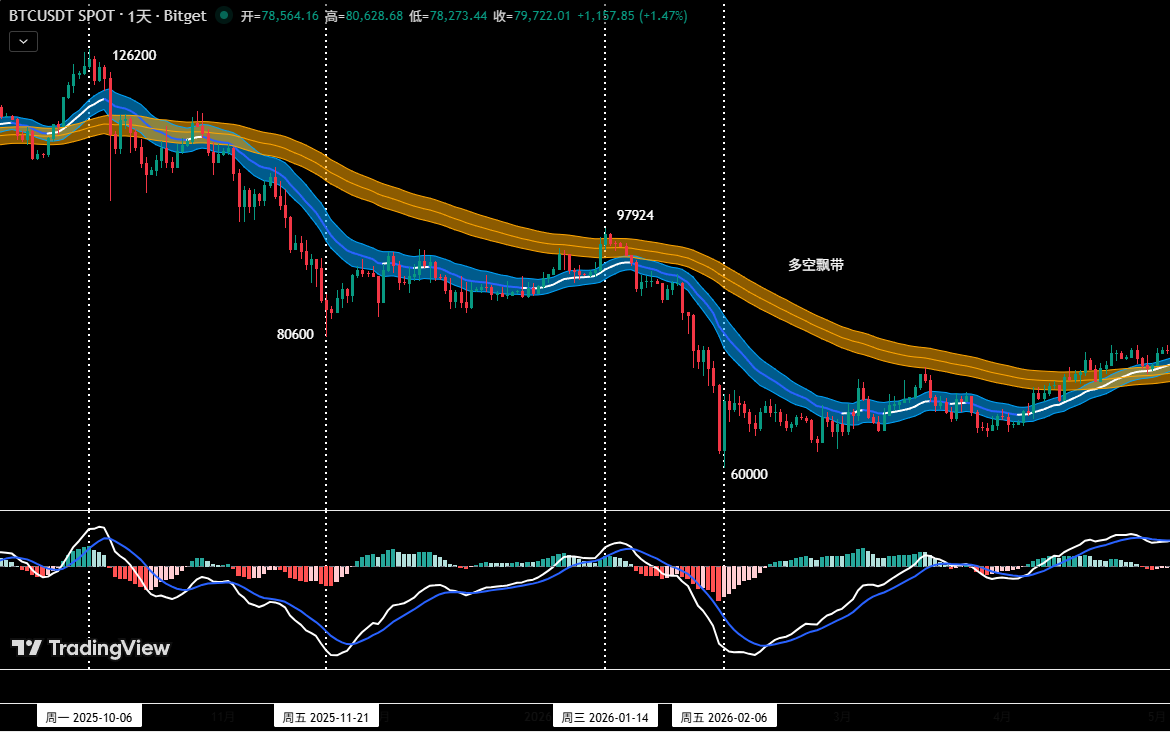
Figure 3
Position Monitoring Model: As shown in (Figure 3), based on trading rules, while Bitcoin has broken above the upper band of the bull-bear ribbon but confirmation is pending, the medium-term strategy for this week is to maintain a cash position and observe. We recommend waiting for the breakout result to be confirmed before entering positions and avoid chasing rallies or selling into declines.
② Short-term Strategy: Utilize 30% of capital, set stop-losses, and look for "spread" trading opportunities based on support and resistance levels. (Use 30-min / 60-min timeframe)
③ A/B Action Plan: Currently, Bitcoin is about to test the core $79,500 ~ $80,600 zone, leading to increased intraday volatility. For short-term operations, to dynamically respond to complex market evolution, prudent investors should abandon subjective bias. Instead, rely on objective structural analysis and quantitative model signals to formulate and strictly execute two specific action plans (A/B) in advance.
Plan A: Effective Breakout and Hold – Buy on Dips Following the Trend.
- Entry: If the price effectively breaks through and holds the $79,500 ~ $80,600 zone, combined with a bottom signal from the quantitative model, establish a 30% long position.
- Risk Management: Initial stop-loss set below $78,500.
- Exit: When the price bounces to key resistance levels combined with model signals, gradually close the position to take profits.
Plan B: Effective Breakdown of Support – Sell on Rallies into Strength.
- Entry: If the price effectively breaks below support near $75,000 combined with a top signal from the quantitative model, establish a 30% short position.
- Risk Management: Initial stop-loss set above $76,500.
- Exit: When the price declines to key support levels combined with model signals, gradually close the position to take profits.
Moving on from Bitcoin, let's discuss HYPE.
In my view, the current structure shows relatively classic trend reversal signals – upward momentum is clearly weakening, and the strength of bounces is also narrowing. Of course, the outlook isn't set in stone. If it can effectively break through the previous high of $45.76 later on, the uptrend is not over, and it will likely follow Bitcoin's strength. After all, if BTC successfully holds that platform, overall market sentiment will lift, and HYPE is unlikely to remain unaffected.
But before the breakout is confirmed, my advice is: Those who already hold positions should set take-profit levels to protect existing profits; those without positions should continue to observe and avoid rushing to chase the price. Let the structure speak before we make a decision.
3. In-depth HYPE Structure Analysis
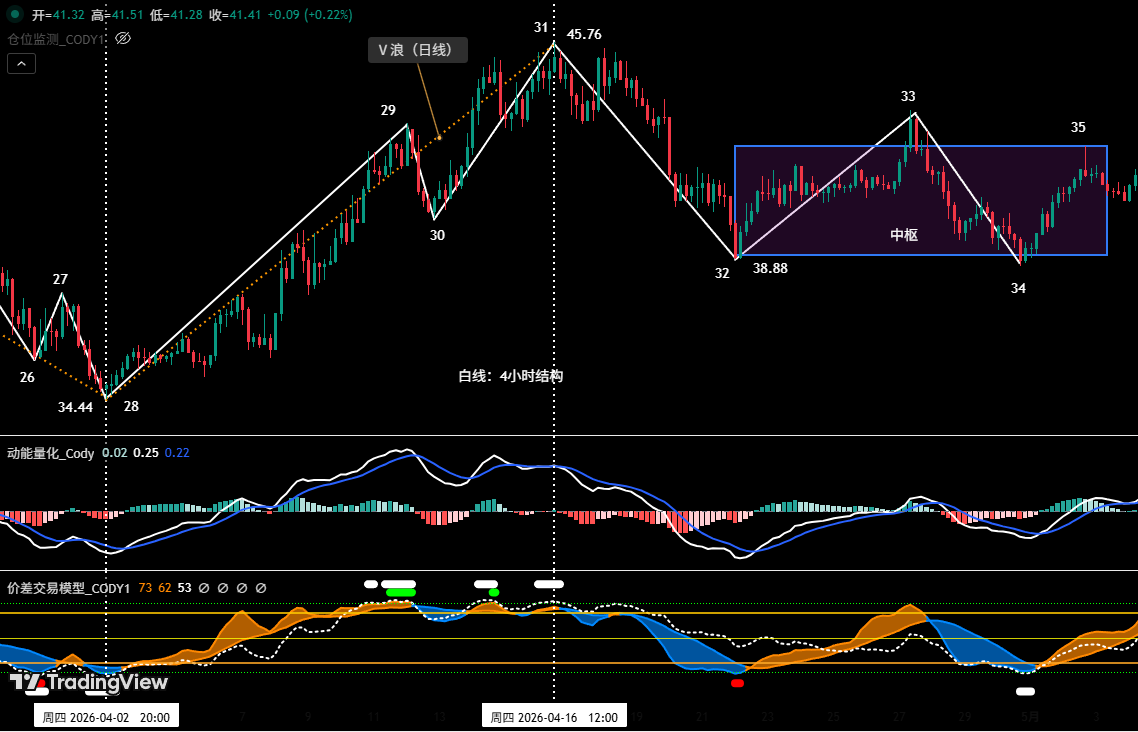
Figure 4
1. As shown in (Figure 1), the corrective move starting from the April 16 high of $45.76 can be subdivided into four segments on the 4-hour chart: 31-32, 32-33, 33-34, and 34-35. Among these, segments 32-33, 33-34, and 34-35 overlap with each other, jointly forming a "Bearish Consolidation Zone." Currently, the market is running the 34-35 segment.
2. On the 4-hour chart, HYPE's current price action shows classic trend reversal signals. Specifically, during the corrective segment (point 32), the price broke below the previous low (point 30, $40.17). Subsequently, the rebound segment (point 33) failed to make a new high (i.e., failed to break point 31, $45.76). This constitutes a potential revers al structure: "correction breaks the previous low, rebound does not make a new high." Therefore, technical analysis suggests that the daily uptrend starting from the April 2 low of $34.44 likely ended at the previous high of $45.76, and the market is currently in a daily-level correction phase. If the price effectively breaks below the key support level around $38 subsequently, it will provide further confirmation of this conclusion. Unless the price can effectively break through and hold the $45.76 high in the future, this bearish structure will remain intact, and only then could the market trend reverse.
4. HYPE Price Prediction & Short-term Trading Strategy for This Week
1. HYPE Price Prediction for This Week:
Core View for HYPE This Week: Focus on whether the ongoing 34-35 segment can effectively break through the previous high of $45.76.
2. HYPE Short-term Trading Strategy for This Week:
- Based on the assessment that HYPE's overall trend is turning into "correction or consolidation," the short-term trading principle should be "follow the trend, sell on rallies into strength."
- Utilize our proprietary quantitative model signals, operating on a 30-min / 60-min timeframe, using 30% of capital to capture entry opportunities.
- Entry Strategy: This week, if signs of resistance appear during the 34-35 segment rebound (point 35 closing below $45.76), combined with top signals triggered by our two main models, consider entering short positions. Position size must be controlled below 30%, and strictly adhere to stop-loss discipline.
5. HYPE Trade Review (04.27 ~ 05.03)
Market Validation of Last Week's Trading Strategy and Core Views:
- HYPE Short-term Trade Outcome: Completed one short-term long trade on HYPE last week (1x leverage), achieving a gain of approximately 5.77%. (See Table 1 for details)
- BTC Price Prediction Validation: In last week's article, we noted the price faced dual resistance from the daily channel upper boundary and the core $79,500-$80,600 zone, suggesting a direct breakout would be difficult. The market's subsequent action validated our earlier forecast.
1. Short-term Trade Review: (See Table 1)
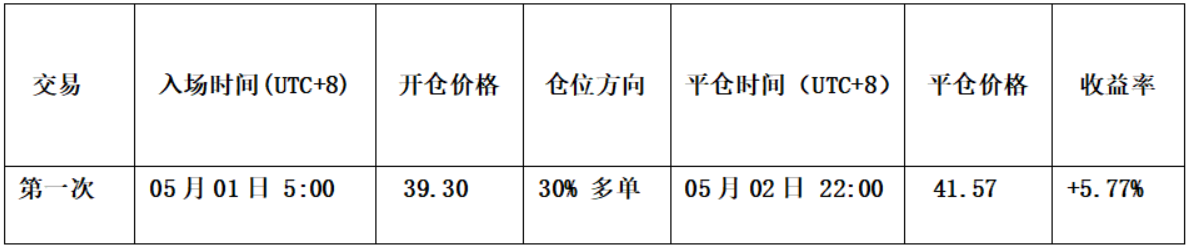
Table 1
2. Short-term Trade Analysis: (See Figure 5)
- Entry Strategy: First, the preceding price action had completed a full corrective structure. Second, the spread trading model had issued a strong early bottom warning signal (red dot, white dot in the chart). Third, the momentum quantitative model triggered a bullish divergence signal. Therefore, we established a 30% long position at $39.30.
- Exit Strategy: When the price showed resistance signals near $42.5, and the spread trading model triggered a top warning signal (green dot, white dot), we completely closed the position around $41.57.
- Summary: This trade successfully realized a profit of approximately 5.77%.
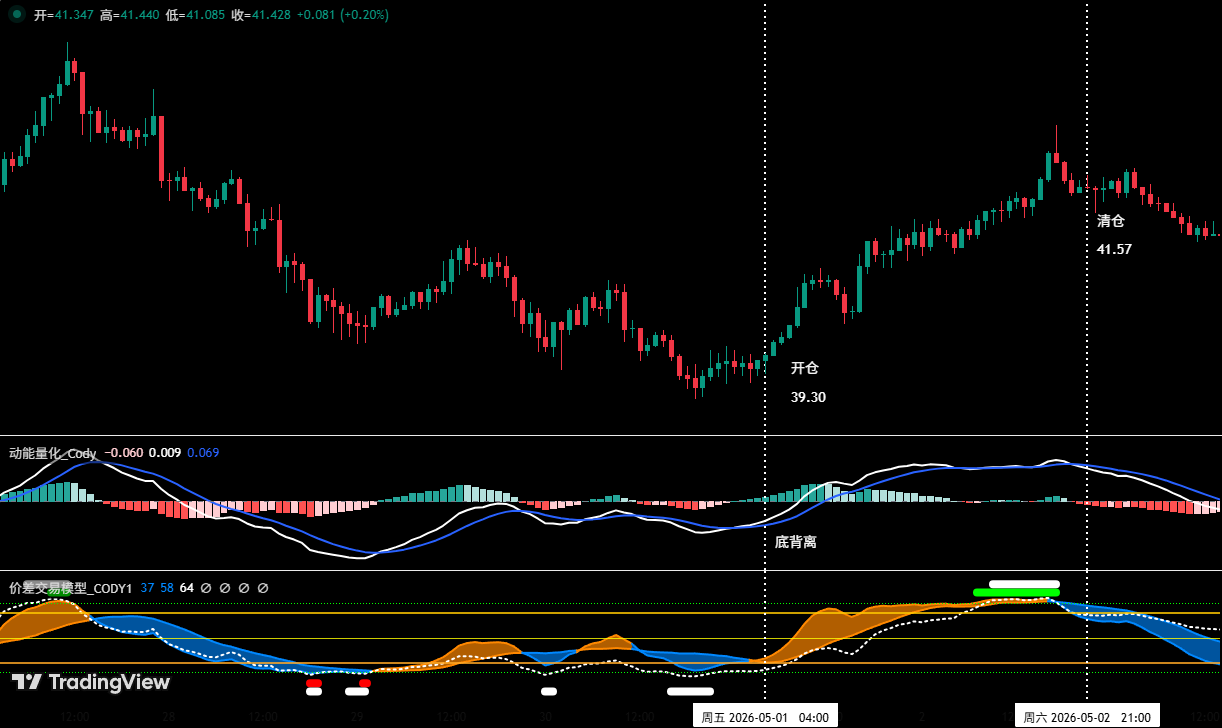
Figure 5
6. Special Reminders:
- Upon Entry: Immediately set the initial stop-loss.
- When Profit Reaches 1%: Move the stop-loss to the entry cost price (break-even point) to secure capital.
- When Profit Reaches 2%: Move the stop-loss to the 1% profit level.
- Continuous Tracking: For every subsequent 1% increase in profit, move the stop-loss up by 1% to dynamically protect and lock in profits.
Financial markets are highly dynamic. All market analysis and trading strategies require real-time adjustments. The views, analytical models, and strategies presented here are derived from personal technical analysis and serve solely as personal trading journal entries. They do not constitute investment advice or trading recommendations. Markets carry risks; invest with caution. Do not base decisions solely on this content.


