BTC ดีดตัวเกินขายแล้วใกล้จบ, HYPE วิ่งขึ้นช่องทางเดียว|บทวิเคราะห์พิเศษ


- มุมมองหลัก: หลังจาก BTC ทำจุดสูงสุดใหม่ของการดีดตัวที่ 87,399 ดอลลาร์เมื่อวันที่ 21 กันยายน ก็แกว่งตัวออกข้างต่อเนื่อง ในช่วงครึ่งแรกของสัปดาห์นี้มีโอกาสสูงมากที่จะทำจุดสูงสุดใหม่ของคลื่น e แต่โมเดลเชิงปริมาณสองตัวกำลังจะส่งสัญญาณยอดรวมกัน โดย 87,500–90,000 ดอลลาร์อาจเป็นจุดสิ้นสุดของคลื่น e อย่าตามซื้อ
- ประเด็นสำคัญ:
- BTC แกว่งตัวในกรอบ 82,500–87,500 ดอลลาร์เป็นเวลาสองสัปดาห์ วันที่ 4 ตุลาคมปิดบวก 2.09% ยืนเหนือเส้นล่างของกล่องบนที่ 85,500 ดอลลาร์ได้ ทำให้โอกาสเบรกจุดสูงสุดเดิมเพิ่มขึ้น
- “โมเดลเชิงปริมาณโมเมนตัม” ที่สร้างขึ้นเองแสดงอาการflatตัวที่ยอด ส่วน “โมเดลซื้อขายส่วนต่างราคา” อยู่ในระดับสูง หากราคาเหรียญปรับขึ้นอีกจะกระตุ้นสัญญาณเตือนยอดรวมกัน
- คลื่น e เริ่มต้นจาก 74,955 ดอลลาร์และดำเนินมาแล้ว 19 วันทำการ โดย涨幅สูงสุดในช่วงอยู่ที่ 16.6% โซนสิ้นสุดชี้ไปที่ 87,500–90,000 ดอลลาร์
- หากราคาเหรียญหลุดโซนแนวรับ 80,500–82,500 ดอลลาร์ จุดสูงสุดเมื่อวันที่ 21 กันยายนก็จะเป็นจุดสิ้นสุดของคลื่น e และการดีดตัวเกินขายจะสิ้นสุดลง
- HYPE ย้อนกลับมาแตะ 84.92 ดอลลาร์แล้วทรงตัว ช่องทางขาขึ้นยังสมบูรณ์ จับตาการต่อสู้ระหว่างฝ่ายซื้อและฝ่ายขายในโซนแนวต้าน 92–94 ดอลลาร์และโซนแนวรับ 84–85 ดอลลาร์
- กลยุทธ์ระยะกลางเน้นถือเงินสดรอดูเป็นหลัก ระยะสั้นสามารถใช้ 30% ของพอร์ตทำส่วนต่างราคา จับตาการลองเปิดสถานะขายในโซนแนวต้านแข็งและการเปิดสถานะขายตามแนวโน้มเมื่อเบรกได้อย่างมีประสิทธิภาพ เป็นสองแผนสำรอง
Sideways for two weeks, direction approaching. BTC has been repeatedly oscillating within the $82,500–$87,500 range since hitting a rebound high of $87,399 on September 21. On October 4, the price regained its footing above $85,500, and the probability of refreshing the new high of wave e in the first half of this week is extremely high.
However, a new high may not be a new starting point. Two self-built quantitative models are about to form a top signal resonance, and $87,500–$90,000 may be exactly where wave e ends. At this point, should you chase or should you wait?
On the other side, HYPE pulled back to $84.92 as expected and then stabilized, with the upward channel still intact. The battle between bulls and bears at the upper and lower rails of the channel remains this week's focal point.
In this week's review, we break it down one by one.
Summary of This Week's Core Trading Views:
• BTC daily-level trend structure analysis (see Part One for details)
• BTC this week's market forecast and medium-/short-term trading strategy (see Part Two for details)
• HYPE daily-level trend structure analysis (see Part Three for details)
• HYPE this week's market forecast and short-term trading strategy (see Part Four for details)
1. Bitcoin Daily-Level Trend Structure Analysis
In the previous weekly review, this column introduced the Elliott Wave theory system and conducted a systematic decomposition and forward-looking assessment of BTC's daily wave structure since the rebound from the July 1 low. At that time, we concluded: since the rebound, the price has clearly formed an a→e five-wave upward structure, and wave e is in its running phase, not yet complete.
This week, we continue to use the previous analytical framework to examine the new changes that have occurred in the existing five-wave upward structure after a week of market movement, and focus on determining whether the wave e rebound has already ended. With these questions in mind, we conduct a structural re-examination of the latest market action.
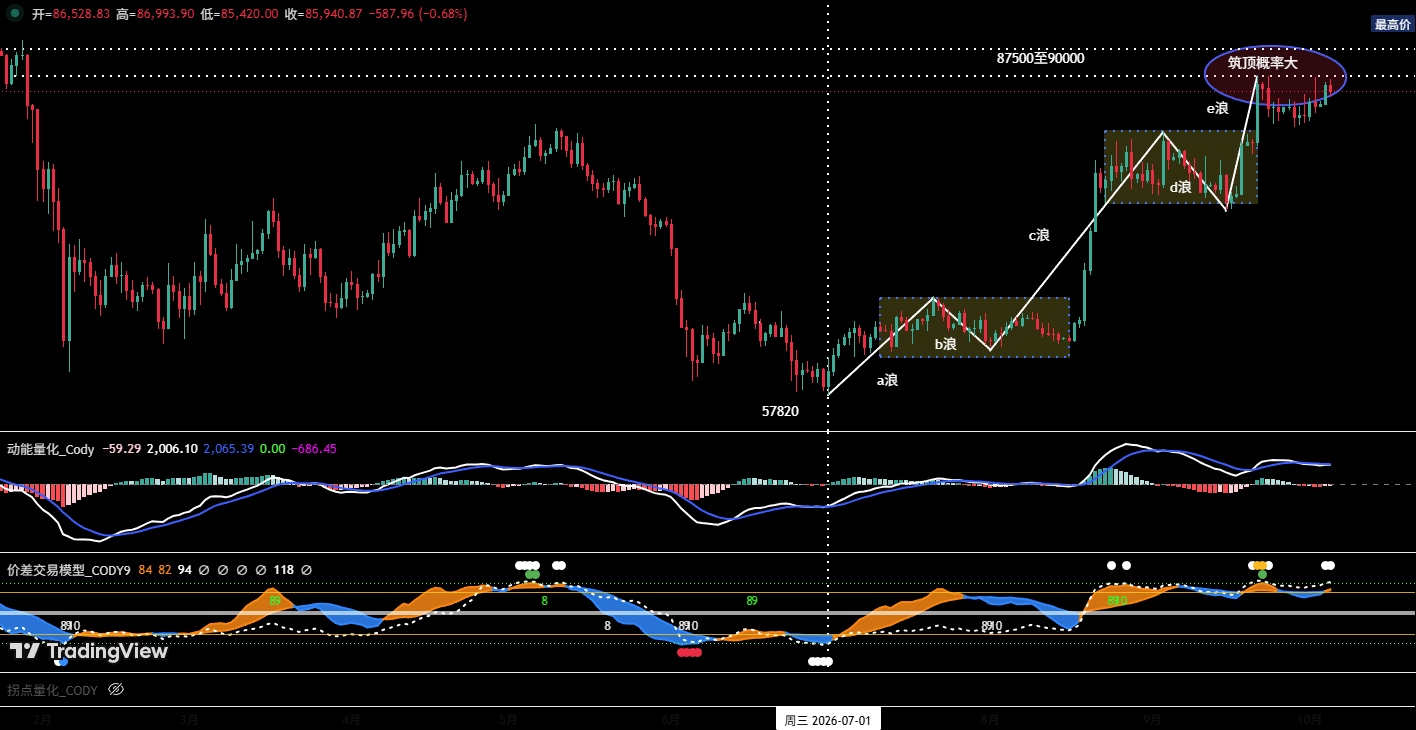
Figure 1: Bitcoin Daily Candlestick Chart
1. Five-Wave Structure Decomposition: Wave e Still in Progress (Figure 1)
①. Wave a to Wave d: July 1 to September 15
For detailed structural analysis, see the September 28 weekly review
②. Wave e (potential rebound wave): September 15 to present
• Starting point: $74,955
• Has run for 19 trading days (still in progress)
• Maximum gain within the range: 16.6%
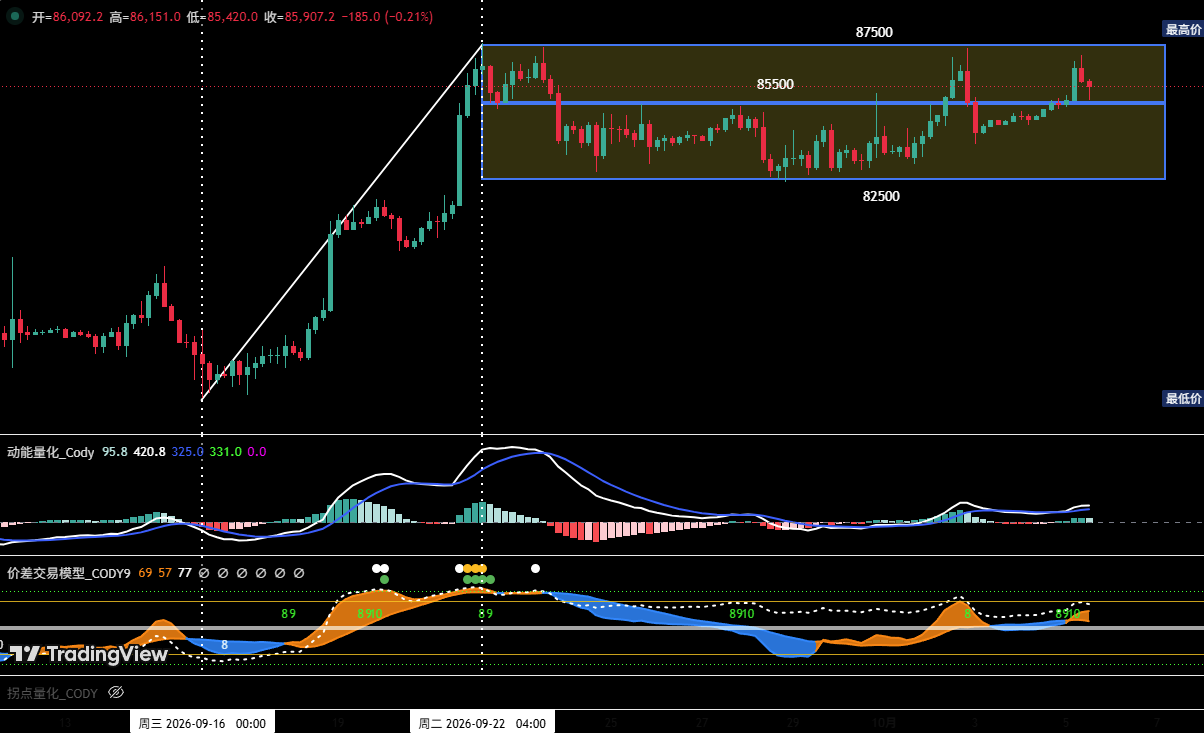
Figure 2: Bitcoin 4-Hour Candlestick Chart
2. Multi-Timeframe Analysis of Wave e
①. Daily level (Figure 1)
• After BTC hit a new high of $87,399 within wave e on September 21, the price has maintained strong oscillation within the $82,500–$87,500 range.
• The self-built "Momentum Quantitative Model" is currently showing a top-side blunting state (this signal is a necessary precondition for forming a top divergence);
• The self-built "Spread Trading Model" issued consecutive top warning signals around September 21, after which the price retraced approximately $5,000 (the signal temporarily disappeared). Currently, this model's indicator remains at a high level. If the price rises again, the top warning signal will be re-triggered at any time.
②. 4-hour level (Figure 2)
• Since the price hit a new rebound high of wave e on September 21, using $85,500 as the midline, we can divide the $82,500–$87,500 range into upper and lower boxes: the lower box at $82,500–$85,500, and the upper box at $85,500–$87,500. Since September 21, the price has mostly oscillated narrowly within the lower box.
• On October 2, the price briefly surged with increased volume, broke through the lower box constraint and launched an assault toward the upper edge of the range ($87,500). But it ultimately failed to hold and fell back into the lower box. That day recorded a bearish candle with a long upper shadow, accompanied by increased volume. This candlestick can be viewed as a "Immortal Pointing the Way" pattern.
• On October 4, the price once again broke through the upper rail of the lower box and attacked the upper edge of the range ($87,500), ultimately closing with a 2.09% bullish candle, successfully holding above the lower rail of the upper box ($85,500).
③. In summary, the probability of the price breaking through the September 21 high and refreshing the wave e rebound high in the first half of this week is extremely high. But at this point, we remind everyone that the "Spread Trading Model" will once again trigger a top warning signal and form a signal resonance with the "Momentum Quantitative Model"; the upward rebound space will be limited, and the wave e termination point may be established at any time. Therefore, do not chase the rally during this upward push, and be alert to the risk of high-level correction.
3. Conditions for Determining Wave e Termination
①. In the first half of the week, if the price惯性上攻 and refreshes the previous high (September 21 high), the market will most likely confirm the wave e rebound endpoint in the key resistance zone of $87,500–$90,000, and then immediately shift into a daily-level correction.
②. If the price surges and pulls back, fails to refresh the previous high (September 21 high), and again probes downward and effectively loses the $80,500–$82,500 support zone, then the September 21 high is the wave e termination point, meaning the oversold rebound that started from the previous low of $57,820 has most likely ended;
2. Bitcoin This Week's Market Forecast and Trading Strategy
1. BTC This Week's Market Trend Forecast
This week's core view: Focus on the offensive and defensive battle between bulls and bears near the upper and lower rails of the $82,500–$87,500 range; focus on determining the manner in which the wave e rebound terminates.
2. Core Resistance Levels
• First resistance zone: $87,500–$90,000 area (previous important level)
• Second resistance zone: near $93,000 (previous important resistance area)
3. Core Support Levels
• First support: $80,500–$82,500 area (previous important support)
• Second support: $73,500–$75,000 area (previous important support)
• Third support: $67,300–$69,100 area (previous important support)
4. This Week's Trading Strategy (Excluding Impact of Breaking News)
①. Medium-term strategy:
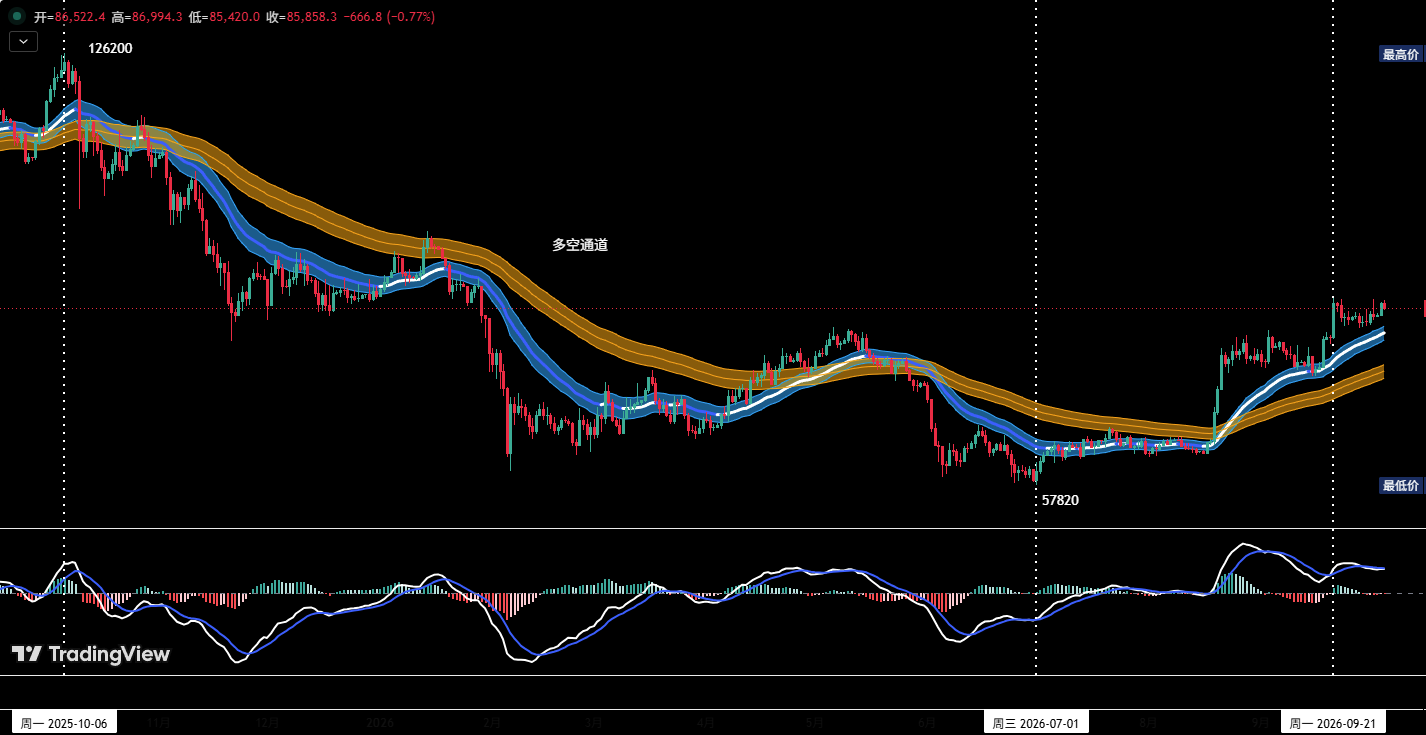
Figure 3: Bitcoin _ Daily Candlestick Chart: (Position Monitoring Model)
Position Monitoring Model: As shown in Figure 3, the price has broken through the "Long-Short Channel" but has not yet undergone the pullback confirmation phase. Therefore, the current medium-term strategy is mainly to stay in cash and observe.
②. Short-term strategy: Use 30% of position, set stop-loss points, and look for "spread" opportunities based on support and resistance levels. (Use 30-minute/60-minute as the operating cycle).
③. In short-term operations, to dynamically adapt to complex market evolution, we prepare A/B trading plans in advance.
• Plan A: Light short position in strong resistance zone.
• Entry: If the price rises to the $87,500–$90,000 area early this week, shows a clear pressure-and-pullback pattern, and the quantitative model simultaneously issues a top signal, a short position of approximately 30% can be established.
• Risk control: Set an initial stop-loss.
• Exit: When the correction reaches near an important support level and combines with model signals, positions can be closed in batches to take profit.
• Plan B: Short with the trend after effective breakdown.
• Entry: If the price probes downward and effectively loses the $80,500–$82,500 support zone, those without positions can establish a short position of approximately 30%.
• Risk control: Set an initial stop-loss.
• Exit: As the price further corrects to near an important support level and combines with model signals, positions can be closed in batches to take profit.
3. HYPE Daily-Level Trend Structure Analysis

Figure 4: HYPE Daily Candlestick Chart
1. Market Validation of Last Week's HYPE Assessment
As shown in Figure 4, in the previous weekly review we clearly pointed out: the trend at that time should be defined as the pullback confirmation phase after breaking the previous high of $89.69. If the $89.69 support line is effectively broken during this period, the price will most likely further probe toward the $85 area for support. Looking back at last week's market performance, the price hit a low of $84.92 before finding support and stabilizing, then launched a rebound. The actual market performance was highly consistent with the previous assessment, and the earlier view was effectively validated by the price action.
2. Current Trend Structure Analysis (Figure 4)
①. On the daily chart, since HYPE started this round of upward movement from the August 2 low of $51.11, the price structure has shown clear characteristics of an ascending channel. The lower rail of this channel is formed by connecting the two lows of August 12 and September 15; the upper rail is defined by connecting the two highs of August 22 and September 22.
②. From the daily-level observation, last week's correction low of $84.92 happened to fall near the lower rail of the channel, indicating that this lower rail support is effective, and the current price is oscillating upward relying on the lower rail support.
③. If the price effectively breaks through the upper rail of the channel, it will further open up upside space; if it effectively loses the lower rail of the channel, the daily-level correction cycle will be accordingly extended, but the long-term upward trend structure has not yet been damaged.
4. HYPE This Week's Market Forecast and Short-Term Trading Strategy
1. HYPE This Week's Market Trend Forecast
①. Core Resistance Levels:
• First resistance: $92–$94 area
• Second resistance: near $102
• Third resistance: near $110
②. Core Support Levels:
• First support: $84–$85 area;
• Second support: $76–$77 area;
③. This Week's Core View:
The current price is running within the channel. Focus on observing the outcome of the battle between bulls and bears near the upper and lower rails of the channel.
2. HYPE This Week's Short-Term Trading Strategy
①. Hold long positions at support levels and wait for gains.
If you have already established long positions near the $85 support level according to the previous trading plan, you can hold and wait for gains, and set a stop-loss, strictly execute.
②. On effective breakout of resistance, try a light long position.
If the price effectively breaks through and holds above the $92–$94 resistance area, those without positions may consider trying a light long position. Position size should be controlled within 30%, and a stop-loss should be set and strictly executed.
5. Special Notes
1. When opening a position: Immediately set an initial stop-loss.
2. When profit reaches 1%: Move the stop-loss to the entry cost price (break-even point) to ensure capital safety.
3. When profit reaches 2%: Move the stop-loss to the 1% profit level.
4. Continuous tracking: Thereafter, for every additional 1% profit in the price, move the stop-loss by 1% accordingly, dynamically protecting and locking in gains.
Financial markets change rapidly, and all market analysis and trading strategies require dynamic adjustment. All views, analytical models, and trading strategies involved in this article originate from personal technical analysis and are solely for personal trading log purposes. They do not constitute any investment advice or operational basis. Markets carry risks, and investment requires caution. Please do not make decisions based on this.