






调整尾声还是趋势延续:BTC、HYPE技术结构复盘 | 特邀分析


- 核心观点:本周周报通过多周期技术结构分析,认为比特币日线超跌反弹后进入区间震荡的概率较高,需重点关注反弹高点;HYPE 则因上涨结构完整且逼近历史高位,建议以锁定利润、防范短线调整风险为主。
- 关键要素:
- 比特币日线自5月6日高点82,850美元已形成四段式调整结构,当前处于第4段反弹,能否突破65,700美元决定短期方向。
- 量化模型显示,比特币进入区间震荡的概率显著;若反弹触及65,700美元,后续直接跌破57,820美元支撑的概率降低。
- 4小时级别上,比特币调整末端已形成动能底背离,反弹已突破62,300美元中枢下轨,若进一步突破65,700美元则反弹力度升级。
- HYPE自6月25日低点58.5美元启动的4小时级别反弹已演变为七段式上涨结构,当前运行第7段,整体结构完整。
- HYPE的“价差交易模型”已触发顶部预警信号,价格逼近历史高位76.94美元,建议勿盲目追涨,本周以平仓止损保护利润为主。
This week's report focuses on a multi-timeframe technical structure analysis of BTC and HYPE. For Bitcoin, starting from the daily and 4-hour timeframes, we delineate the corrective structure since the May 6th high. Combined with a proprietary quantitative model, we provide forecasts for key resistance levels, support levels, and short-to-medium-term operational paths for this week. For HYPE, we focus on the 4-hour level trend, analyzing the structural evolution of the current rebound and offering corresponding risk management suggestions for short-term operations this week. The details are as follows.
Review of Last Week's Strategy Validation
- BTC Forecast Validation: Last week's article clearly stated that the short-term adjustment of Bitcoin was nearing its end. The actual market path was largely consistent with the predicted trend, validating the forward-looking analysis.
- HYPE Forecast Validation: Last week's article pointed out that HYPE was about to present a short-term long entry opportunity. As things stand, the market movement has confirmed this judgment.
I. Analysis of Bitcoin's Multi-Timeframe Trend Structure
1. Daily Timeframe Trend Structure Analysis
Bitcoin Daily K-line Chart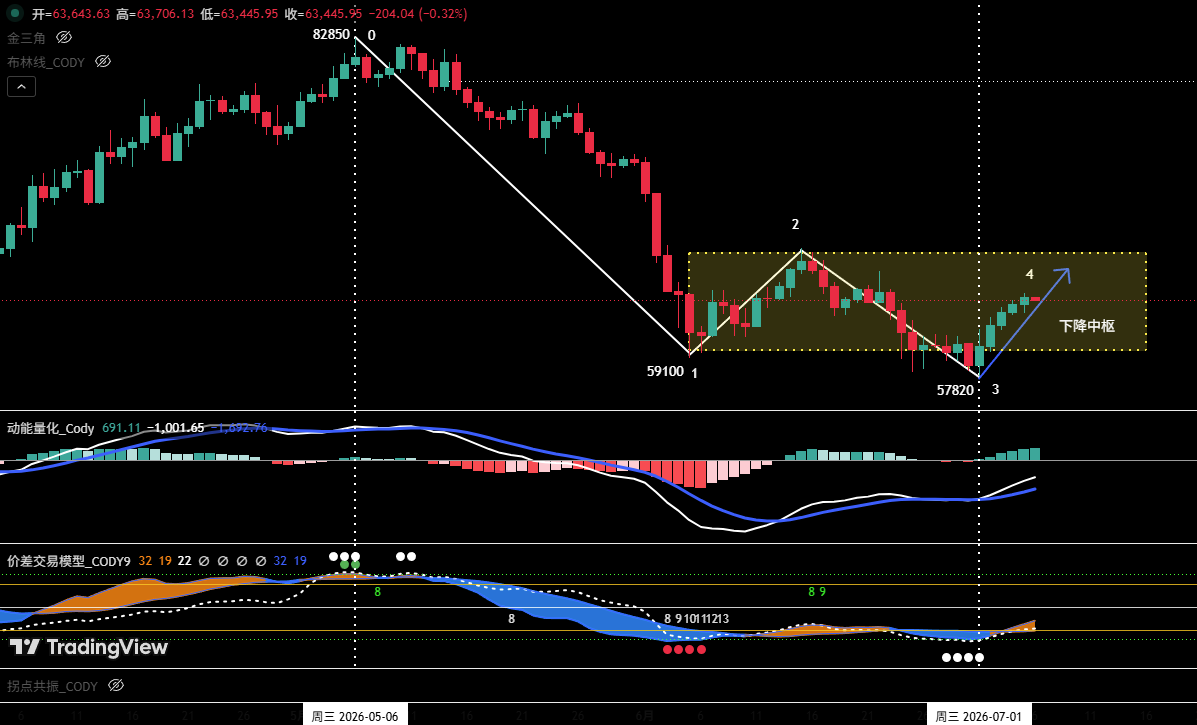
Figure 1
① As shown in Figure 1: Since the adjustment began from the May 6th high of $82,850, the daily chart has exhibited a clear four-wave corrective structure from "Endpoint 0" to "Endpoint 4".
② The market is currently undergoing the (3-4) rebound segment. The final position of "Endpoint 4" will determine the short-term price direction.
- Scenario One: If the rebound price at "Endpoint 4" can break through the resistance level of $65,700, the probability of the price directly breaking below the July 1st low of $57,820 upon subsequent resistance will decrease significantly. In this scenario, the market may rebound again after the adjustment ends, with the near-term trend leaning towards a range-bound structure. The longer this consolidation structure persists, the more it helps to slow down bearish momentum and accumulate power for a subsequent bullish counterattack.
- Scenario Two: If the rebound price at "Endpoint 4" fails to reach $65,700, or even stays below $64,500, the probability of the price directly breaking below $57,820 upon subsequent resistance increases substantially, suggesting a higher likelihood of the market continuing its downtrend.
③ According to our proprietary quantitative model analysis, the probability of the market entering a range-bound consolidation (Scenario One) is significant.
2. In-depth Analysis of Hourly Timeframe Trends (Using 4-Hour Chart)
Bitcoin 4-Hour K-line Chart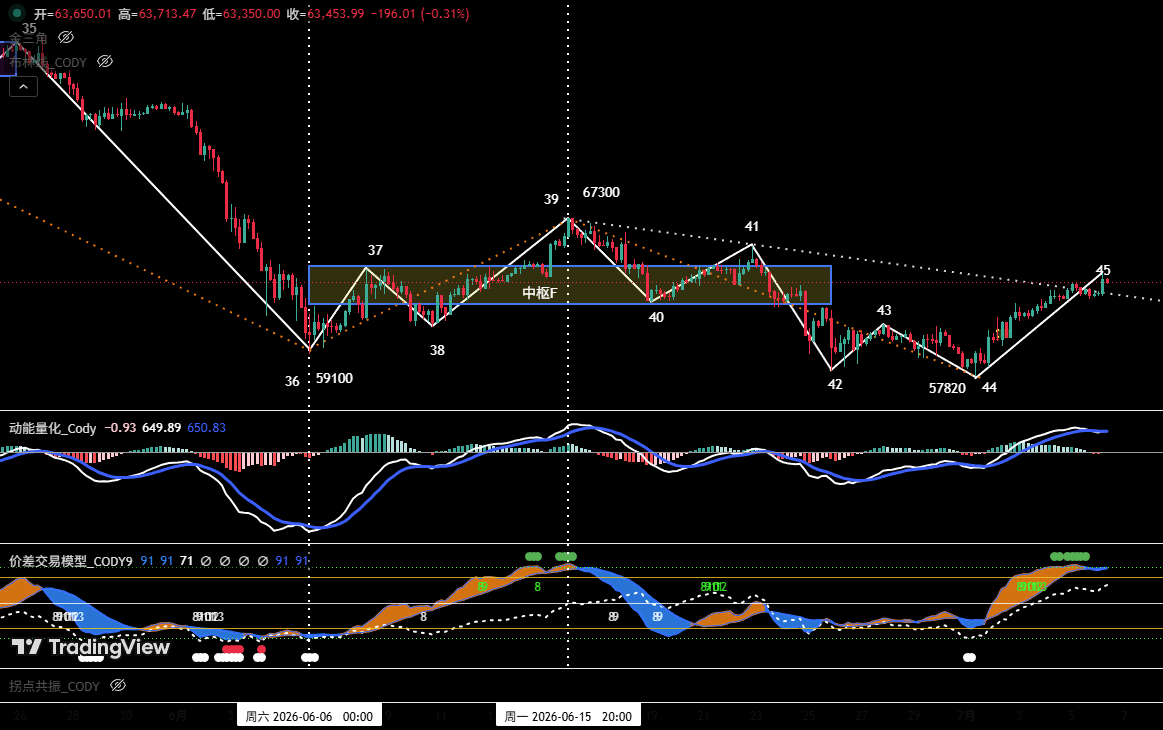
Figure 2
① Last week's review noted: "If the end of Endpoint 44 is below $58,110 and forms a bullish divergence in momentum, the market is poised for a rebound opportunity." The market trend last week validated this judgment, with the actual movement closely matching the predicted structure.
② On the 4-hour chart, the hourly-level decline wave starting from the June 15th high of $67,300 has completed a full five-wave structure; simultaneously, at the end of the adjustment, comparing "Endpoint 44" and "Endpoint 42", a clear bullish momentum divergence pattern has formed, providing technical support for the subsequent oversold bounce.
③ The market is currently in the (44-45) rebound segment. As seen in Figure 2, the current rebound high "Endpoint 45" has broken above the lower boundary of the previous "declining trend center F" (approx. $62,300), signaling a short-term trend developing favorably for bulls. If the market can further surpass "Endpoint 41" (approx. $65,700) in the future, it would indicate an upgrade in rebound strength, significantly reducing the probability of directly breaking below "Endpoint 44" (approx. $57,820) when the rebound meets resistance later.
II. Bitcoin's Market Forecast and Operational Strategy for This Week (07.06~07.12)
1. BTC Trend Forecast for This Week
Core View: Focus on the high of the daily oversold rebound originating from the low of $57,820.
2. Key Resistance Levels:
• First Resistance Zone: $64,500~$65,700 area (previous significant high/low area)
• Second Resistance Zone: Near $67,300 (previous significant resistance area)
• Third Resistance Zone: $69,500~$71,000 area (previous significant resistance area)
3. Key Support Levels:
• First Support Level: $60,950~$62,300 area (previous significant support area)
• Second Support Level: Near $57,820 (previous significant support level)
• Third Support Level: Near $55,000 (previous significant support level)
4. Operational Strategy for This Week
① Medium-Term Strategy:
Bitcoin Daily K-line Chart (Position Monitoring Model)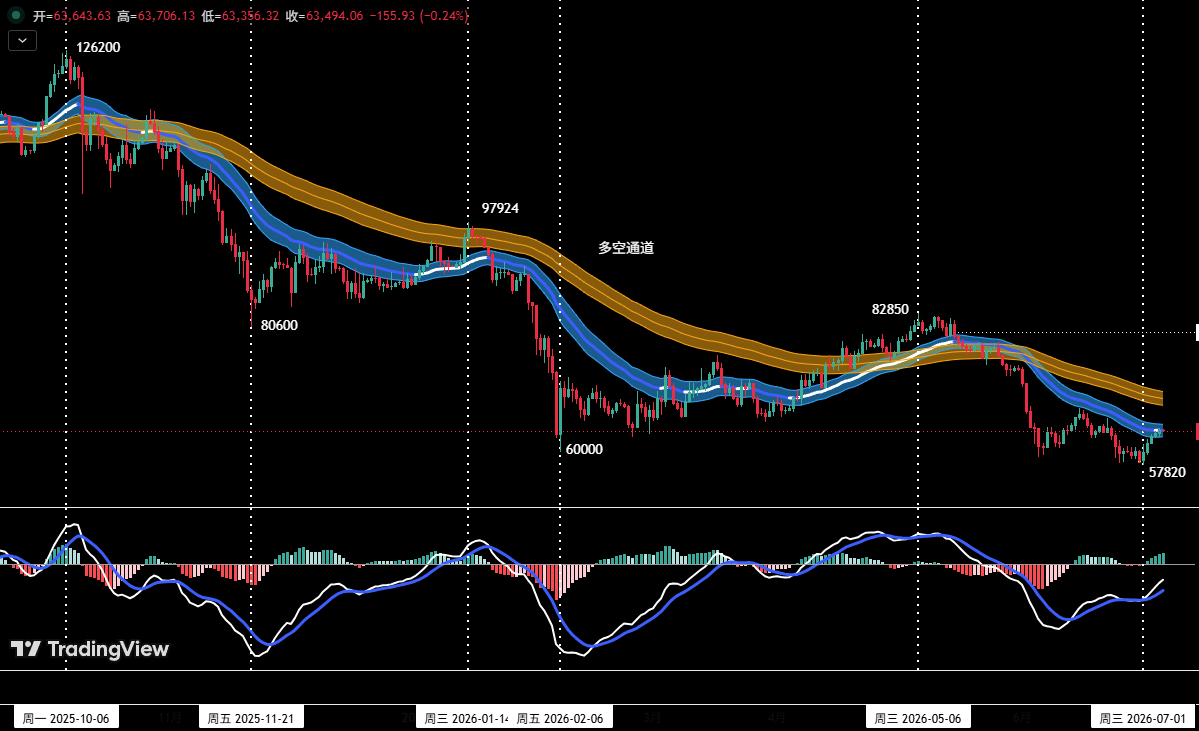
Figure 3
As shown in Figure 3, the current price has effectively broken below the "Long/Short Channel," confirming the market structure has shifted to a bearish-dominant regime.
- Maintain current medium-term short positions at around 20%.
- If the price rebounds to the $65,700~$67,300 area and shows signs of stalling, coupled with top signals from our proprietary quantitative model, consider increasing medium-term short positions to within 50%.
② Short-Term Strategy
Utilize 30% of capital, set stop-loss points, and seek "spread" opportunities based on support and resistance levels (using 30-minute/60-minute charts as operational timeframe).
③ Short-Term Operational Plans
To dynamically respond to complex market evolutions, two specific operational plans, A and B, are formulated in advance:
- Plan A: Tentative Shorting at Strong Resistance Zone
- Entry: If the price rebounds to the $65,700~$67,300 area and meets resistance, combined with top signals from the quantitative model, establish a short position of around 30%.
- Risk Control: Set initial stop-loss.
- Exit: When the price adjusts near key support levels, combined with signals from the quantitative model, gradually close the position for profit.
- Plan B: Light Long Position at Strong Support Zone
- Entry: If the price breaks through the $65,700 area but then falls back, showing signs of stabilization near the strong support of $57,820, combined with bottom signals from the quantitative model, establish a long position of around 15%.
- Risk Control: Set initial stop-loss.
- Exit: When the price rebounds near key resistance levels, combined with signals from the quantitative model, gradually close the position for profit.
III. Analysis of HYPE Hourly Timeframe Trend Structure
HYPE 4-Hour K-line Chart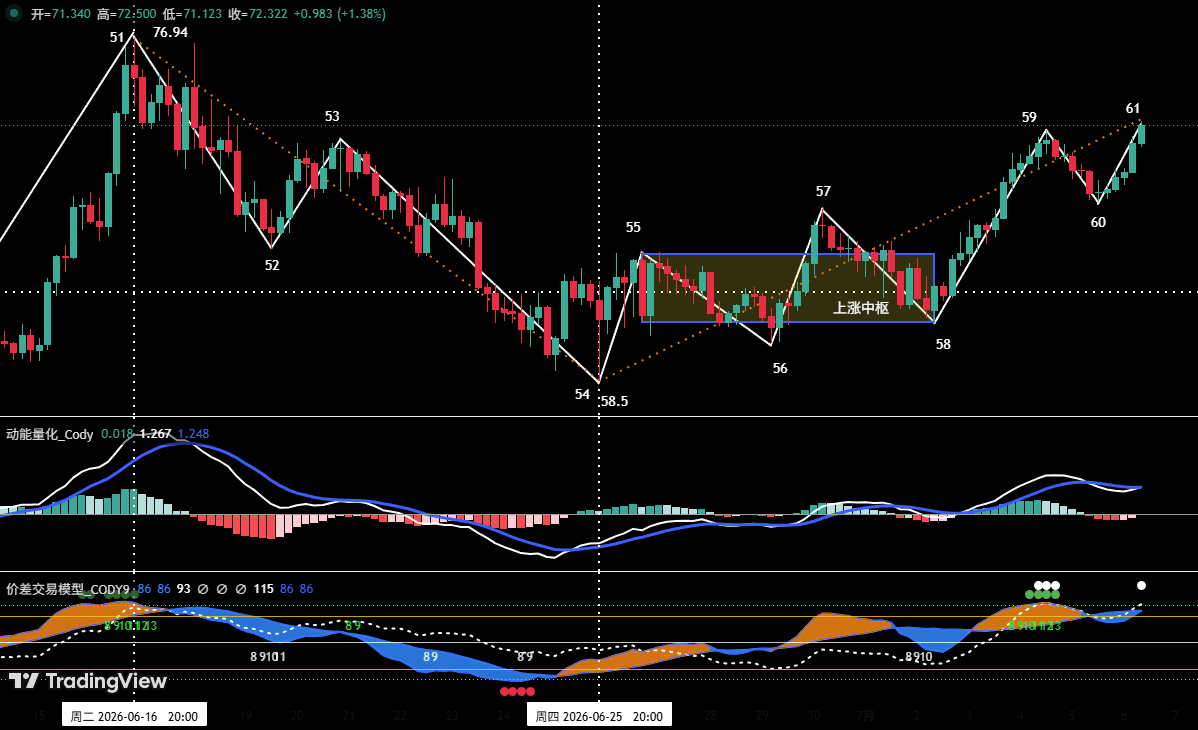
Figure 4
- As shown in Figure 4, last week's review noted: "If ‘Endpoint 56’ is higher than ‘Endpoint 54’, it forms a ‘double bottom’ pattern, potentially ending the current adjustment and making a rebound from ‘Endpoint 56’ highly probable." To date, the market trajectory is highly consistent with this analysis. In the actual movement last week, HYPE price rose from "Endpoint 56" (approx. $60.55) to "Endpoint 59" (approx. $72.06), achieving a maximum gain of approximately 19.01% during the period.
- Analyzing the 4-hour chart, the rebound of HYPE starting from the low of $58.5 (Endpoint 54) on June 25th can be subdivided into a seven-wave upward structure on the 4-hour timeframe: 54-55, 55-56, 56-57, 57-58, 58-59, 59-60, 60-61.
- The price is currently in the 60-61 upward segment, with the overall upward structure intact. However, our proprietary "Spread Trading Model" has triggered top warning signals at both "Endpoint 59" and "Endpoint 61". Furthermore, the price is approaching the historical high zone near $76.94. Therefore, blindly chasing the rally at this point is inadvisable, and one should be wary of short-term correction risks.
IV. HYPE's Market Forecast and Short-Term Operational Strategy for This Week
1. HYPE Trend Forecast for This Week
Key Resistance Levels
- First Resistance: Near $75~$76.94
- Second Resistance: Near $80
Key Support Levels
- First Support: Near $68
- Second Support: Near $65.5
- Third Support: $60.5~$61.5 area
Core View for This Week: Observe the outcome of the tug-of-war between bulls and bears when the price reaches the $75~$76.94 area.
2. HYPE Short-Term Operational Strategy for This Week
This week's focus is on closing positions to lock in profits and manage risk. If long positions were opened near support zones according to the plan, it is recommended to move the stop-loss up to around $68 to protect profits (or decide for yourself). If the market shows signs of correction, close positions promptly to take profits.
V. HYPE Short-Term Trade Review
Strictly adhering to our operational plan, we executed one short-term (long) trade last week based on trading signals from our proprietary "Spread Trading Model" and "Momentum Quantitative Model," achieving a total trading profit of approximately 10.23%.
Short-Term Trade 1: (See Table 1)
①, HYPE Short-Term Trade Details Summary: (Leverage *1x)
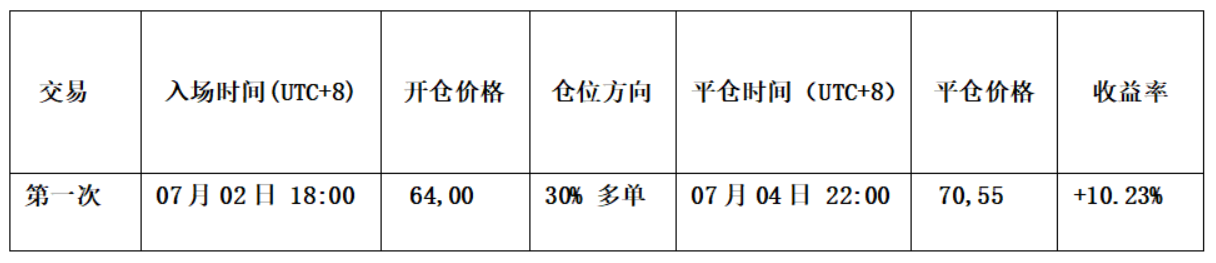
Table 1
②, Short-Term Trade Review: (See Figure 5)
• Entry Strategy:
a、Based on an accurate assessment of the overall upward price trend.
b、When the price effectively broke above the short-term downtrend line, and the "Spread Trading Model" and "Momentum Quantitative Model" simultaneously issued a bottom divergence confirmation signal.
Therefore, we established a 30% long position at $64.
• Exit Strategy:
a、When the price rose near the $72 resistance level and showed signs of stalling, forming a "top divergence" pattern on the K-line.
b、The "Spread Trading Model" triggered a strong top warning signal (green dot + white dot), confirming with the "Momentum Quantitative Model" for a top divergence signal.
Therefore, we fully closed the position around $70.55.
• Summary: This trade successfully yielded a profit of approximately 10.23%.
HYPE_60-minute K-line Chart: (Momentum Quantitative Model + Spread Trading Model)
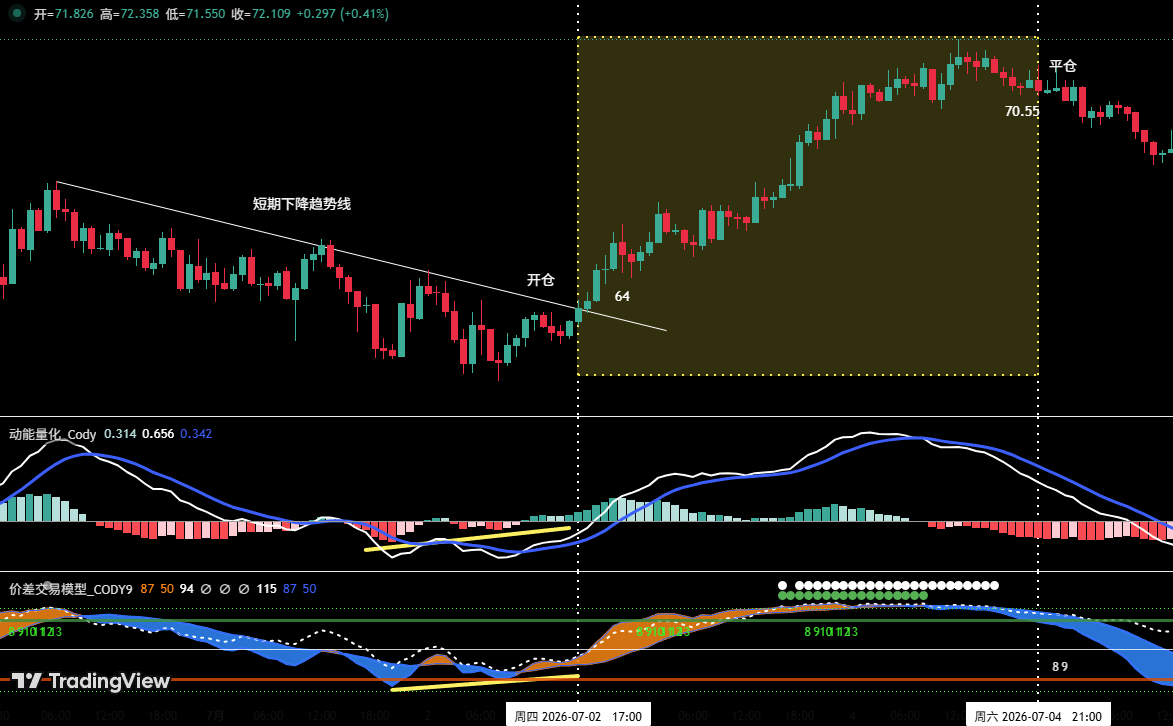
Figure 5 (Short-Term Trade Illustration)
VI. Special Notes
- Upon entry: Immediately set the initial stop-loss.
- When profit reaches 1%: Move the stop-loss to the entry cost price (break-even point) to ensure capital safety.
- When profit reaches 2%: Move the stop-loss to the 1% profit level.
- Continuous tracking: Subsequently, for every additional 1% profit gained, move the stop-loss up by 1% accordingly, dynamically protecting and locking in profits.
Financial markets are volatile and subject to rapid change. All market analysis and trading strategies require dynamic adjustments. All views, analytical models, and operational strategies mentioned in this article are derived from personal technical analysis and serve solely as a personal trading log. They do not constitute any form of investment advice or operational basis. The market involves risk, and investment requires caution. Please do not base decisions solely on this content.





