
比特币冲击8万美元关键关口,HYPE转势信号悄然浮现 | 特邀分析
- Core View: Bitcoin is currently at a key resistance zone of $80,000-$81,000, a crucial watershed deciding the market's direction. A decisive breakout could signal a trend reversal; otherwise, it faces a deep correction. Meanwhile, HYPE exhibits a bearish structure, awaiting a breakout confirmation.
- Key Elements:
- The daily-level key resistance band for Bitcoin is $79,500-$80,600. A decisive break and consolidation above this level could mark the end of the correction since the October 2025 high, initiating the impulsive Wave I.
- If Bitcoin experiences a fakeout or a "one-day wonder" pullback in this zone, the rebound would be characterized as a Wave D correction within a downtrend continuation pattern, potentially leading to a break below the previous low of $60,000.
- The hourly chart structure indicates that the rebound from the March 30 low of $65,000 has formed an upward consolidation center, suggesting a high probability of an assault on the $80,600 level.
- HYPE's price action exhibits a potential reversal structure characterized by "breaking below the previous low during the correction, yet failing to make a higher high on the rebound." This suggests its daily uptrend may have concluded at $45.76.
- This week's trading strategy suggests remaining on the sidelines at the mid-term timeframe. For short-term traders, range-bound trading based on support and resistance levels is possible. The priority is to wait for a clear Bitcoin breakout outcome before establishing positions.
- If HYPE fails to break above its previous high of $45.76, the bearish structure is confirmed; otherwise, it may follow Bitcoin's strength.
Bitcoin is standing at what I believe is the most critical price level in recent months. The $80,000 to $81,000 range is not just ordinary technical resistance; it represents the "ceiling" of this prolonged consolidation and the true fork in the road for the market's direction.
If you've been watching and waiting during this period, I believe this patience is correct. This week is still not the time to chase longs. Whether the price can genuinely hold above this platform requires time to verify, and the risk of a "one-day-wonder" fakeout remains high. Before the structure is confirmed, the cost of rushing in often outweighs the regret of missing out.
But I also don't want to avoid another possibility: If Bitcoin does effectively break through and hold this time, the months of consolidation might be coming to an end. At that point, we will actively deploy long positions and follow the trend.
Key Trading Views Summary for This Week:
- BTC Multi-timeframe Structure Analysis (detailed in Part 1)
- BTC Weekly Price Forecast & Medium/Short-term Strategy (detailed in Part 2)
- In-depth HYPE Hourly Structure Analysis (detailed in Part 3)
- HYPE Weekly Price Forecast & Short-term Strategy (detailed in Part 4)
- Previous Week Trade Review: HYPE Short Long Profit ~5.77% (detailed in Part 5)
So, the core of this week revolves around one question — Can Bitcoin truly break through $80,000 to $81,000? Let's deconstruct it layer by layer, from the daily chart down to the hourly level.
1. Bitcoin Multi-timeframe Structure Analysis
1.1 BTC Daily Level Structure Analysis: (Based on the move following the low on February 6, 2026)
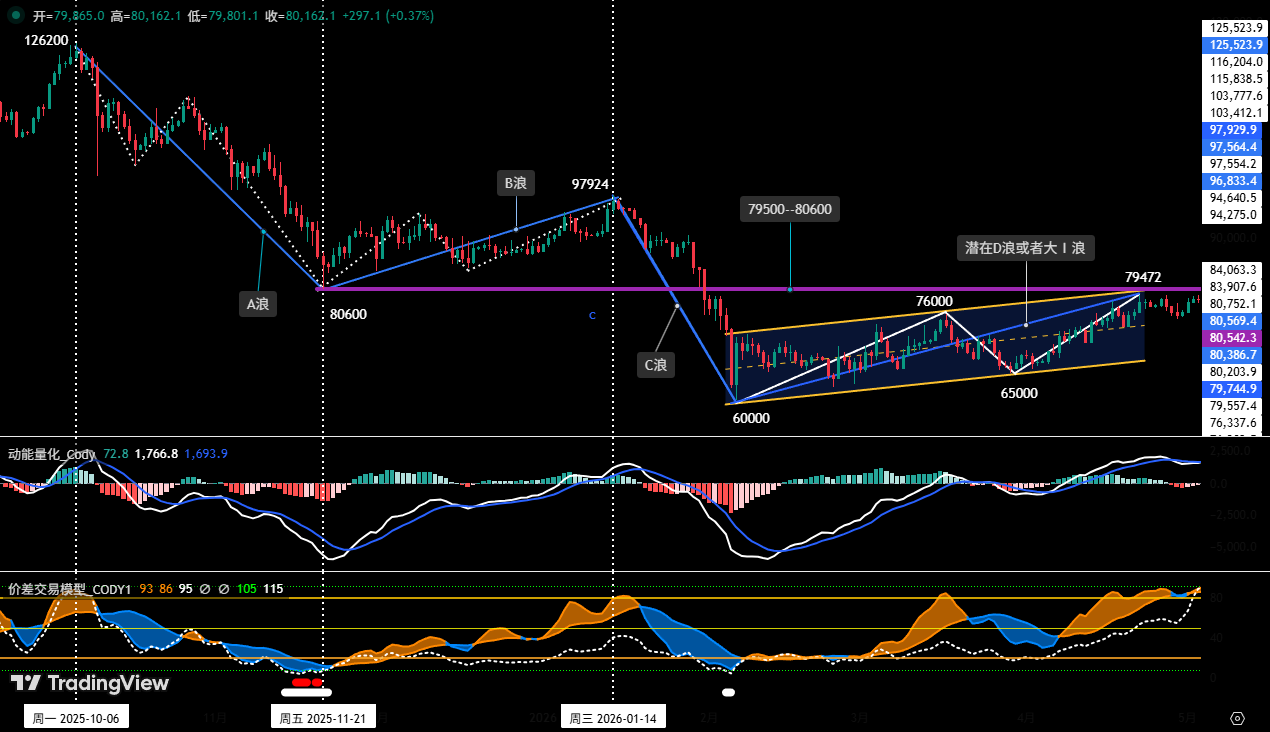
Figure 1
As shown in (Figure 1), Bitcoin is currently at the critical price zone of $79,500 to $80,600 (marked in purple). This area has become the market's core "watershed." The validity of this resistance will directly determine the nature and subsequent direction of the rebound that started from the low of $60,000 on February 6th.
Here are the two core path analyses:
Path 1: Effective upward breakout and hold, increasing probability of trend reversal
- Trigger Condition: The price effectively breaks through and stably trades above this zone, with the upward momentum (in both price and time) continuing to expand.
- Technical Judgement: This could mean the daily-level correction that began at the October 2025 high ($126,200) ended at the February 6th low (~$60,000), and the market trend may have fundamentally reversed.
- Outlook: This rebound could be seen as the beginning of a potential Major Wave I (impulsive wave). A subsequent Major Wave II (corrective wave) retracement is likely, but the probability of the correction completing above $60,000 is high.
Path 2: Failed breakout, increasing risk of a continuation pattern
- Trigger Condition: The price meets resistance in this zone, manifesting as a "one-day-wonder" or "fakeout" before quickly pulling back.
- Technical Judgement: The nature of this rebound is more likely a Wave D rally within a potential downtrend, rather than a trend reversal.
- Outlook: After the rebound ends, Wave E correction will follow, with a higher probability of breaking below the previous low of $60,000.
Summary: In short, this price zone is a litmus test for market sentiment. Holding above it opens up bullish potential, while failure suggests a deeper retracement. The outcome of the battle between bulls and bears in this zone will guide the core direction for the next phase and is a key reference for assessing potential structural shifts in the market.
1.2 In-depth Analysis of BTC Hourly Level Structure: (Using the 4-hour chart as the analysis timeframe)
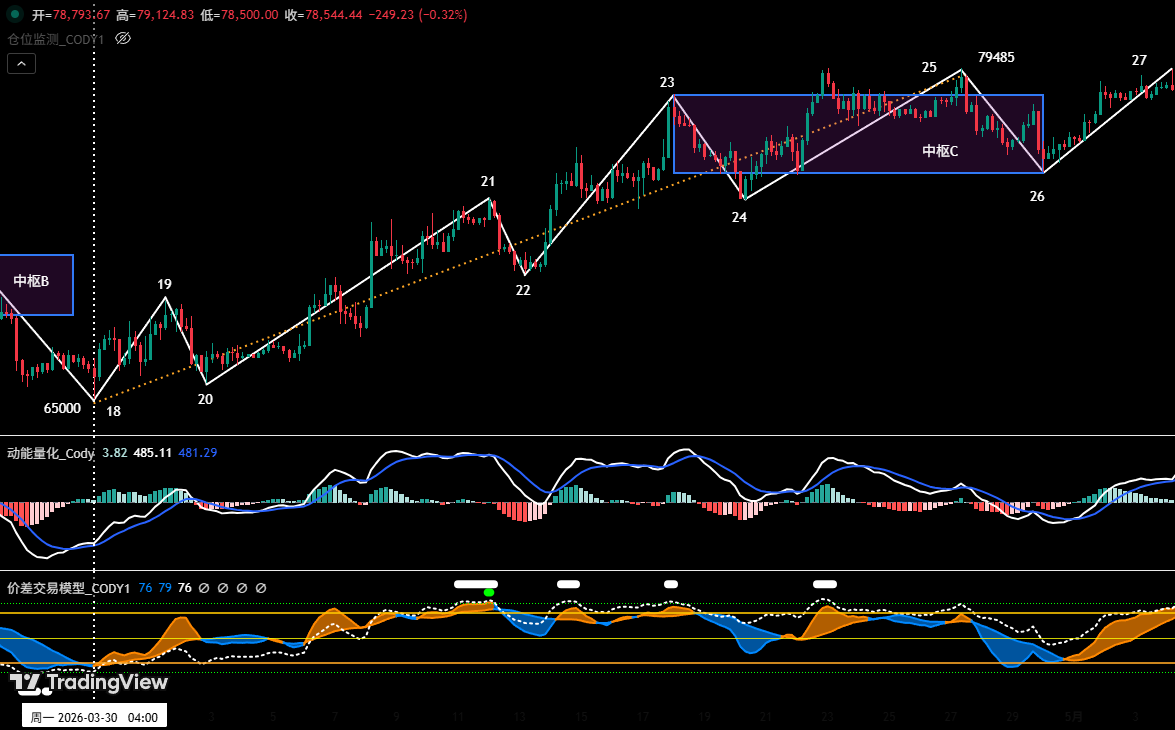
Figure 2
As shown in (Figure 2), the daily-level rebound starting from the low of $65,000 on March 30th can be broken down into nine segments on the 4-hour chart: 18-19, 19-20, 20-21, 21-22, 22-23, 23-24, 24-25, 25-26, and 26-27. Among these, segments 23-24, 24-25, and 25-26 overlap, forming "Consolidation Zone C." The market is currently running the departure segment (26-27).
Since Consolidation Zone C is a bullish consolidation zone, it is highly probable that the endpoint 27 of the departure segment will break through the previous high of $79,485 and test $80,600.
2. Bitcoin Weekly Price Forecast & Trading Strategy
2.1 BTC Weekly Price Forecast:
Core View for the Week: We expect the price to test the resistance effect around $80,600 this week, focusing on whether it can effectively break through the key resistance zone of $79,500 ~ $80,600. Although easing geopolitical tensions provide short-term upward momentum, under macro pressures and structural market contradictions, the market is more likely to show a wide-range consolidation pattern.
2.2 Key Resistance Levels:
- First Resistance Zone: $79,500 ~ $81,000 region (near the November 2025 low)
- Second Resistance Zone: $83,500 ~ $84,500 region (previous high-volume consolidation area)
2.3 Key Support Levels:
- First Support Level: Around $78,500 (near the upper boundary of the consolidation zone)
- Second Support Zone: $73,500 ~ $75,000 region (previous important support)
- Third Support Zone: $69,500 ~ $70,500 region (previous important support)
2.4 This Week's Trading Strategy (excluding sudden news events)
① Medium-term Strategy:
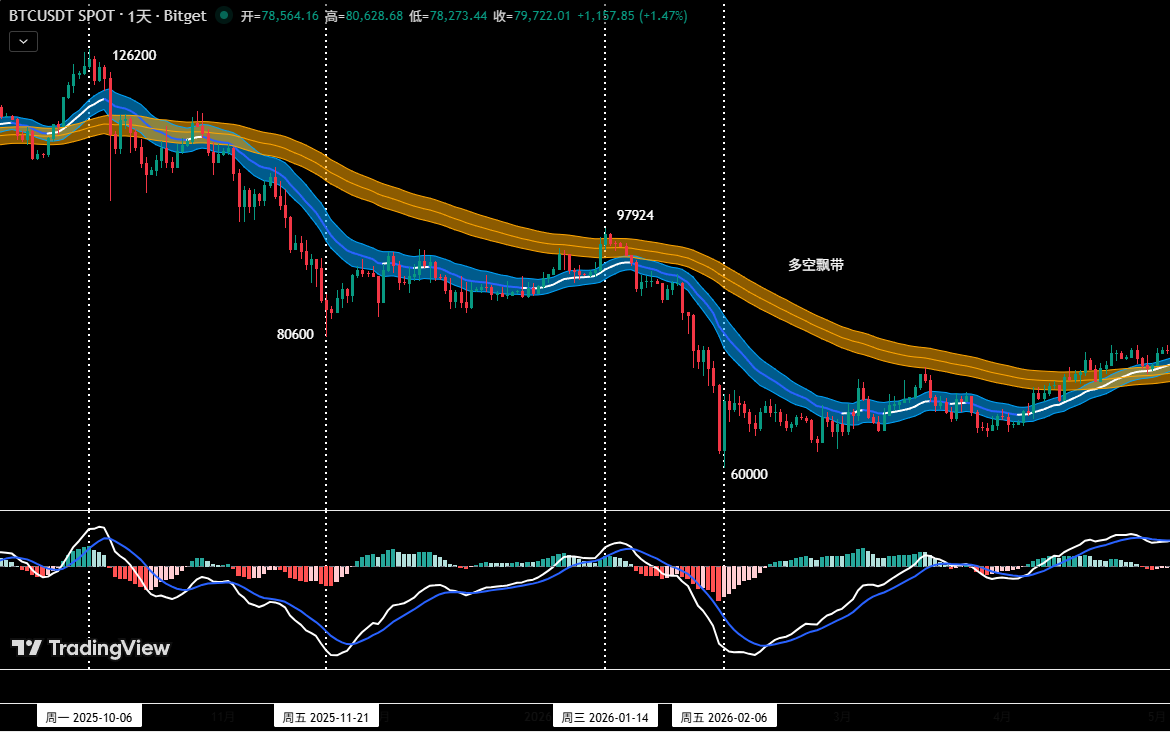
Figure 3
Position Monitoring Model: As shown in (Figure 3), based on trading rules, while Bitcoin has broken the upper band but its validity is not yet confirmed, our medium-term strategy remains to stay on the sidelines with zero position this week. We recommend waiting for a clear breakout confirmation before deploying positions. Avoid chasing highs or selling into lows.
② Short-term Strategy: Use 30% of capital, set stop-losses, and look for "spread" trading opportunities based on support and resistance levels (using the 30-min/60-min chart as the operating timeframe).
③ A/B Action Plan: Currently, Bitcoin is about to challenge the core $79,500 ~ $80,600 zone, and intraday volatility will increase. For short-term operations, to dynamically adapt to the complex market evolution, prudent investors should abandon subjective judgment. Instead, base decisions on objective structural analysis and quantitative model signals, and prepare and strictly execute A/B specific action plans beforehand.
Plan A: Effective Breakout and Hold, Follow the Trend with Longs on Dips.
- Entry: When the price effectively breaks and holds the $79,500 ~ $80,600 zone, combined with a bottom signal from the quantitative model, establish a 30% long position.
- Risk Management: Initial stop-loss set below $78,500.
- Exit: When the price rallies to key resistance levels, combined with model signals, gradually close positions to take profit.
Plan B: Effective Breakdown of Support, Short on Rallies.
- Entry: When the price effectively breaks below the support around $75,000, combined with a top signal from the quantitative model, establish a 30% short position.
- Risk Management: Initial stop-loss set above $76,500.
- Exit: When the price declines to key support levels, combined with model signals, gradually close positions to take profit.
Now, let's talk about HYPE.
In my view, the current structure shows relatively classic reversal signals — upward momentum is clearly weakening, and the bounce momentum is also narrowing. Of course, the trend is not yet set in stone. If the price can effectively break through the previous high of $45.76, then the uptrend is not over, and it will likely follow Bitcoin's strength. After all, if BTC successfully holds that platform, overall market sentiment will be lifted, and HYPE is unlikely to be left behind.
But before the breakout is confirmed, my advice is: For those already holding positions, set your take-profit levels well to protect existing profits. For those without positions, continue to wait and observe. There's no need to rush to chase. Let the structure speak, and we'll decide then.
3. In-depth Analysis of HYPE Structure
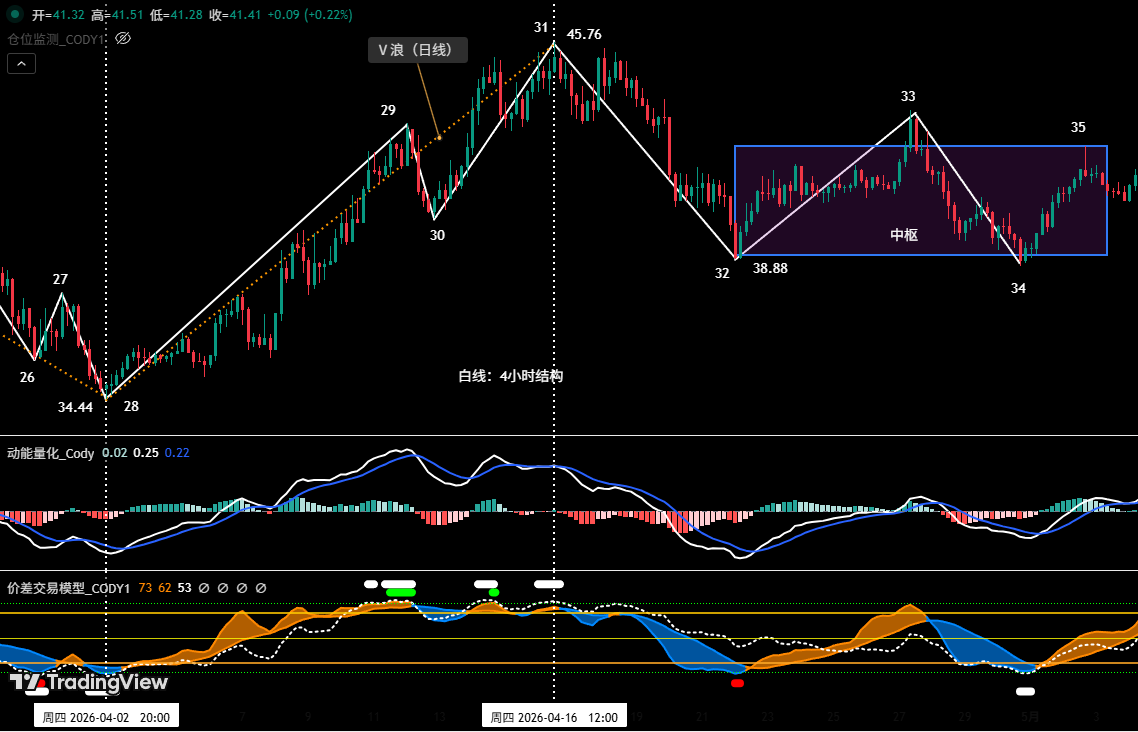
Figure 4
3.1 As shown in (Figure 1), the correction starting from the high of $45.76 on April 16th can be broken down into four segments on the 4-hour chart: 31-32, 32-33, 33-34, and 34-35. Among these, segments 32-33, 33-34, and 34-35 overlap, forming a "bearish consolidation zone." The market is currently running the 34-35 segment.
3.2 The 4-hour chart shows that HYPE's current trend displays a classic reversal signal. Specifically, during the corrective segment (endpoint 32), the price broke below the previous low (endpoint 30, $40.17). Subsequently, the bounce segment (endpoint 33) failed to make a new high (i.e., break through endpoint 31, $45.76). This constitutes a potential reversal structure characterized by "a correction breaking the previous low, followed by a bounce that fails to make a new high." Therefore, technical analysis suggests that the daily uptrend starting from the low of $34.44 on April 2nd likely ended at the high of $45.76, and the market is currently in a daily-level correction phase. If the price effectively breaks below the key support level around $38, it would provide further confirmation of this conclusion. This bearish structure would only be invalidated, and a trend reversal possible, if the price can effectively break and hold above the previous high of $45.76 in subsequent price action.
4. HYPE Weekly Price Forecast & Short-term Trading Strategy
4.1 HYPE Weekly Price Forecast:
Core View for HYPE This Week: Focus on whether the ongoing 34-35 segment can effectively break through the previous high of $45.76.
4.2 HYPE Short-term Trading Strategy for This Week:
- Based on the assessment that HYPE's overall trend is shifting to "correction or consolidation," short-term operations should follow the principle of "following the trend, shorting on rallies."
- Use signals from our proprietary quantitative model, operating on the 30-min/60-min timeframe, utilizing 30% of capital to capture entry opportunities.
- Entry Strategy: This week, if the 34-35 segment bounce shows signs of failure (endpoint 35 price must be below $45.76), simultaneous with top signals triggered by our two models, consider entering a short position. Position size must be strictly controlled below 30%, and stop-loss discipline must be adhered to.
5. HYPE Trade Review (04.27 ~ 05.03)
Market Validation of Last Week's Strategy & Core Views:
- HYPE Short-term Trade Result: HYPE completed one short-term long trade last week (1x leverage), achieving a return of approximately 5.77%. (See Table 1 for details)
- Market Validation of BTC Price Forecast: In last week's article, we pointed out that the price faced dual resistance from the upper daily channel line and the core $79,500 to $80,600 zone, making a direct breakout difficult. The current market movement has validated our previous forecast.
5.1 Short-term Trade Review: (See Table 1)
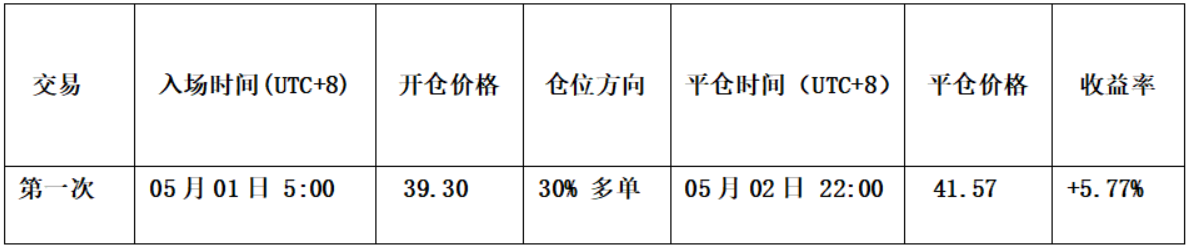
Table 1
5.2 Short-term Trade Analysis: (See Figure 5)
- Entry Strategy: First, the preceding price action had completed a full corrective structure. Second, the spread trading model had emitted a strong early bottom warning signal (red and white dots in the chart). Third, the momentum quantitative model triggered a bullish divergence signal. Therefore, we established a 30% long position at $39.30.
- Exit Strategy: When the price rose to around $42.5, it showed signs of failure. Concurrently, the spread trading model triggered a top warning signal (green and white dots in the chart). Therefore, we closed the entire position near $41.57.
- Summary: This trade successfully yielded approximately 5.77% profit.
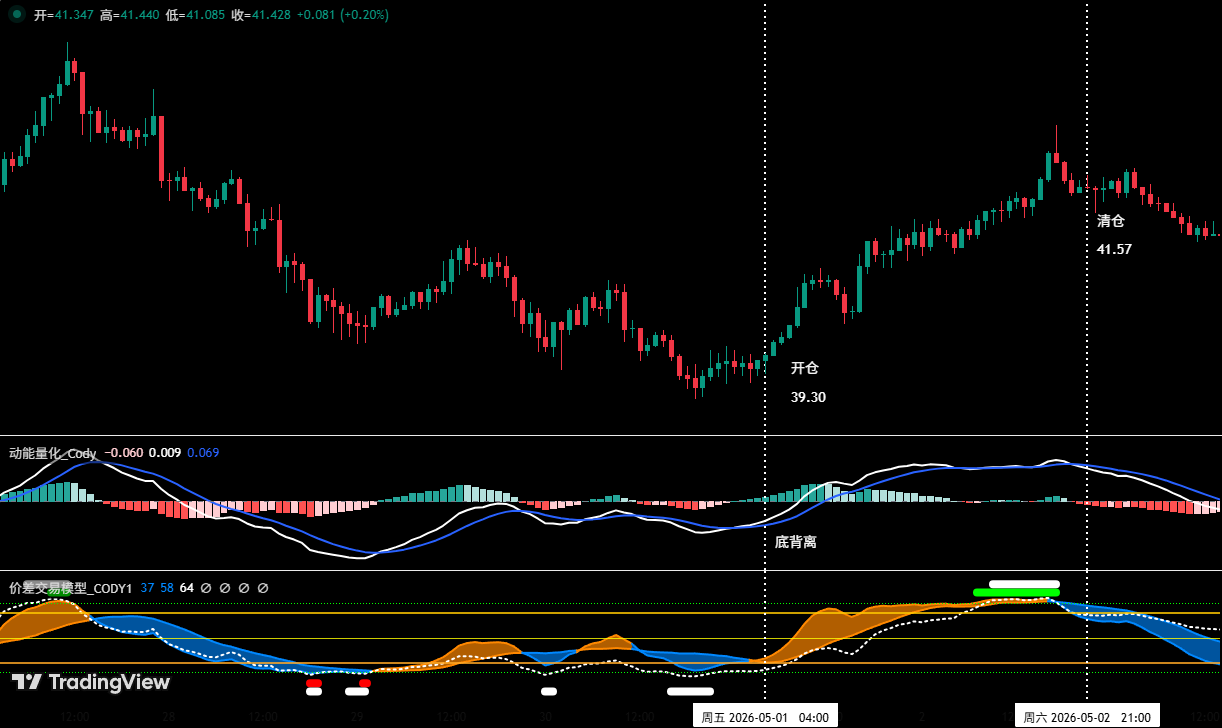
Figure 5
6. Special Reminder:
- When opening a position: Immediately set the initial stop-loss.
- When profit reaches 1%: Move the stop-loss to the entry cost (break-even point) to protect capital.
- When profit reaches 2%: Move the stop-loss to the 1% profit level.
- Continuous Tracking: Subsequently, for every additional 1% profit, move the stop-loss up by 1% accordingly, dynamically protecting and locking in profits.
Financial markets change rapidly. All market analysis and trading strategies require dynamic adjustment. The views, analysis models, and trading strategies presented in this article are derived from personal technical analysis, serve solely as a personal trading journal, and do not constitute any investment advice or trading basis. Market risk exists; invest carefully. Do not make decisions based solely on this content.


