US Treasury yields at 5.34%: Who's selling, and what signal does it send?


- Core View: The 10-year U.S. Treasury yield surged to 5.34%, a new high since 2002, with Q3 posting the steepest single-quarter increase in 32 years. The pricing weight is shifting from monetary policy to fiscal reality, global sovereign bonds are being repriced in sync, and crypto assets face complex transmission through three channels: discount rates, yields, and liquidity.
- Key Elements:
- The 10-year U.S. Treasury rose about 72bp in Q3 to 5.26%, the 30-year touched 5.69%, U.K., French, and Japanese government bonds surged in tandem, and the Bloomberg Global Aggregate Treasury yield rose to its highest since 2000.
- Three selling forces overlap: discounted policy credibility (if the pivot comes too early, the 10-year could hit 8%), interest expenses exceeding $1 trillion driving the supply cycle, and crowded shorts raising repo costs and amplifying volatility.
- In Q3, BTC and U.S. Treasury yields rose together in a rare pattern, with BTC up about 33% to $84,700, ETF single-week net inflows of $2.4 billion, and capital flows temporarily outweighing discount-rate pressure.
- Rising rates have a two-sided impact on crypto: stablecoin issuers' reserve income thickens (Circle's reserve income accounts for 95% of revenue), but holders' opportunity cost and financing costs rise in tandem.
- Citi raised its BTC target price to $113,000, implying three premises: sustained ETF inflows, controllable real rates, and stable regulation — a tone pointing in the opposite direction from the 5.34% yield.
- Over the past year, six types of BTC expression tools saw returns converge fully toward BTC: BTC fell 24.5%, MSTR fell 48.1%, HOOD fell 8.7%, CLSK fell 3.4%, with no independent price action.
One-sentence conclusion: The 10-year U.S. Treasury yield surged to 5.34%, a new high since 2002, posting the steepest single-quarter rise in 32 years in Q3. This selloff is compounded by three forces—repricing of policy credibility, supply pressure from the interest bill, and the amplifying effect of crowded positioning.
This article takes the rise in U.S. Treasury yields as its entry point, focusing on how it transmits to stocks, funding markets, crypto assets, and related expression vehicles: in Q3, BTC and Treasury yields rose together in a rare tandem, with capital inflows temporarily overwhelming discount-rate pressure; while over the past year, the returns of six "long Bitcoin" expression vehicles have all converged toward BTC itself. This article is a compilation of public information and industry observation and does not constitute any investment advice.
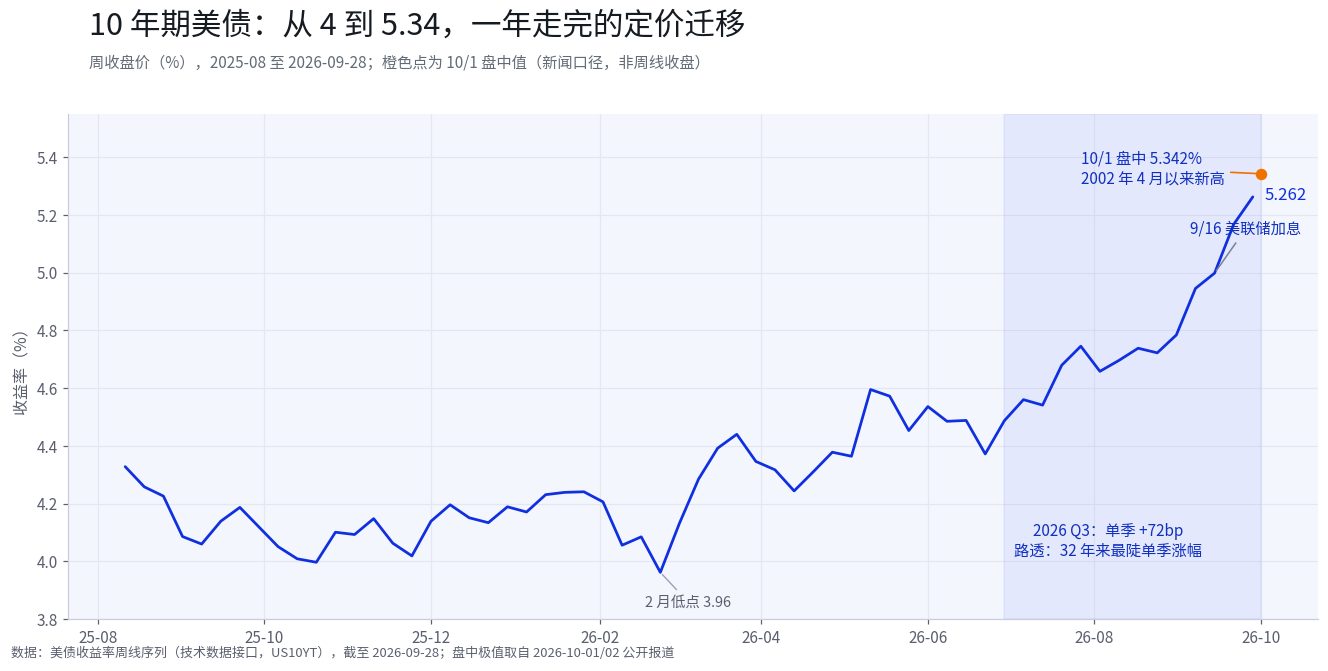
On October 1, the 10-year Treasury yield broke above 5.34% intraday, surpassing its 2007 high and returning to its highest level since 2002; the 30-year hit its highest since 2002 the same day, closing at 5.63% on October 2. Reuters put it more bluntly: this was the steepest single-quarter rise in 32 years.
Yet the market at the close appeared calm. The Dow closed at 50,926.56, up 0.04%; the S&P 500 rose 0.19%; the Nasdaq gained 0.04%. The indices recovered from an intraday pullback of nearly 1%, with Accenture surging 16% on AI orders and the optical communications sector rallying across the board.
The bond market set a historic record while stocks shrugged at the close. This contrast is itself a signal: the market does not believe rising yields spell doom for risk assets, nor does it consider them irrelevant. The real question is—who is selling, and what are they selling.
1. First, the Numbers
From August 2025 to February 2026, the 10-year yield traded sideways around 4% for over half a year, with a low of 3.96%. It began climbing in March and accelerated markedly in Q3: still at 4.54% in mid-July, it closed the week of September 28 at 5.262%, up about 72bp for the quarter. After the Fed's rate hike on September 16, yields showed no retreat, rising another ~26bp in the final week of September and touching 5.342% intraday on October 1. In Asian hours on October 2, it edged down to around 5.26%, which Reuters described as "some buyers returning after the bond decline."
The 30-year was more volatile. According to BTIG, in just 7 trading days the 30-year yield rose from 5.25% to 5.69%, a cumulative 44bp move; the Daily Sentiment Index (DSI) for bonds fell to 10% over the same period, an extreme pessimism zone. On October 2, the 30-year closed at 5.623%.
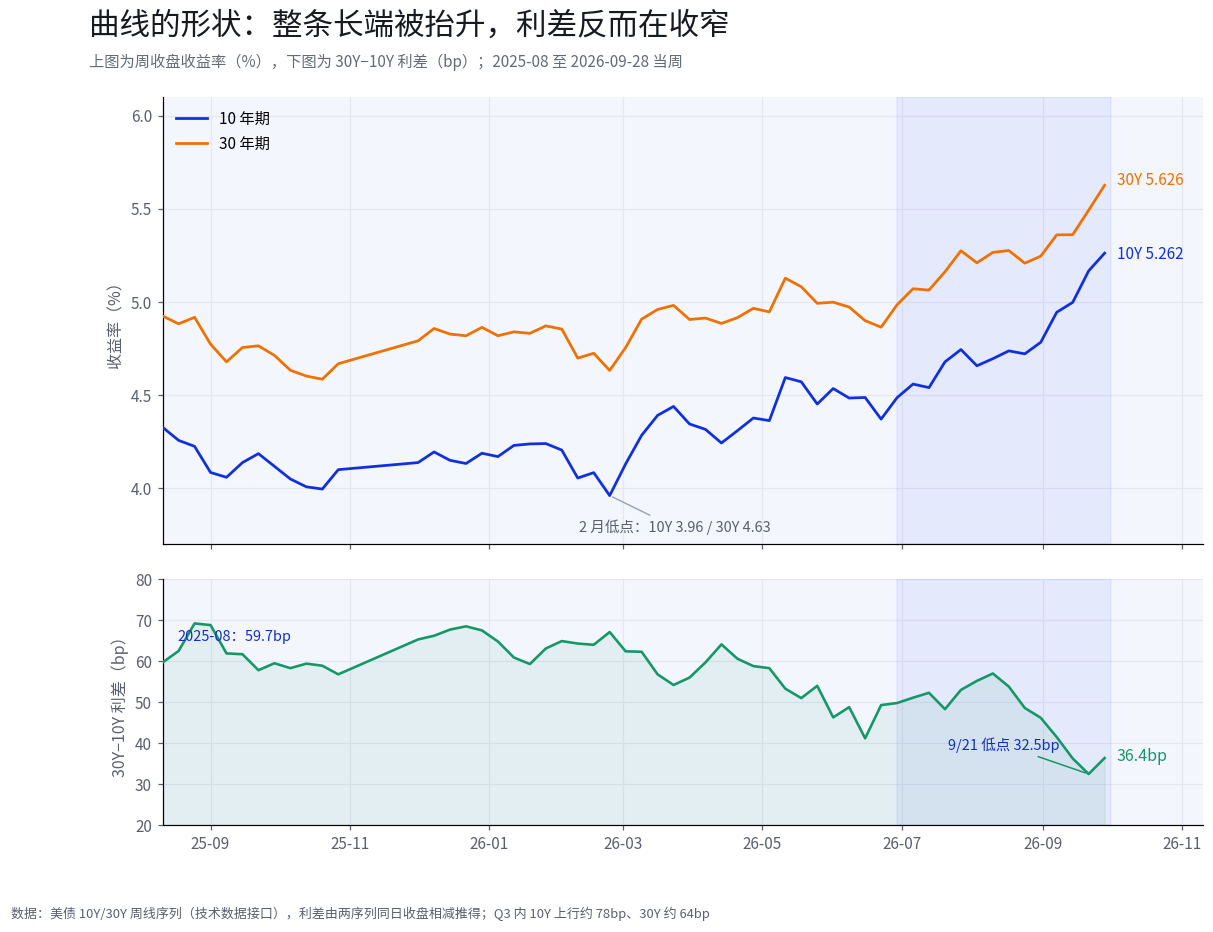
The curve shape contains more information. Within Q3, the 10-year rose about 78bp and the 30-year about 64bp, with the 30Y-10Y spread actually narrowing rather than widening, from 50bp to 36.4bp, briefly touching 32.5bp on September 21. This is not a steepening driven by "long-end panic alone," but rather the entire long end being lifted in sync—the focus of repricing may no longer be "how many more hikes the Fed will deliver," but "how much compensation is needed to hold long-term dollar debt."
This is not a U.S.-only move. On the same day, October 1: the U.K. 30-year gilt yield touched 6%, the first time since March 1998; French government bond yields hit an 18-year high, with the France-Germany 10-year spread widening to 146.68bp, the widest since 2012; Japan's 10-year rose to 3.11%. The yield on the Bloomberg Global Aggregate Treasury Total Return Index rose to its highest since 2000, with global bonds down about 2.7% year-to-date.
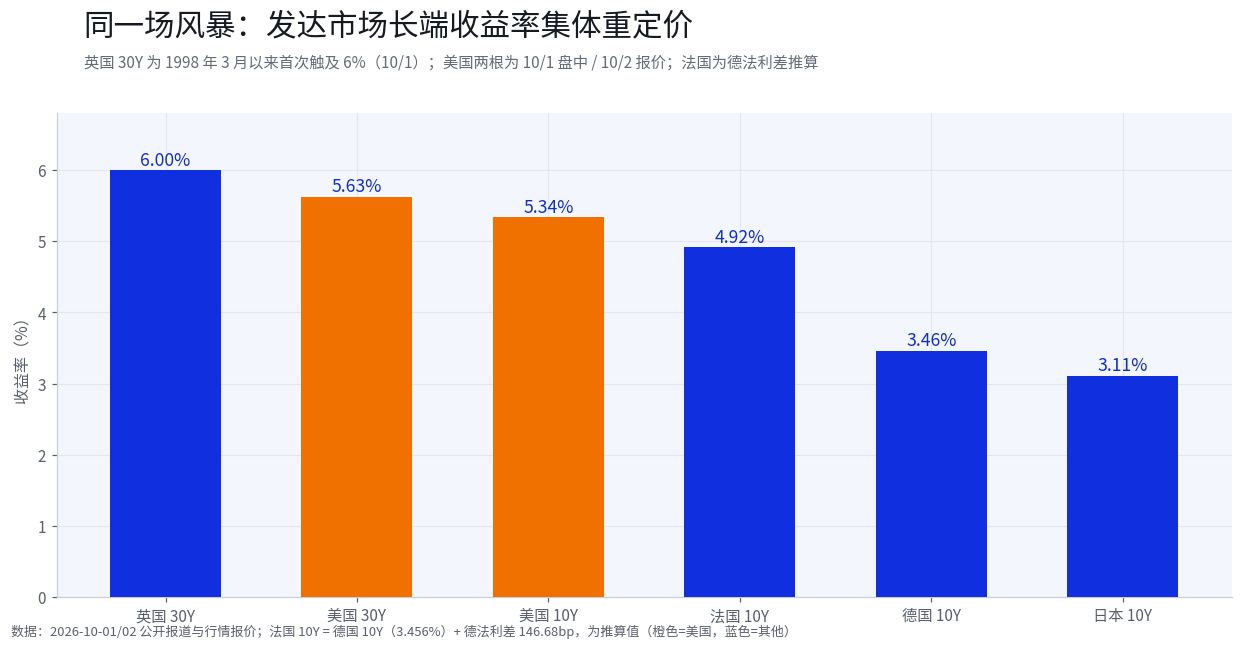
Developed-market sovereign bonds repriced collectively in the same quarter, ruling out a single explanation like "one country's policy misstep." The question becomes: what is simultaneously raising the term compensation on all dollar, sterling, euro, and yen assets within the same time window.
2. Who Is Selling: Three Explanations, Evidence on the Table
There are many explanations for this selloff, with widely varying degrees of traceable evidence. Breaking them apart is far more useful than lumping them together and shouting "bond bear market."
Explanation One: Policy credibility is being discounted. After the Fed's September 16 rate hike, bond traders were still pricing the possibility of further hikes; the consensus among some asset managers is that even weaker employment data may not change this expectation. T. Rowe Price's head of investment-grade bonds said employment needs to approach zero or negative growth and wages must fall well short of expectations—"the bar is actually very high." TS Lombard chief economist Steven Blitz offered a more extreme scenario: if the Fed repeats its "original sin" and pivots prematurely before inflation subsides, the 10-year yield could reach 8% in the years ahead. 8% is a tail scenario, but its mechanism is worth noting: if a central bank eases before inflation is contained, the market may demand compensation through yields rather than commentary.
Explanation Two: Supply and the interest bill. U.S. Treasury interest expense has exceeded $1 trillion this fiscal year. The higher the yields, the more expensive refinancing becomes; the more expensive refinancing, the larger the new issuance; the more issuance, the higher the compensation demanded in the next round of pricing. This loop can self-reinforce without depending on any sudden event. Global synchronicity supports this explanation: the U.K., France, and Japan face the same type of fiscal reality, and the magnitude of yield increases broadly matches the fragility of each country's fiscal space. When four sovereign issuers are asked for higher compensation in the same quarter, a single central bank factor is insufficient to explain it.
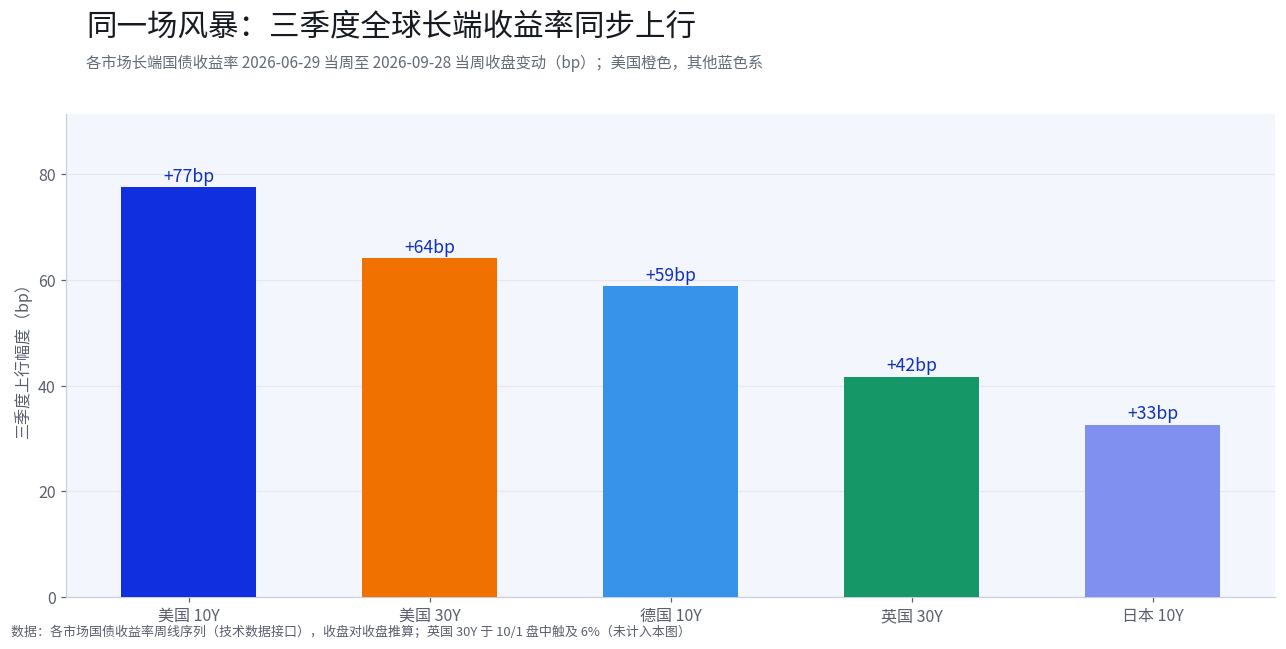
The chart above is the most direct quantitative support for Explanation Two: in Q3, the U.S. 10-year rose about 77bp and the 30-year about 64bp, Germany's 10-year about 59bp, the U.K. 30-year about 42bp, and Japan's 10-year about 33bp—the magnitudes differ, but the direction is entirely consistent.
Explanation Three: Crowded positioning amplifies volatility. According to an October 2 report, short positions betting on further yield increases have surged, pushing up repo funding costs. This mechanism is self-reinforcing: the more shorts, the more expensive funding becomes; the more expensive funding, the more covering and stop-losses; the more stop-losses, the more prone yields are to overshooting. BTIG's Jonathan Krinsky concluded on this basis that yields may have neared the limit of tactical upside, with the potential for a rapid pullback in the short term. The DSI falling to an extreme reading of 10% is a signal that this force is building conditions for a reversal. It is important to distinguish: short positions, repo costs, and the DSI are all traceable data, whereas "crowding causes overshoot, and overshoot breeds reversal" is a mechanistic inference.
The three explanations are not mutually exclusive. Based on available public data, Explanation Two has relatively more support; Explanation Three reflects short-term volatility mechanics; Explanation One can be viewed as one of the tail scenarios and still needs to be validated by employment data, auction results, and repo spreads. Market disagreement exists as is: those who see 8% tend to treat Explanation One as the trend; bond market veterans who are bullish on Treasuries for the first time in six years tend to believe Explanations Two and Three will self-correct. The coexistence of different positions at the same price level indicates that long-short disagreement near the current level is highly concentrated. Which explanation you choose to believe determines which data you should watch next.
3. Transmission Paths: From Discount Rate to Crypto
Rising yields do not transmit to different assets through the same pipeline.
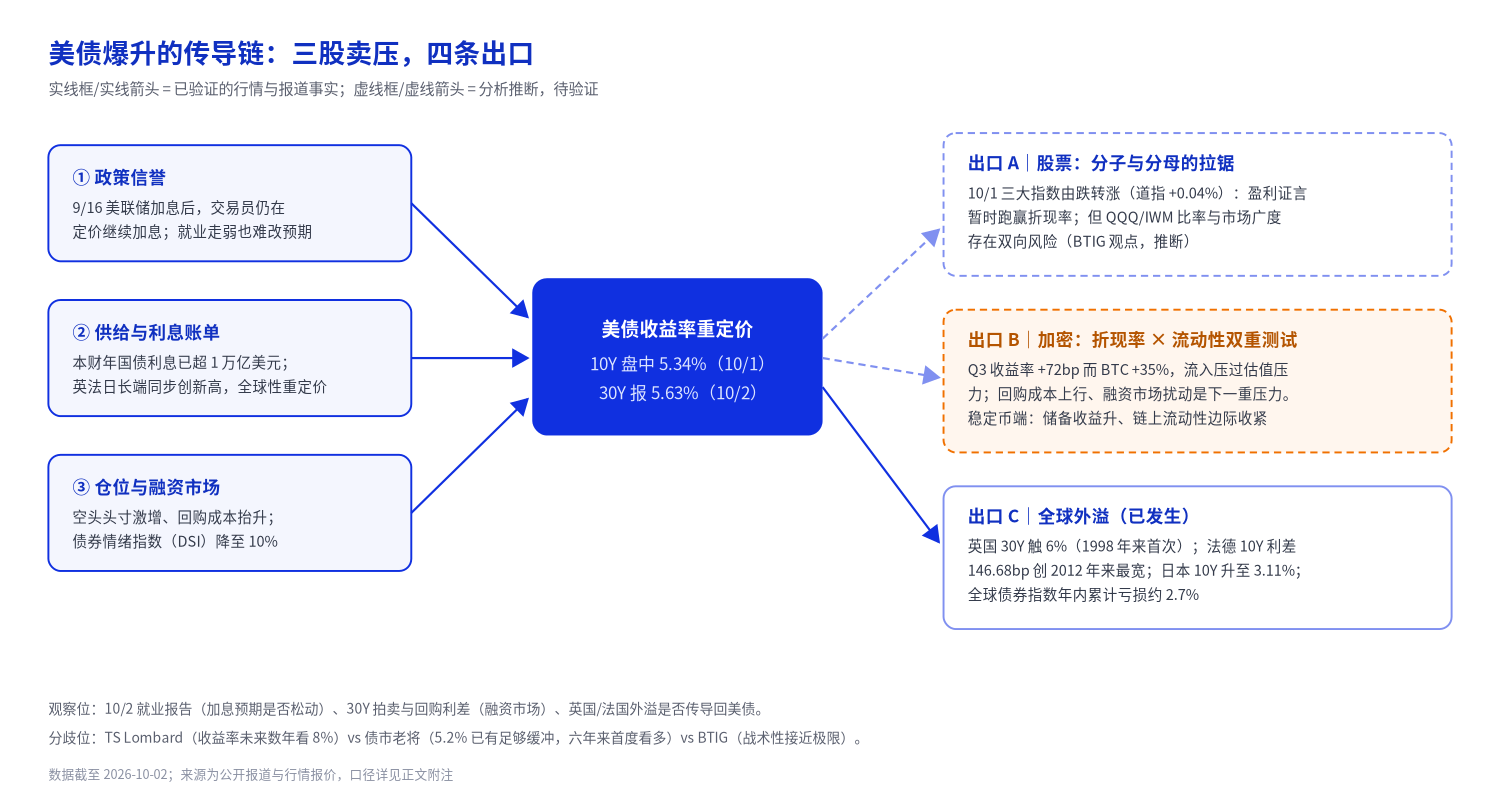
Stocks: Earnings expectations temporarily offset discount-rate pressure. The October 1 session provided a sample: yields touched 5.342% intraday, indices pulled back nearly 1%, then Accenture announced $84.5 billion in full-year new bookings and $22.2 billion in quarterly bookings, sending its shares up 16% and narrowing the major indices' losses to near flat. Discount-rate pressure objectively exists, but when earnings expectations are strong enough, the numerator can temporarily offset the denominator. BTIG's different view holds that the correlation change between yields and the Nasdaq is bidirectional: if yields fall rapidly, the previously concentrated positioning structure could face adjustment, and while market breadth recovers, the heavily weighted sectors could instead weaken. Index volatility is limited, but the internal structure may be shifting.
Funding markets: Repo costs are rising. Increased short positions pushing up repo costs means the funding cost for leveraged capital is rising. The repo market sits at the base of the dollar leverage system: hedge funds borrowing securities to buy bonds, market makers replenishing inventory, and corporates rolling short-term funding all depend on this pipeline. This pipeline is also relevant to crypto markets—perpetual contract funding rates, exchange leverage, and stablecoin inflows and outflows are downstream of the same funding conditions. Stress appears at the repo end first, and risk assets feel the pressure later.
Hong Kong stocks: The HKD is pegged to the USD, so funding costs transmit through. The Hong Kong dollar is pegged to the U.S. dollar, so rising dollar rates transmit to Hong Kong equity valuations through funding costs, with longer-duration growth sectors affected more directly. The Hang Seng Tech Index saw a modest rebound after the September 16 rate hike, then fell back, closing at 4,157.94 on October 2, down 2.26% from the prior day. Southbound capital is the buffer variable in this chain: its pace follows the mainland liquidity cycle more than dollar pricing, and whether southbound flows can offset foreign outflow pressure may be an important factor affecting the strength of this transmission chain.
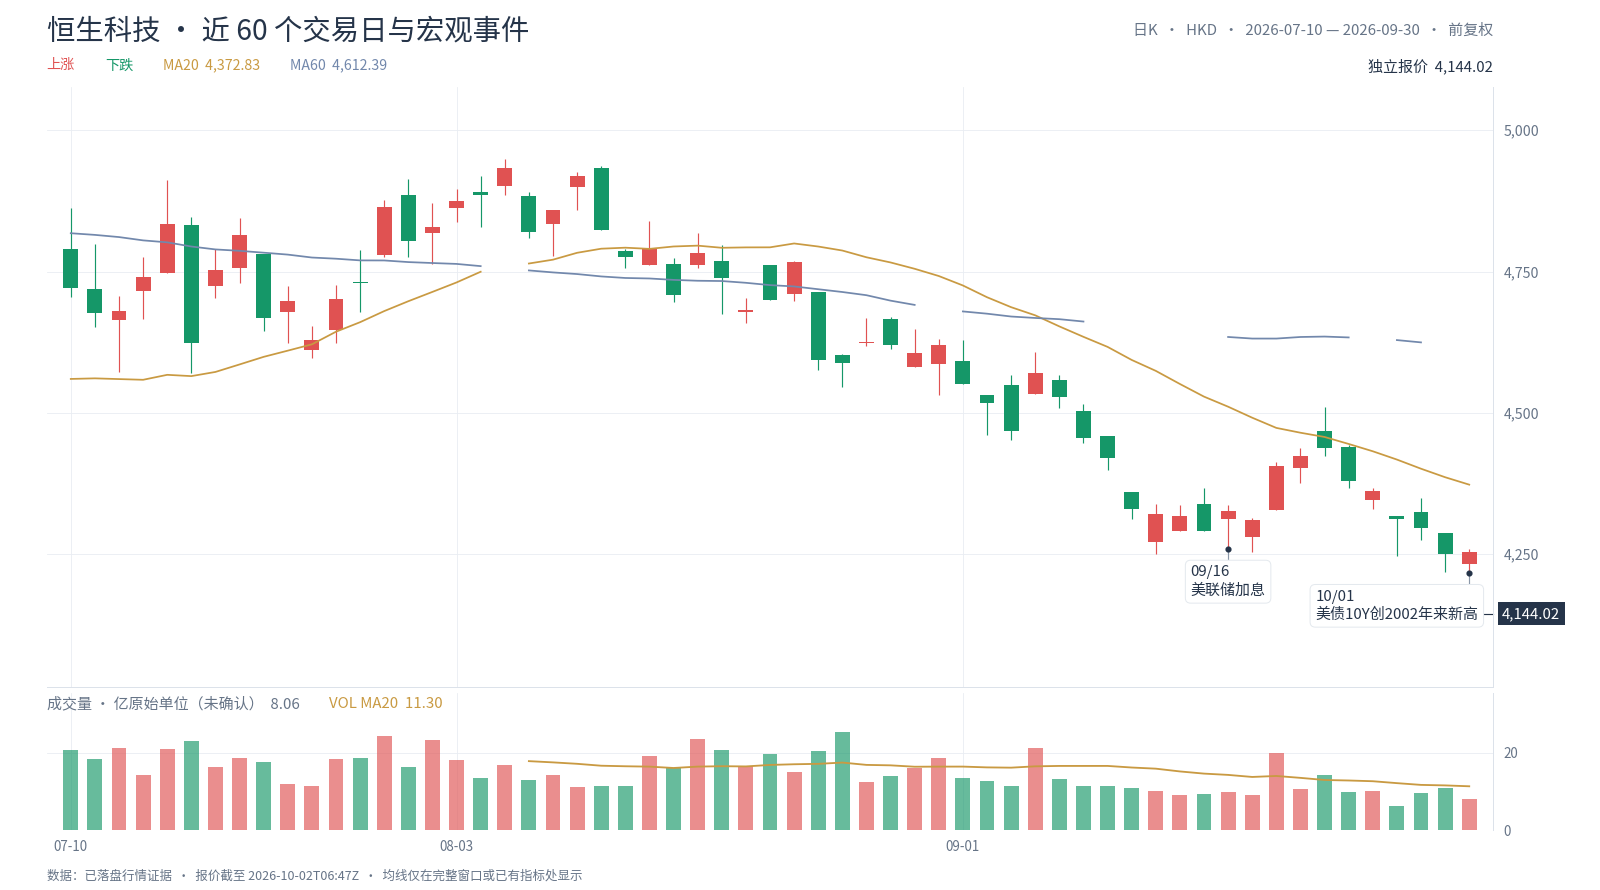
On the daily chart, the Hang Seng Tech Index spiked after the Fed's September 16 rate hike and began falling back around early October; in Asian hours on October 2 it stood at 4,144.02, down 2.58% (intraday reading, not yet closed). The buffer variable for Hong Kong stocks is the pace of southbound capital—it belongs to the mainland liquidity cycle and does not fully follow dollar pricing. The strength of this transmission chain depends on whether southbound capital can offset foreign discount-rate pressure.
For crypto: three channels, with inconsistent directions.
The discount-rate channel is negative. Rising real rates generally pressure duration assets, and BTC is structurally increasingly priced like a "no-cash-flow long-duration asset." The first half of 2026 already demonstrated this once: while yields traded sideways around 4%, BTC still fell from $117,000 to $63,000, mainly due to capital outflows and deleveraging—an effect that may exceed the discount-rate channel itself. This suggests one thing: for crypto assets, the first sensitive variable may not be the level of rates, but the direction of marginal capital.
The yield channel is positive, but less discussed. The higher Treasury yields are, the fatter the reserve income for stablecoin issuers whose primary reserve assets are short-term Treasuries. Industry research provides a sense of scale: Circle's Q2 reserve income this year was $668 million, about 95% of revenue, with a business model approximating the conversion of on-chain liabilities into an on-chain Treasury portfolio. Each step up in rates thickens the spread of this "on-chain money market fund." The cost is on the holder side: once the risk-free rate stands above 5.3%, the relative opportunity cost of holding volatile assets rises in tandem. Issuer income thickening and holder opportunity cost rising occur simultaneously—this is the double-sided impact of rising rates on crypto assets.
The liquidity channel is tightening. Rising repo costs, funding market disruptions, and global portfolio rebalancing triggered by rising bond yields are all draining risk appetite at the margin. The force offsetting this channel comes from ETFs: a late-September report said Bitcoin ETFs saw $2.4 billion in single-week net inflows, in the week the U.S.-China reciprocal tariff reduction framework was announced.
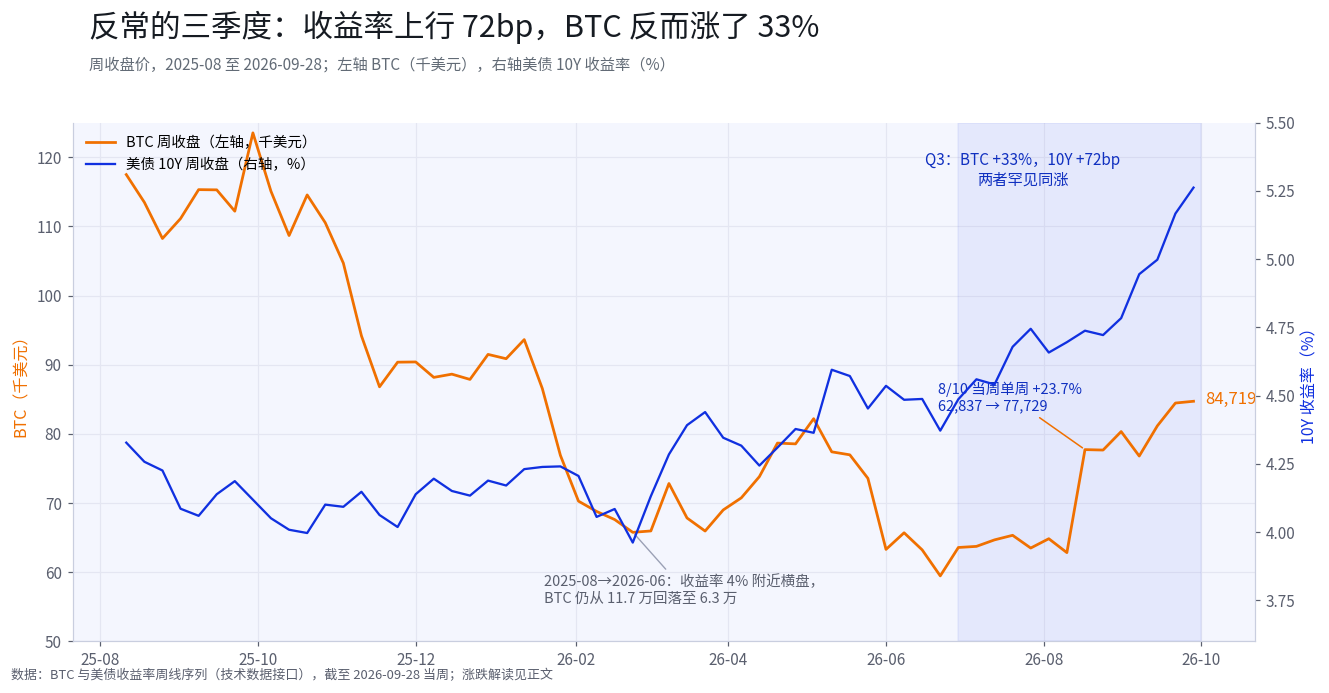
Q3 produced a counterintuitive scene: yields rose 72bp, and BTC gained about 33%. On a weekly basis, BTC went from about $63,600 at the end of June to $84,700 in the week of September 28, surging 23.7% in the single week of August 10. This directly conflicts with the intuition that "rising yields are bearish for crypto." ››

Comparing weekly returns over the past year week by week: in Q3, rising yields and rising BTC almost always appeared together; but looking across the full year, the relationship was sometimes positive and sometimes negative, hardly stable. In other words, the tandem rise was a Q3-specific phenomenon, not a rule one can rely on. If the two consistently moved inversely, "rising yields are bearish for BTC" would be near common sense; if they consistently rose together, BTC would have become purely a risk asset. Neither is currently the case—one possibility is that the dominant driver of BTC shifted in Q3, with rates receding to a relatively secondary position.

On the daily chart, BTC did not fall after the September 16 rate hike and accelerated upward in late September, closing at $84,469 on October 1. There are three explanations in the market for this tandem rise. The first is inflationary: nominal rate increases are partly absorbed by inflation expectations—Middle East tensions once pushed WTI above $100, after which it retreated—and nominal assets typically draw more attention in an inflationary environment. The second is growth-driven: AI capex boosts earnings expectations and risk appetite, with yields and risk assets rising together, a combination that was on display in U.S. equities intraday on October 1. The third is capital-flow-driven: sustained ETF net inflows combined with the landing of the U.S.-China reciprocal tariff reduction framework, with capital flows temporarily overwhelming the discount rate.
The three explanations are difficult to judge on existing data alone, but their robustness differs: the first two rest on fundamental changes, while the third rests on capital flows, which can reverse more quickly. One cross-signal worth tracking: if yields continue to rise while ETF inflows slow markedly, it may mean the scenario described by the third explanation is receding—at which point the influence of the discount-rate channel could re-expand.
4. $113,000: The Preconditions for Citi's Target Price
On October 1, Citi raised its 12-month Bitcoin target from $82,000 to $113,000 and Ethereum from $2,240 to $3,028, and projected about $5 billion in net inflows into crypto investment products over the next 12 months. On the day the report was published, spot BTC stood at $83,251 (Citi's figure), about 35.7% below the new target. On the same day, the 10-year Treasury hit its highest since 2002—the research report and the market gave off opposite tones.
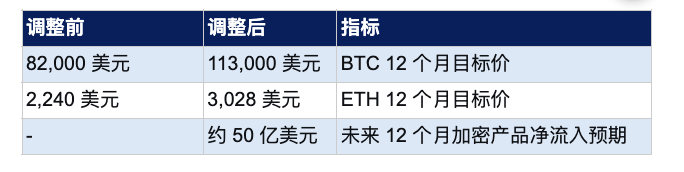
The way to put both into the same framework is to distinguish the time dimension. The $5 billion net inflow is a 12-month flow question, while 5.34% is a this-week price question—both can be true at the same time. This target implies three preconditions: sustained ETF net inflows (materializing and accelerating, with the $2.4 billion single-week inflow occurring just days before the report was published); controllable dollar and real rates without a discount-rate shock (currently being tested—after the rate hike, traders were still pricing more hikes, and the 30-year hit a 24-year high); and stable