






Monera Digital 6月の仮想通貨月報:最大の限界的買い手が去る時


- 核心見解:2025年6月、仮想通貨市場は、投降売りから長期保有者による静かな吸収への底値形成の予行演習を完了した。価格の半減、ETFの記録的な資金流出、MSTRの神話崩壊は、内部の清算が深海域に入ったことを示すが、売り手枯渇は初期確認され、ポジションは弱い手から強い手へと移行している。
- 主要要素:
- 価格とレバレッジの清算:BTCは月間19.2%下落し59,624ドル、月内最低58,201ドル、サイクル高値からの下落率は-54%に達し、正式に「半値」となった。月間のデリバティブ建玉は累計で23億ドル以上圧縮され、市場のデレバレッジが顕著である。
- 機関投資家の買いパラダイムの崩壊:Strategyは「決して売らない」という約束を破り、初めてBTCを減持有し、最大12.5億ドルのBTC現金化を承認した。過去最大の価格非敏感な買い手が、構造的な売り手となる可能性がある。
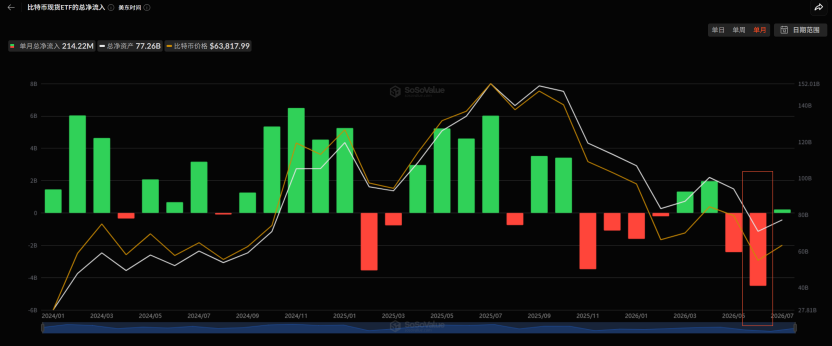
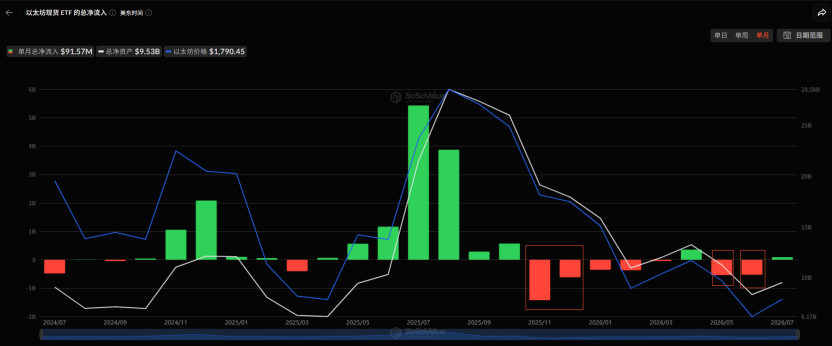
- ETF史上最悪の資金流出:BTCスポットETFは月間で約45.1億ドルの純流出となり、商品誕生以来最大の月間流出を記録。ETHスポットETFも同期間に約5.29億ドルの流出となり、米国ルートからの売り圧力が支配的である。
- マクロ悪材料のトリプルパンチ:米国データは利下げ期待を全面的に否定(5月の雇用統計好調、CPIおよびPCE予想上回る)、FOMCのタカ派的ドットプロットはスタグフレーション方向を確認、DXYが主導権を奪還しBTCを圧迫。
- オンチェーン吸収の浮上とバリュエーション極値:長期保有者が数月ぶりに純買い越しに転じ、LTH供給比率は88.1%と数年ぶりの高水準に上昇。Ahr999は0.283の「ゴーストゾーン」に低下、ネットワーク全体の含み損コインが含み益コインを初めて上回り、大規模なポジション移動が発生。
- 月末の構造的質的変化:ベアトラップによる新安値(57.8K)とスポット売り圧力の枯渇が区別され、オプション市場のガンマ構造はボラティリティ抑制に転じ、マーケットメーカーは60-64Kゾーンを価格設定。しかし、反転の三軸(ETF、米ドル、価格)はいずれも成立していない。
Core Conclusions
June was a public dismantling of faith and a textbook rehearsal for bottom-building. In May, we recorded "liquidity transmission failure." In June, the market answered the next question: what comes after transmission failure? It was internal liquidation descending from "distribution" into "capitulation," the cycle's strongest narrative ("never sell" corporate treasury) completing its self-negation, and the macro backdrop deteriorating from "good news fails to rally" to "actual tightening materializes." Simultaneously, it was a month where long-term holders returned to net accumulation after several months, and strong hands quietly accumulated during the depths of panic.
On the price front, BTC started the month at $73,764 and ended near $59,624, a decline of approximately 19.2% for the month. The two key lows within the month – $59,130 on June 5th and $58,201 at month-end – widened the drawdown from the cycle high of $126,000 in October 2025 to -54%, officially a "halving" from the peak. ETH fell from $2,007 to $1,572, a monthly decline of about 22%, with a low of $1,505.
Three main themes defined June:
1. The public breakdown of the institutional buying paradigm. At the start of June, Strategy broke its "never sell" promise by disposing of 32 BTC for the first time. Mid-month, its mNAV fell to 1.02, shutting down both its equity and credit financing channels. At month-end, it officially announced the "Digital Credit Capital Framework," with the board authorizing the monetization of up to $1.25 billion worth of BTC – "selling coins to pay interest" transformed from a tail risk into an institutionalized reality. The largest price-insensitive buyer of the past two years may not only fail to return but could become a reverse supplier of approximately 20,000 BTC.
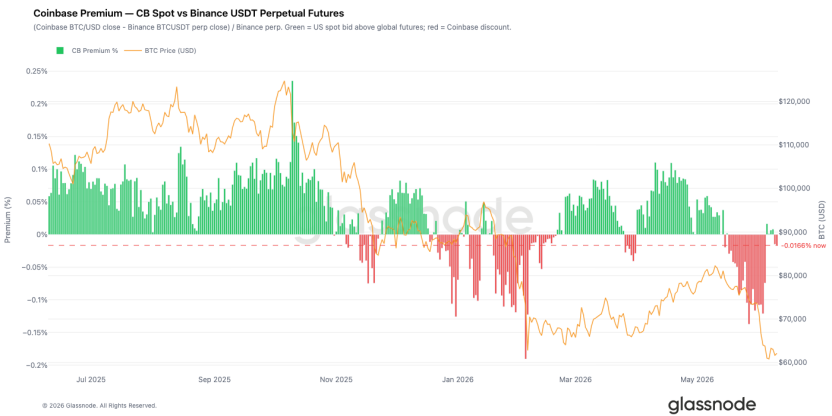
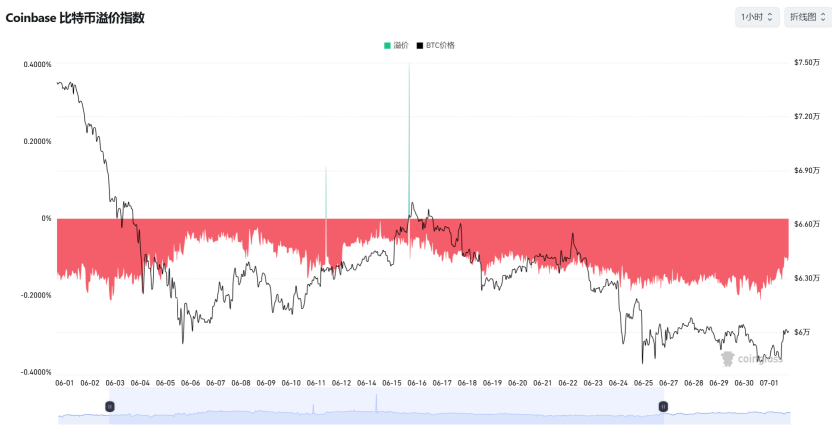
2. The worst single-month outflow in ETF history. BTC spot ETFs saw net outflows of approximately $4.51 billion for the entire month, the largest monthly outflow since the product's inception. This included a record 10 consecutive days of outflows and a panic-level redemption of -$696 million in a single day. ETH spot ETFs concurrently saw outflows of approximately $529 million. Redemptions exhibited full-spectrum risk aversion, and with the Coinbase premium remaining negative, marginal selling pressure from U.S. channels dominated throughout the month.
3. A complete microstructure evolution from capitulation to accumulation. The breakdown on June 24th was a "clean" capitulation driven by spot markets – selling pressure came from coin holders, with leverage merely amplifying the move passively. The monthly low of 57.8K on June 30th was a bear trap – spot selling pressure was exhausted, and the final leg of the decline was purely driven by derivatives shorts. This distinction is crucial: capitulation-style declines require time for sentiment repair, while trap-style declines only require shorts to admit their error.
Our assessment of the month: The deep bear market moved from the "mid-stage of liquidation" into the "deep waters of liquidation," preliminary confirming "seller exhaustion" by month-end. Evidence is threefold: panic has been fully released (Ahr999 fell to 0.283, historically a "ghost zone"; loss-making coins on the network exceeded profitable coins for the first time); strong hands have returned to accumulation (LTH shifted back to net buying, supply share rose to a multi-year high of 88.1%, accumulation showed broad-spectrum characteristics across groups); a structural shift occurred at month-end (BTC refused to make a new low on the day of the MSTR negative catalyst, market makers turned long Gamma in the 60-64K range).
But the sobering flip side is – none of the three reversal axes were established by month-end: ETF outflows hadn't stopped, the U.S. dollar hadn't fallen, and price hadn't reclaimed key resistance levels; STH-SOPR was still 0.14 standard deviations away from the heavy capitulation threshold, and the final capitulation-style volatility spike often accompanying cycle lows in history had yet to appear.
Extreme undervaluation and signs of accumulation define a bottoming zone, not a bottoming point. June provided a preliminary confirmation of seller exhaustion, not a final one. A bear trap can explain one tactical rebound but cannot define a cyclical bottom.
I. Macro: From "When Will Rates Be Cut" to "Rate Hikes Are Priced In"
In May, the market was still debating whether easing expectations could be repaired. June delivered a three-pronged negative response from the macro environment.
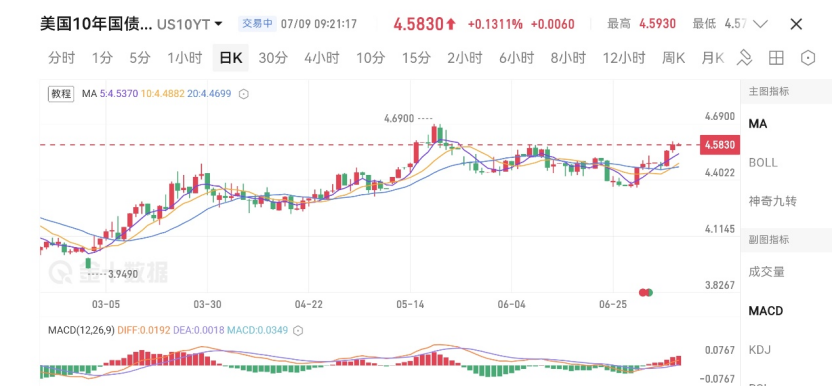
The first blow: data comprehensively disproved rate cut expectations. On June 2nd, JOLTS job openings came in at 7.62 million, a nearly two-year high and exceeding expectations by 750,000, pushing the 10-year Treasury yield back above 4.45%. On June 6th, the May nonfarm payrolls report was "red hot," extinguishing hopes for rate cuts. The market immediately priced in a 25bp rate hike before December, with a ~60% probability of an October hike, triggering a Wall Street crash on the same day (Nasdaq -4.18%, Philadelphia Semiconductor Index -10% intraday). On June 11th, the May CPI came in at 4.2% year-over-year, the highest since April 2023. On June 25th, the core PCE hit 3.4% year-over-year, the highest since October 2023, while the headline PCE reached 4.1%, breaching 4% for the first time in three years – inflation stickiness was repeatedly nailed down by four significant data releases.
The second blow: the hawkish FOMC dot plot confirmed the shift. On June 18th, the Fed held rates steady for the fourth consecutive meeting (3.5%–3.75%), but the SEP underwent a systematic stagflationary revision: the 2026 median rate was raised from 3.4% to 3.8%, the PCE forecast was raised to 3.6%, and GDP was lowered to 2.2%. New Chair Warsh set the tone in his first press conference, stating "persistently high prices are a burden on the people." Market institutions have already shifted from pricing in rate cuts to pricing in rate hikes.
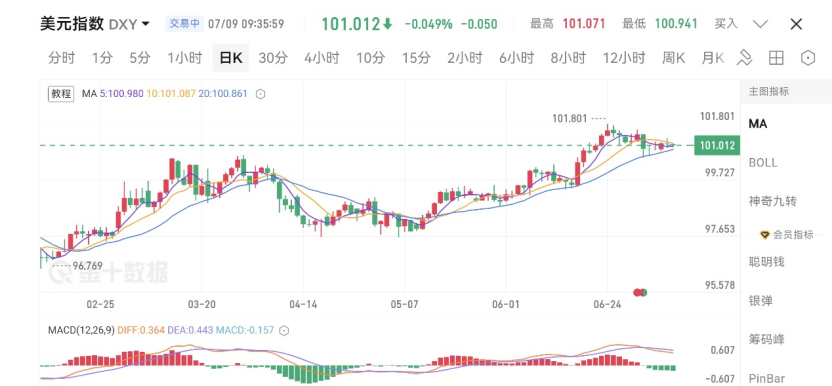
The third blow: the U.S. dollar regained dominance. The DXY reclaimed its 200-day moving average (101.80 vs. 98.72) in late June, the first time since the April "Liberation Day" shock. The negative correlation of "strong dollar suppressing crypto" from 2022-23 re-established itself after a period of decoupling: the S&P 500 recovered its year-to-date losses and stood above its 200-day MA, while BTC ended the month at an 18% discount to its own 200-day MA ($76,466). Macro recovery is purely an equity story; BTC didn't get a ticket. The Bank of Japan raised rates by 25bp to 1.00% (highest since 1995) on June 16th, but the Yen fell instead of rising, breaking through 162 at month-end to hit a nearly 40-year low, laying the groundwork for potential intervention that poses a risk to global risk assets.
Equity markets experienced extreme rollercoaster moves: early in the month, the Nasdaq broke 27,000, the Nikkei pushed to 70,000, and the KOSPI hit multiple new highs with several two-way circuit breakers in a single month. On June 6th, the nonfarm payrolls report triggered a global chain reaction crash (KOSPI -8.4% circuit breaker). At month-end, the AI CapEx bubble faced its first systemic pricing – the Philadelphia Semiconductor Index fell -7.87% on June 23rd, Apple fell 6.1% in a single day on price hikes due to "AI infrastructure costs passing to consumers," while Micron's blowout earnings and Korea's massive semiconductor national investment plan repeatedly rescued the narrative. The harsh reality for crypto throughout the month was: there was no spillover during the AI rally, but full resonance during the AI crash.
II. Geopolitics: Four Rounds of Rollercoaster, Crypto Absorbs Bad News but Not Good News
In June, the Middle East completed a full cycle of "breakdown – actual conflict – agreement – re-engagement – ceasefire again."
In early June, the negotiation farce quickly descended into live fire: The US and Iran exchanged military strikes on June 2-3. The US military conducted multiple airstrikes on Iranian soil on June 10-11, and Iran announced the closure of the Strait of Hormuz, stranding over 160 oil tankers. The IMO advised commercial vessels against transit for the first time in history – market pricing momentarily switched from a "geopolitical premium" to a "wartime discount rate," pushing WTI to $96.
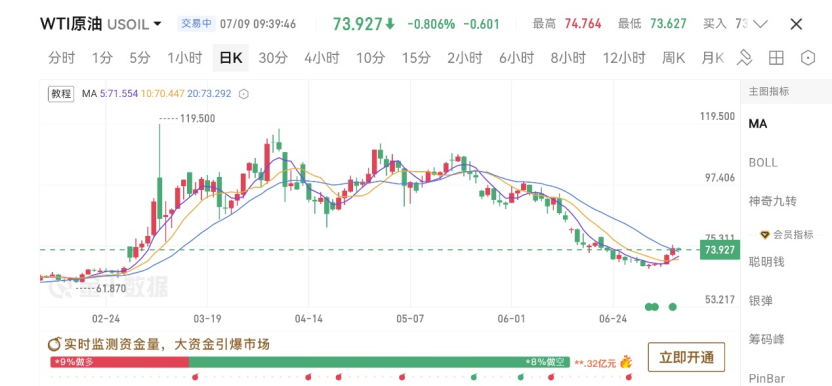
Mid-month, the narrative reversed 180 degrees: On June 14th, Trump announced a "birthday gift" agreement and the full reopening of the strait. On June 17th, the MoU was remotely signed and took immediate effect. Crude oil crashed from $86 to $76, gold's safe-haven premium was drained, and BTC merely recovered to the 65-66K corridor – oil was repricing based on real demand outlook, while BTC was simply repricing the disappearance of a headwind.
Late month saw "sign first, fight later": A cargo ship was attacked by drones on June 25th, leading to renewed US airstrikes on June 26th and Iranian retaliation against US positions. Another ceasefire was agreed upon on June 28th with Doha talks scheduled, but Iran subsequently denied it, and Israel publicly threatened "independent action."
Gold fell from $4,483 at the start of the month to losing the $4,000 level by month-end, a decline of about 10%. Every injection and withdrawal of the geopolitical premium was priced into precious metals, while BTC refused to bid on each de-escalation and fell fully on each escalation – the "digital gold" narrative was thoroughly invalidated in June. BTC was traded purely as a high-beta risk asset throughout the month.
III. Fund Flows: Record Monthly ETF Outflows, Waning Buyer Support
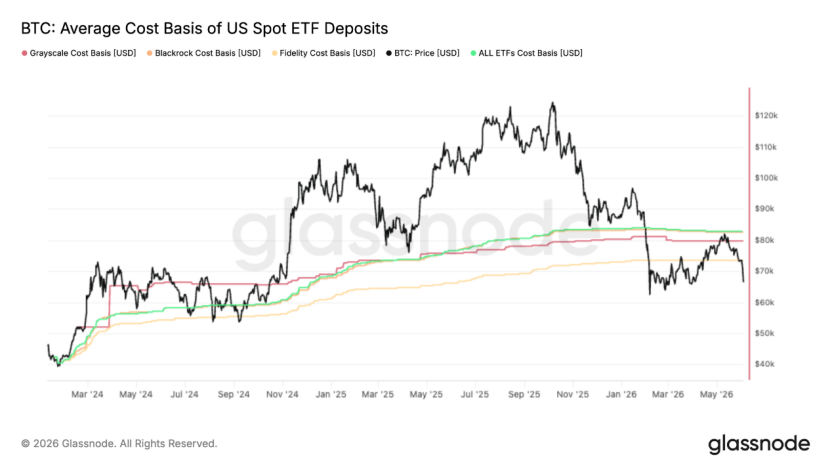
First, BTC spot ETFs experienced record outflows, approximately -$4.51 billion for the month, in a "three-wave amplification" pattern: during the early month crash phase, outflows totaled -$3.45 billion over 11 consecutive days, with a single-day peak of -$520 million. During the mid-month geopolitical détente period, there were only two or three days of minor inflows in the tens of millions, and the consecutive outflow streak became the longest since launch. In late month, despite apparent geopolitical easing, conditions worsened, with a single-day outflow of -$696 million on June 25th hitting a new phase high. This round of redemptions was "orderly but persistent," likely representing rational profit-taking by institutions that built positions at much lower prices, rather than pure panic – but this doesn't change the conclusion: "Good news fails to bring back flows, bad news accelerates flight." The most important incremental inflow channel was in a draining state all month. The 82.8K rebound in mid-May was precisely rejected at the ETF aggregate cost basis of 83K. The average ETF investor was underwater for the entire month, and "trapped investors reducing positions on bounces" formed a structural top-side supply.
Second, ETH spot ETFs saw net outflows of approximately $550 million for the month. The only countervailing force came from the DAT side: Bitmine increased its holdings by approximately 280,000 ETH against the trend, reaching a total of 5.7 million ETH. Sharplink resumed accumulation after 8 months. However, total industry DAT AuM has shrunk from $220 billion to $140 billion, and financing has largely stalled except for the top 2-3 players. Corporate treasury net inflows plummeted from a peak of 500M+/day in April-May to near zero in June—yet another marginal buyer disappearing.
Third, the Coinbase premium was deeply negative all month, but the most important marginal change appeared in late June: after BTC broke below 62K, the Coinbase Spot CVD Bias turned positive first, while Binance's remained negative – U.S. institutions began to absorb on the spot side, while offshore speculative capital remained defensive. Combined with Binance's order book depth imbalance turning to the strongest buy-side dominance in months, under the "sell ETFs + buy spot" hedging structure, genuine U.S. buying actually reappeared at lower levels.
IV. On-Chain: Structural Shift from Rebound Disproof to Accumulation Emergence
June presented the most contradictory yet information-rich on-chain picture of the month, with an overall evolution showing a clear chain of "disproof – capitulation – repair – accumulation."
The core signal early in the month was the disproof of the rebound. The 7-day moving average of the Realized Profit/Loss Ratio fell off a cliff from 3.16 to 0.29, and the 90-day moving average failed to touch the 2.0 threshold for the entire period, confirming the 82K bounce as a bear market rally, not a structural shift. The short-term holder cost basis broke below the True Market Mean for the first time since January 2022, officially confirming a "late-stage bear market" structure. Single-day realized losses expanded to $1.35 billion, with $770 million coming from the capitulatory liquidation of cycle-top buyers, as high-level bag holders began to realize losses substantially.
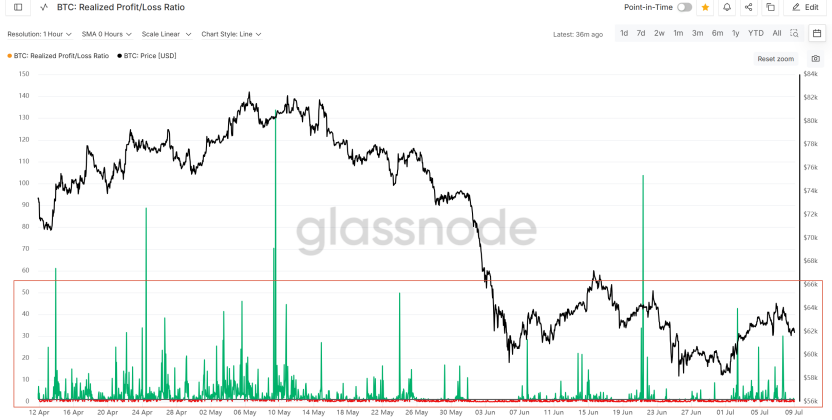
Capitulation then deepened further but did not yet hit historical extremes. The AVIV z-score hit a low of -1.09, entering the historically extreme discount zone. The supply in profit for short-term holders once dwindled to just 0.6% (four-year average of 55%), meaning over 95% of new buyers were simultaneously underwater. The STH-SOPR z-score hit a low of -1.86, just 0.14 standard deviations short of the -2 "heavy capitulation" threshold. The market was in a classic uncomfortable middle ground – loss realization was sufficient to confirm a deep bear market, but not yet enough to generate a persistent rebound at final strength.
Entering the second half of the month, signs of repair began to emerge. The short-term holder cost basis shifted down to 71.4K, as new buyers systematically built positions below the cycle average for the first time – a key early step in forming a bottom structure. The 90-day moving average of Net Realized P/L remained at -$205 million per day, with the market's gravity continuing to tilt towards the Realized Price ($53.4K). The dense short-term holder supply cluster at 66.8K–70.7K was clearly identified as the most immediate overhead resistance zone.
The most important change at month-end was the emergence of accumulation, and for the first time, it showed broad-spectrum characteristics across groups. The Long-Term Holder Net Position Change turned back into positive territory, ending their prolonged distribution phase. The Accumulation Trend Score rose significantly, with the <1 BTC and 100–1,000 BTC cohorts showing near-perfect accumulation scores, while the 1k–10k large holders also turned to net buying. The LTH supply share rose to a multi-year high of 88.1%. Concurrently, a cycle-level milestone was reached – loss-making coins on the network (10.83 million) exceeded profitable coins (9.22 million) for the first time. Historically, this collapse in the profit structure precisely forms the breeding ground for a massive migration of coins from weak hands to strong hands.
Extreme signals from the valuation dimension are equally noteworthy. The Ahr999 indicator read 0.283 at month-end, a level historically seen only during a handful of moments like end-2011, the 2018 bear market bottom, the March 2020 flash crash, and the November 2022 FTX crash. On the ETH side, the supply held with over 3x paper profit fell to 11%, the lowest since February 2017 – the pinnacle of valuation compression also implies a significantly lighter overhead supply overhang on the path of any future rebound compared to the previous two cycles.
In summary, June was a month of shattered rebound hopes on the price front,


