
杠杆出清、买盘缺席:比特币仍困在“最后一跌”的等待中
Original Author: Chris Beamish, CryptoVizArt, Antoine Colpaert, Glassnode
Original Translation: Chopper, Foresight News
TL;DR:
- The AVIV Z-score fell to -1.09 before retracing to -1.06, indicating that the current price has entered a deeply oversold territory relative to the cyclical average. The price failed to stage an effective rebound at these lows, and market panic sentiment continues to spread.
- Over 95% of short-term holders are currently at a loss, with the proportion of profitable short-term holdings recovering only slightly to 3.3%, far below the four-year average of 55%. This highlights a fragile market structure vulnerable to external shocks.
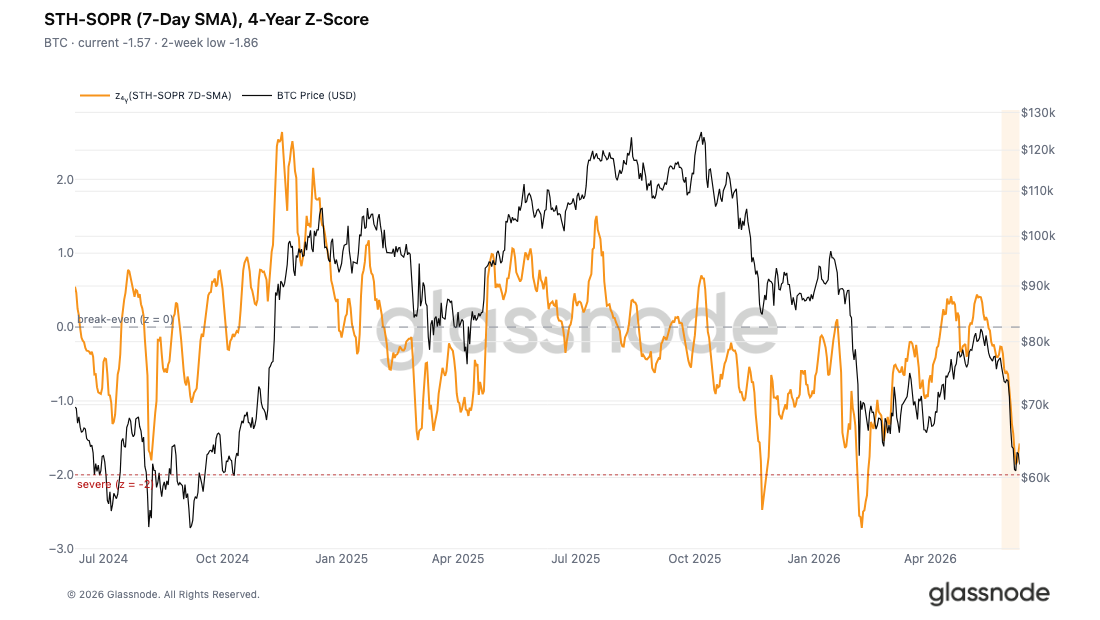
- The Short-Term Holder Spent Output Profit Ratio (STH-SOPR) Z-score dipped to a low of -1.86, narrowly missing the -2 threshold that historically signals deep panic selling. This indicates that market stop-loss actions are intensifying but have not yet reached a level sufficient to induce a sustained rebound.
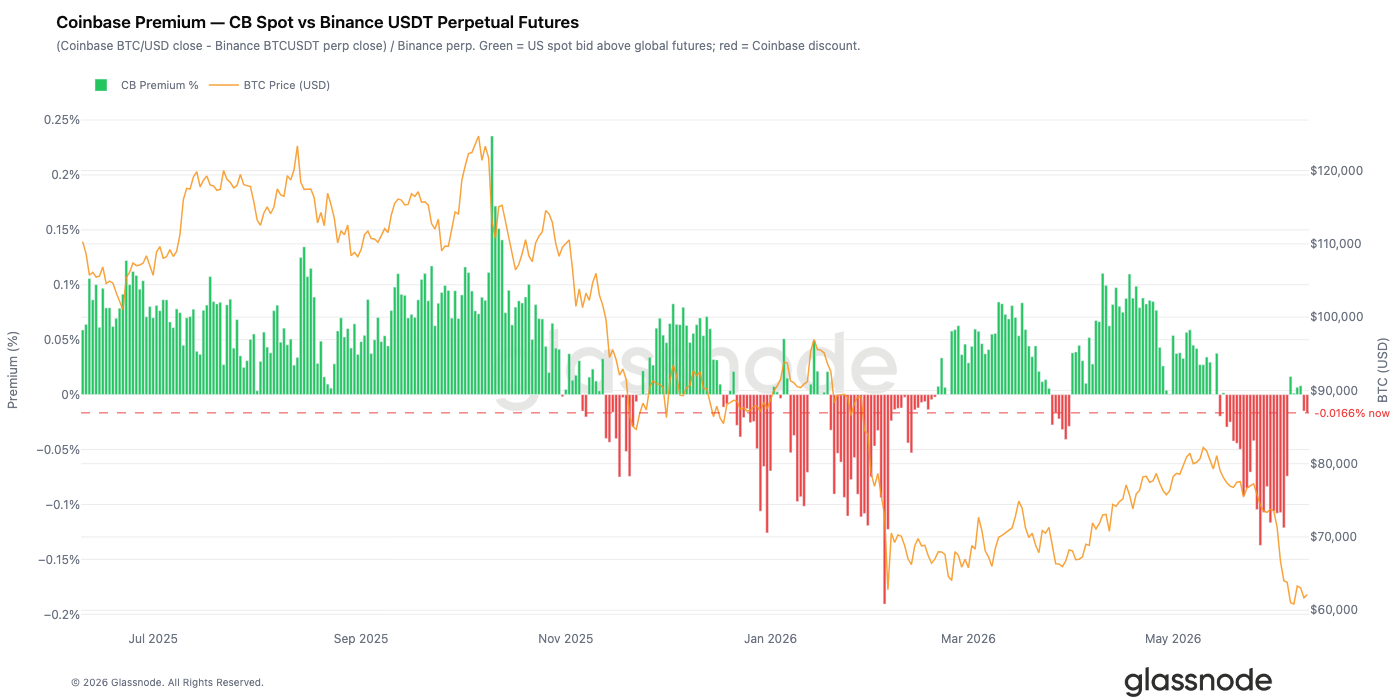
- Institutional demand in the US has cooled significantly. During Bitcoin's decline towards $60,000, the Coinbase premium remained in a persistent discount, reflecting a lack of active institutional accumulation on the spot platform.
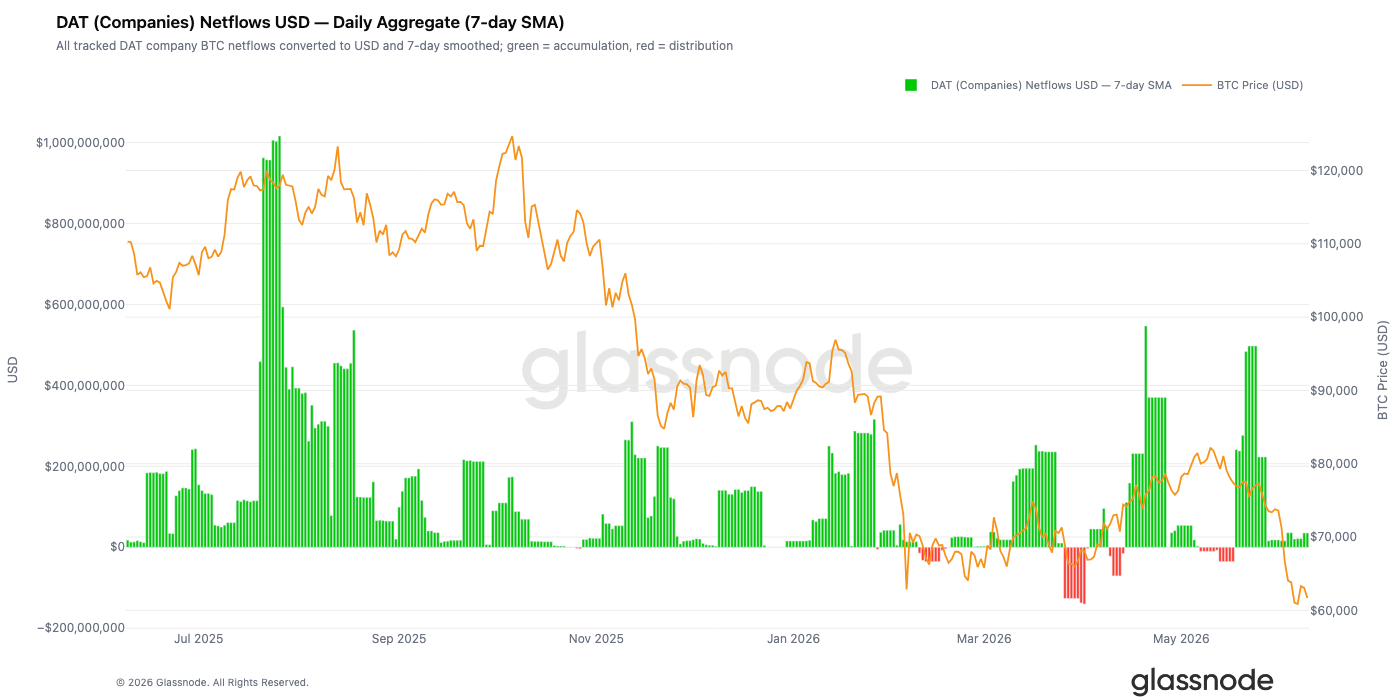
- The pace of corporate treasury Bitcoin accumulation has slowed dramatically. Since June, net daily corporate purchases have fallen from a peak of over $500 million to near zero, removing another key source of market support.
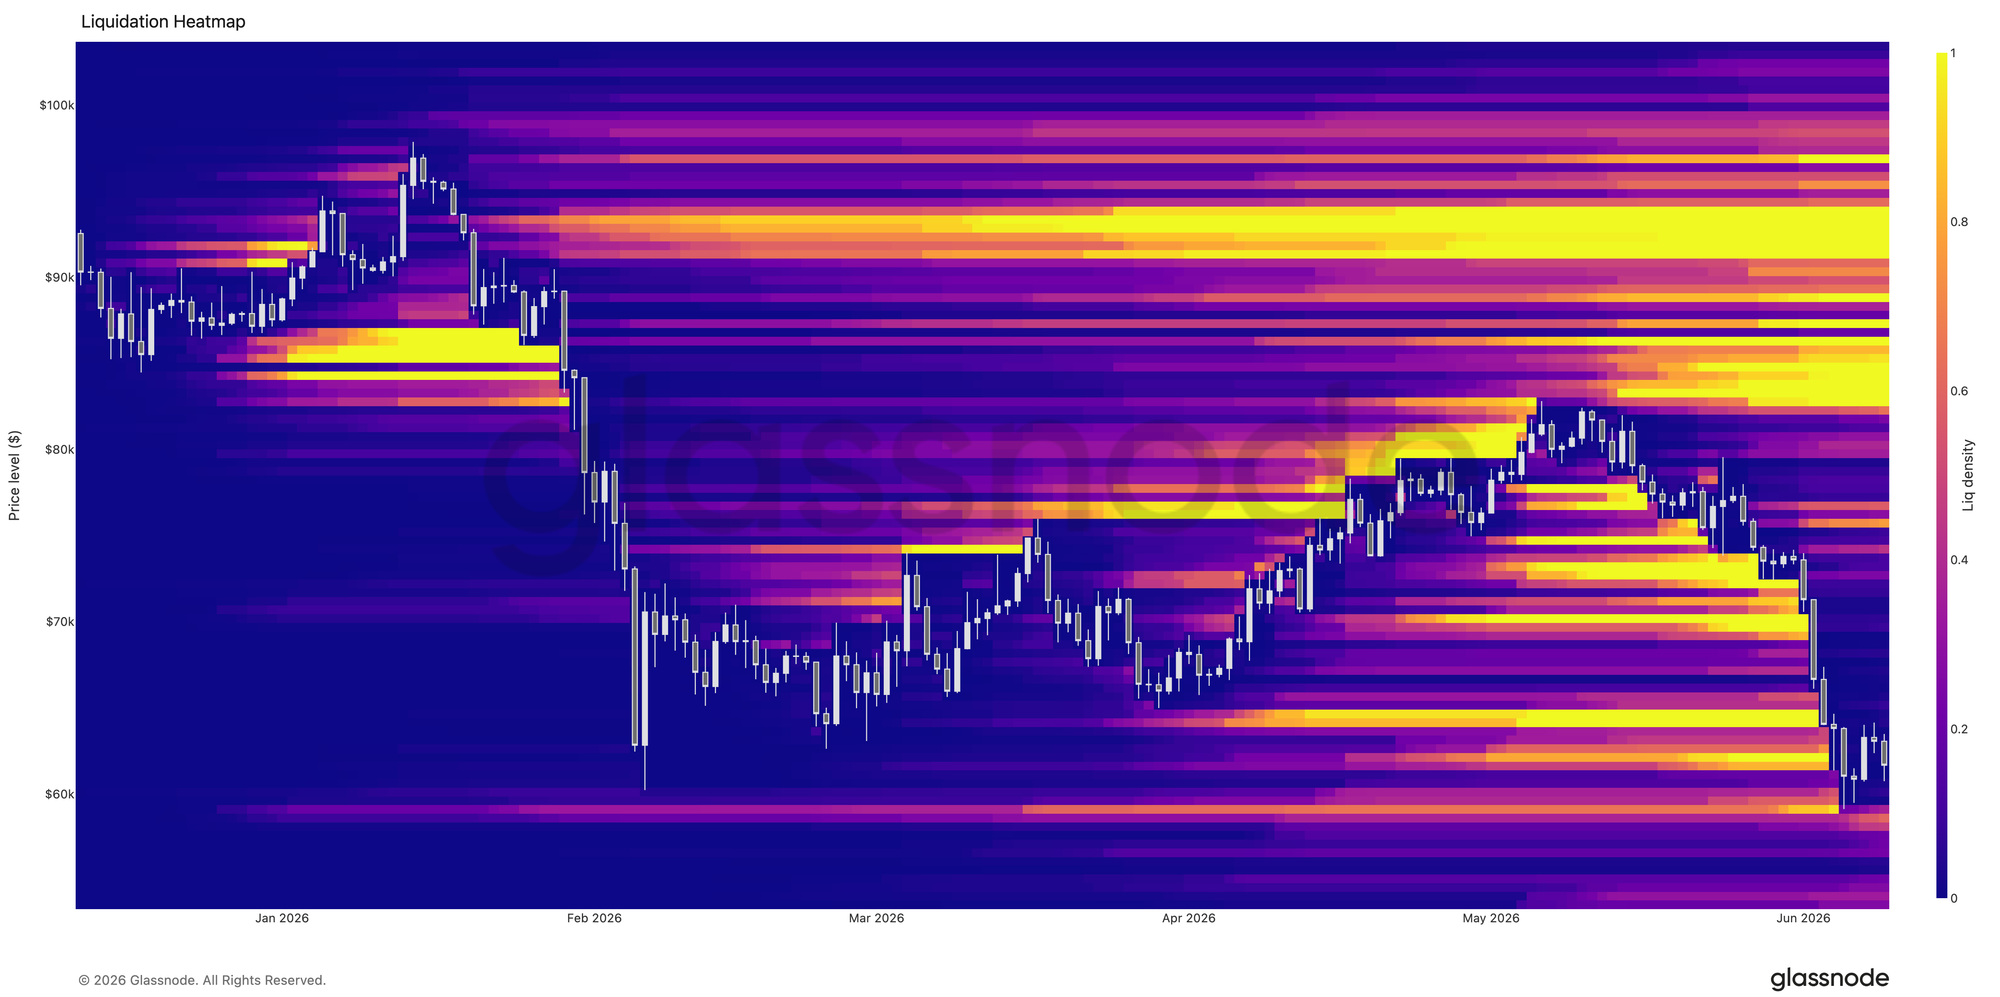
- Bitcoin's breakdown below key support levels triggered a significant deleveraging event, with a large number of leveraged long positions being liquidated, clearing out excessive speculative bets in the market.
- Implied volatility surged sharply after Bitcoin broke its range. The volatility risk premium continued to rise, with the uncertainty priced into the options market far exceeding the risk levels implied by recent realized price movements.
- The options volatility skew across all tenures soared, indicating a marked increase in demand for downside protection, with traders paying higher premiums for put options.
- Market action is predominantly defensive, with the largest negative gamma exposure concentrated near the $65,000 level, relatively close to the current spot price.
Macro Market Insights
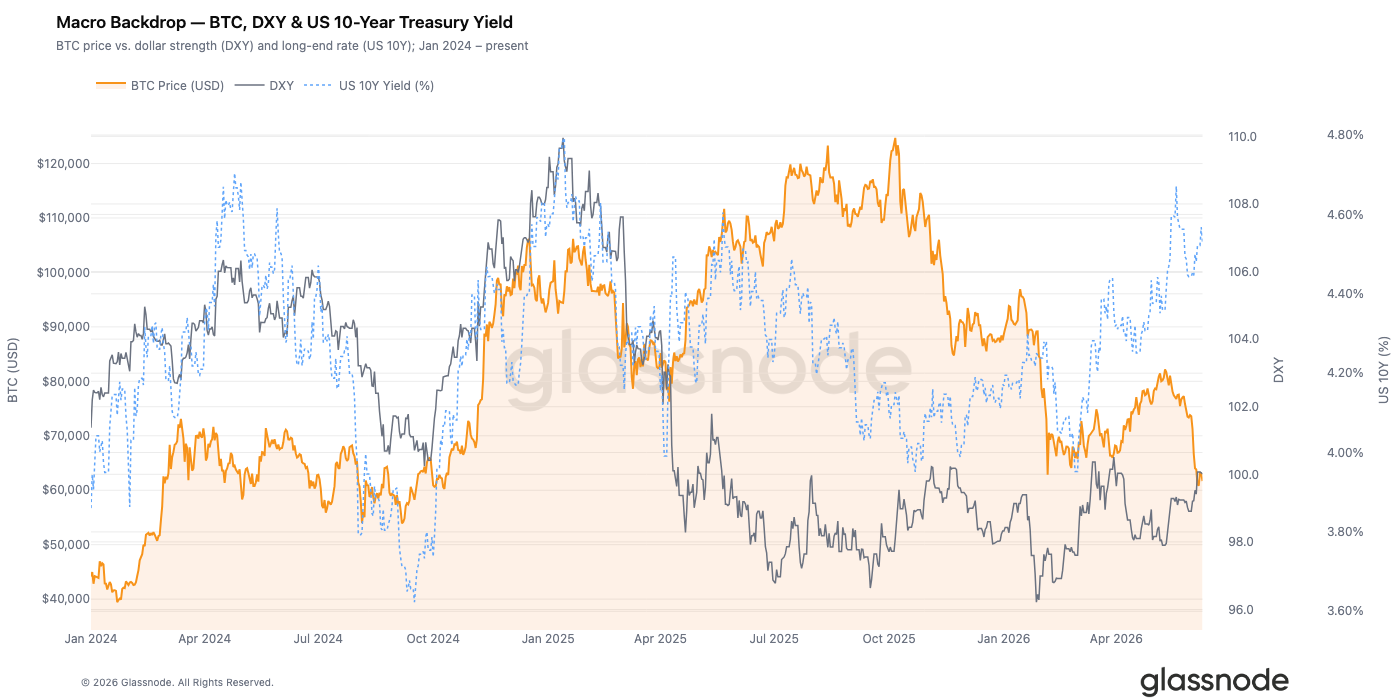
The US Dollar Index (DXY) closed at 100.01, up 0.8% for the week and 2.1% over the past 30 days. The sustained strength of the US dollar implies a general tightening of global liquidity over the past month. The 10-year US Treasury yield remained at 4.53%, while the 2-year yield was 4.14%, resulting in a spread of 0.39% (10y-2y). This yield curve shape suggests the US economy is in a late-cycle phase, with the Federal Reserve yet to make substantial adjustments to its monetary policy.
Amidst these adverse macro conditions, Bitcoin fell 7.5% this week to $61,700. After a period of divergence, the negative correlation established during 2022-2023, where a strengthening dollar weighs on crypto assets, has re-emerged. Historically, the combination of the DXY holding above 100 and the 10-year yield breaking above 4.5% typically compresses the speculative premium on risk assets.
For Bitcoin to stage a sustained recovery, one of two conditions likely needs to be met: the DXY breaking effectively below 99, or the 10-year yield retreating back to around 4.2%. Neither condition has been met so far.
On-Chain Data Analysis
Valuation Deep in Oversold Territory
Our previous analysis suggested that the May rally was a bear market bounce. The Short-Term Holder cost basis falling below the Real Market Mean for the first time since January 2022 signalled a late-stage bear market. This report follows the subsequent decline, which saw prices dip to $59,000, followed by a fragile period of sideways consolidation.
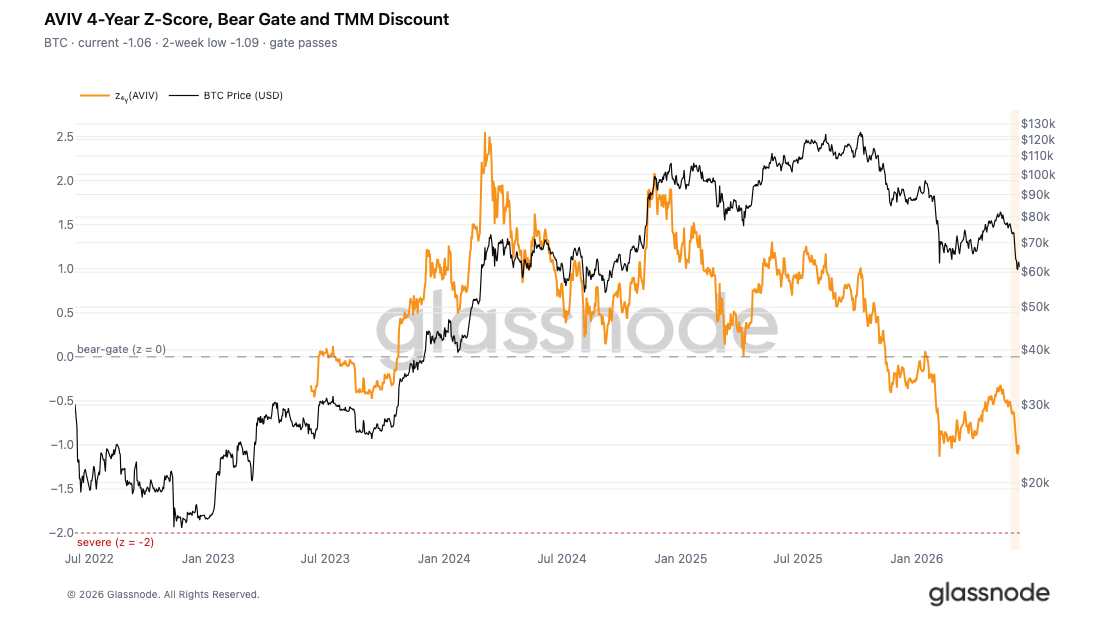
We use the Active Investor Value Deviation (AVIV) metric to gauge how far the current price is below the cyclical average. This metric compares the spot price to the Real Market Mean (the aggregate cost basis of active investors, excluding miners). Its four-year Z-score measures the price deviation relative to this baseline, with a Z-score of 0 representing the boundary between valuation premium and discount.
The current AVIV ratio is 0.80, corresponding to a Z-score of -1.06, having briefly touched -1.09 over the past two weeks. This places the valuation deep in the discount zone on a historical basis. The failure of the price to mount any significant recovery from these cyclical lows over the past week underscores the persistent nature of the market fear.
New Entrants Fully Trapped
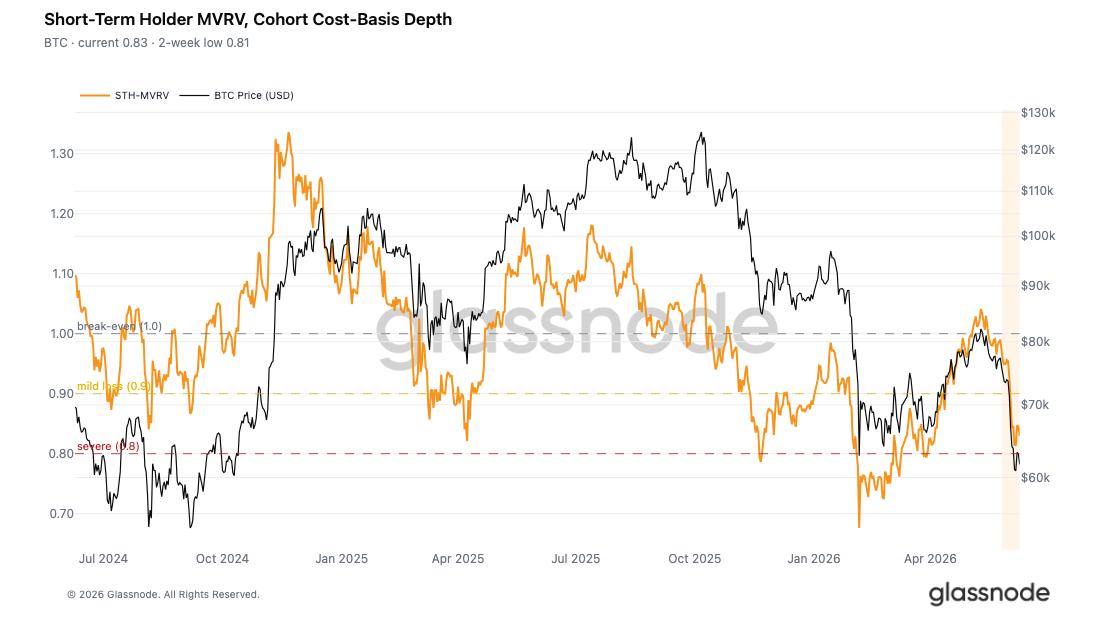
Building on the overall market discount, we analyze the situation of recent capital inflows. The Short-Term Holder Market Value to Realized Value (STH-MVRV) ratio compares the current spot price to the cost basis of short-term holders. A value below 1 indicates that this cohort is, on average, holding in an unrealized loss.
The metric recently hit a low of 0.81 before recovering slightly to 0.83. This implies that new investors are facing an average unrealized loss of 17% to 19%. It also confirms that the dense cluster of coins acquired during May's rally, between roughly $78,000 and $82,000, is now underwater, consistent with our previous assessment of "pressure on new entrants."
Brief price stabilization at low levels is a common pattern during downturns. After the initial round of forced selling from the most distressed holders, remaining participants often pause to assess. Whether this sideways phase forms a durable bottom or becomes a bearish continuation pattern depends entirely on whether new buying demand emerges at these levels.
95% of Short-Term Holders in Loss
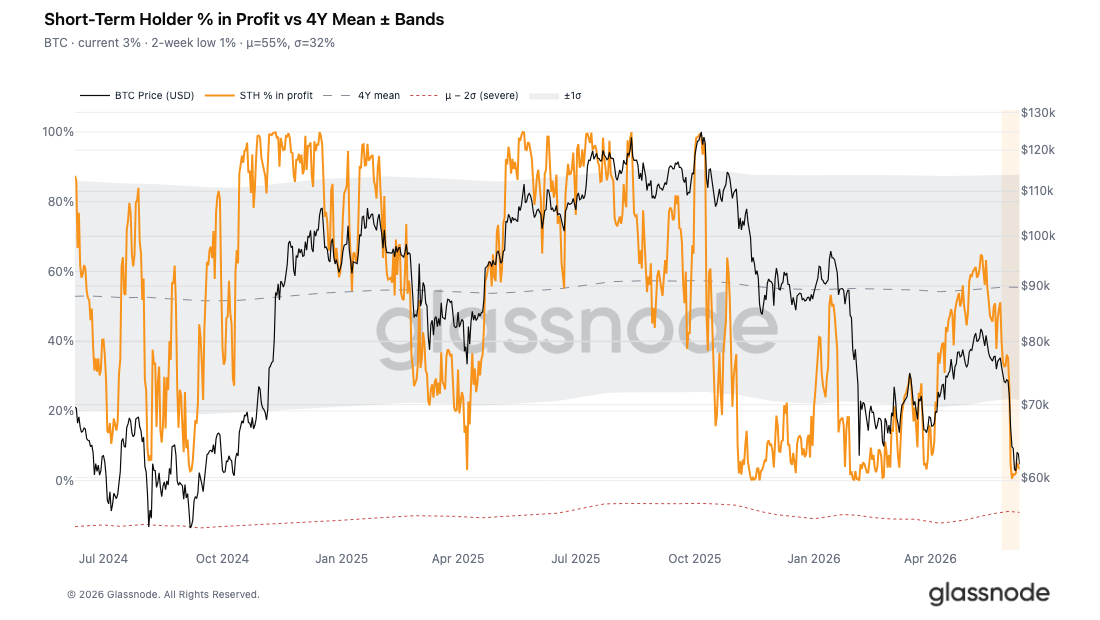
To further assess the pressure on short-term holders, we look at the metric for the percentage of short-term supply in profit. This metric measures the share of the short-term holder supply that is in profit, providing insight into the breadth of the loss, as opposed to just the depth measured by STH-MVRV.
This metric recently bottomed at just 0.6% and has only recovered marginally to 3.3%, far below the four-year average of 55%. In practical terms, this means over 95% of short-term holders are currently realizing or holding losses. Historically, this degree of loss represents a significant capitulation zone, a phase where new investors are broadly under severe pressure, rendering the market structure fragile and highly sensitive to any adverse external events.
The near-total market loss and the lack of significant recovery in this metric strongly suggest that the current consolidation is a period of temporary selling exhaustion rather than a completed market bottom.
Market Approaching Panic Sell-off Threshold
Beyond unrealized losses, the actual selling behavior of investors further confirms the severity of the current market. We measure the intensity of loss realization among new entrants by using the Z-score of the 7-day moving average Short-Term Holder Spent Output Profit Ratio (STH-SOPR), normalized against the four-year cyclical average.
The current Z-score is -1.57, with a two-week low of -1.86. This puts it just 0.14 standard deviations away from the -2.0 threshold, which historically has marked deep panic sell-off events.
The rate and frequency of stop-loss behavior among short-term holders are increasing rapidly, corroborating the record-high single-day realized losses of $1.35 billion mentioned in our previous report and the deep unrealized losses shown by STH-MVRV. However, the ultimate, explosive panic-selling event that historically paves the way for medium-to-long-term recoveries has not yet materialized.
The market currently occupies an awkward middle ground: the scale of realized losses is sufficient to confirm the bear market's depth, but it has not yet met the standard for a complete flushing out of sellers that typically forms a solid bottom.
Off-Chain Market Insights
Coinbase Premium Turns to Sustained Discount
The Coinbase Premium, which measures the price difference between Coinbase spot and Binance perpetuals, serves as a key indicator for US institutional demand. When Coinbase trades at a premium, it suggests institutions are actively buying spot Bitcoin, pushing its price above the offshore derivatives market.
In recent weeks, the market dynamic has completely reversed, with this premium persistently trading at a discount. During Bitcoin's decline towards $60,000, buying pressure on the US spot market has broadly cooled. The typical dip-buying behavior seen in previous corrections has been absent this time around, with institutions choosing to wait on the sidelines. This represents the disappearance of another important source of market support.
Corporate Treasury Demand Drops Significantly
Corporate treasury Bitcoin accumulation was a core source of market support between April and May, with instances of single-day net purchases exceeding $500 million. However, this demand has weakened markedly since June.
As Bitcoin retreated from above $75,000 to $60,000, net corporate buying volume shrank dramatically, dropping to a fraction of its previous peak. While corporations are still net buyers overall, the significantly reduced pace of accumulation signals a more cautious risk appetite among this cohort. In an environment of waning overall market sentiment, marginal buying demand has further decreased.
Widespread Deleveraging Below $70,000
Liquidation heatmap data shows a significant cluster of leveraged long positions built up in the $64,000 to $70,000 range. As Bitcoin probed lower last week, long positions within this range were liquidated en masse, with a cascade of forced closures pushing the price briefly below $60,000 before finding support.
The liquidity of long positions in this immediate range has been largely exhausted. The market has undergone a major deleveraging event. Compared to data from a week ago, the current leveraged position structure is healthier, with a significant portion of the excessive speculative leverage that accumulated during the recent range-bound trading having been cleared.
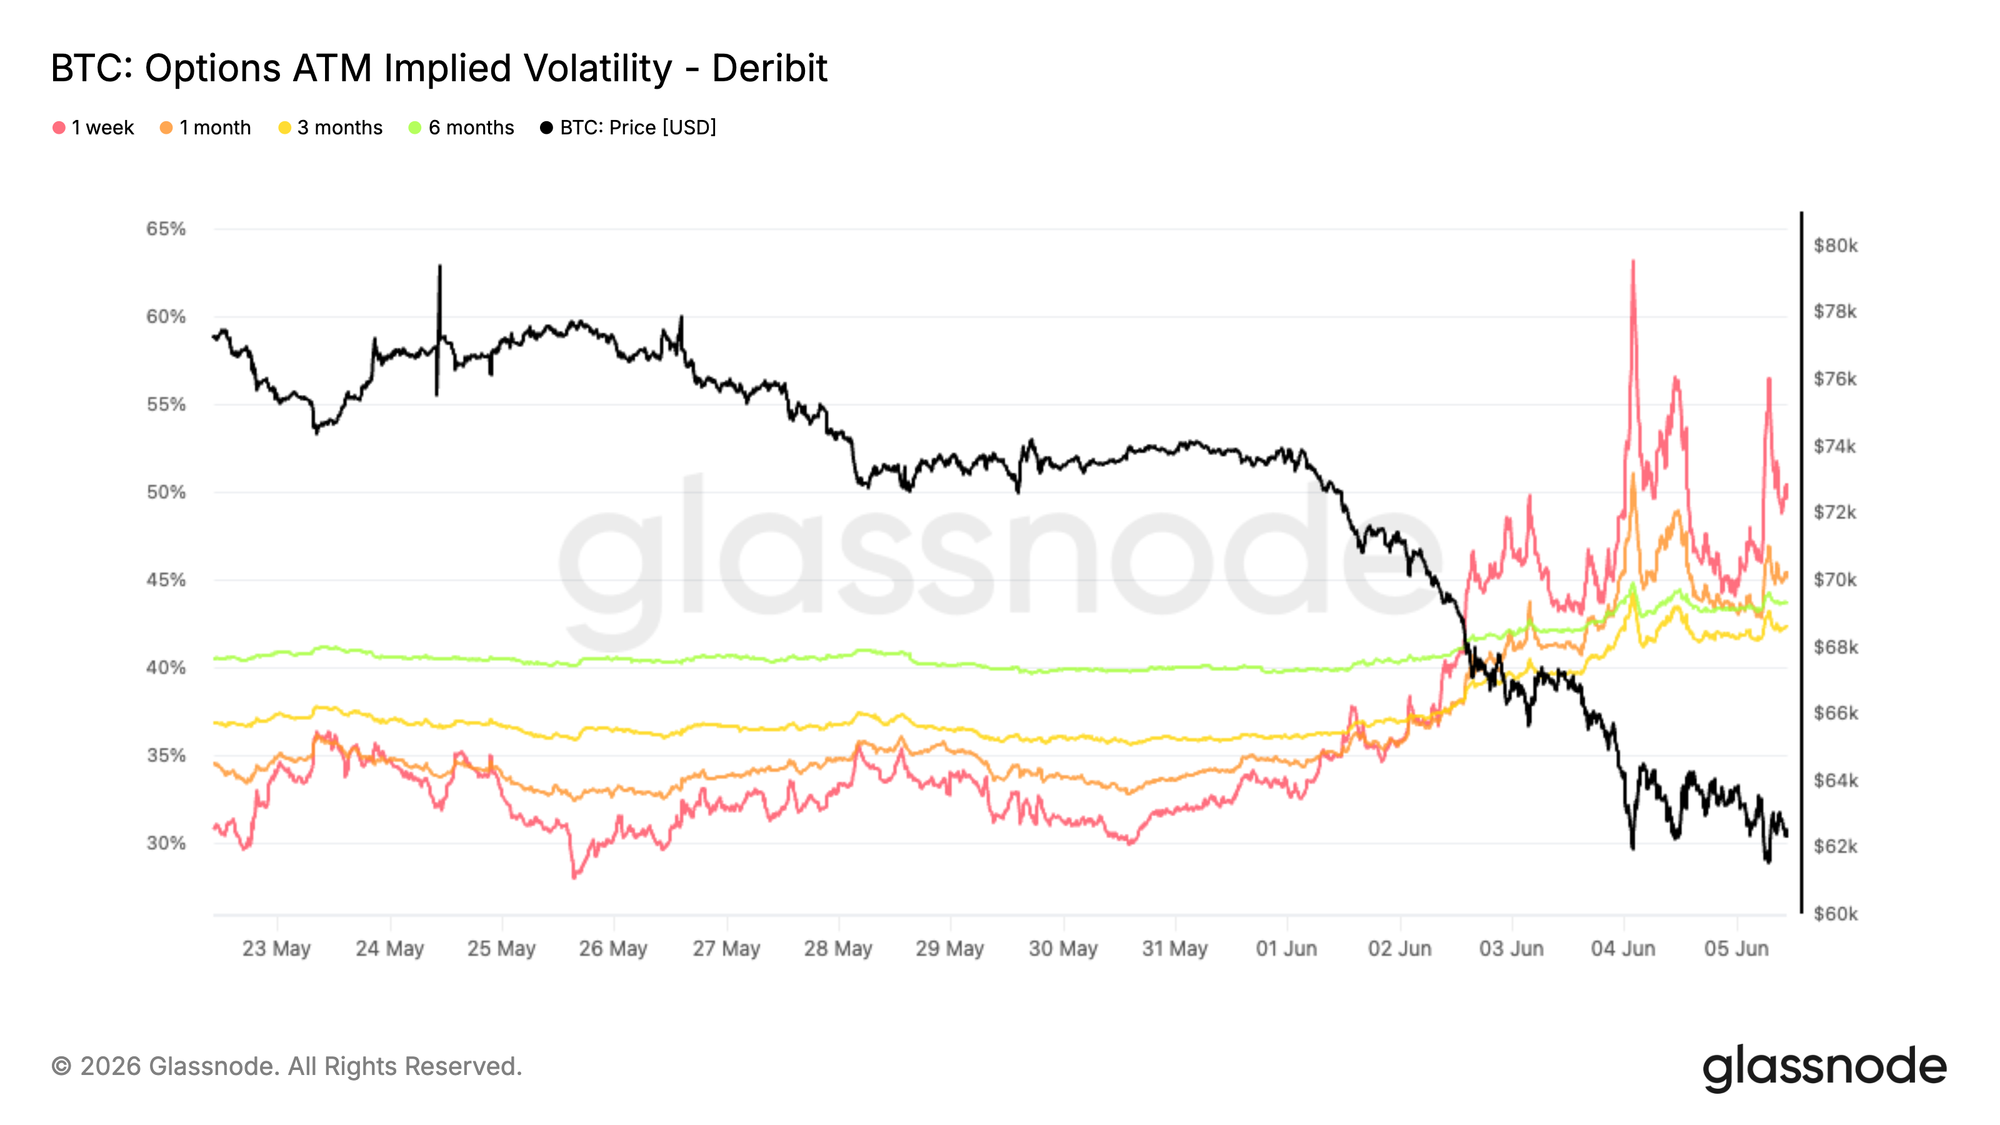
Implied Volatility Spikes Sharply
After Bitcoin broke out of its multi-month range, the entire volatility surface underwent repricing. As the spot price approached February lows, demand for options hedging surged across the board.
Short-term volatility reacted most violently. Implied volatility for 1-week at-the-money options briefly surged past 60% before settling around 50%. 1-month implied volatility rose from roughly 34% to 45%. Longer-dated tenors followed suit, with 6-month implied volatility climbing from about 40% to 44%.
This upward move in volatility represents a comprehensive reassessment of future uncertainty by the market, not merely a short-term emotional disturbance. Although volatility has come down from its peak, demand for options hedging remains high. Even as the spot price briefly stabilizes, traders are still willing to pay higher costs for risk protection. The breakdown has fundamentally altered the market's perception of volatility, driving hedging costs higher across all tenors and keeping risk aversion elevated.
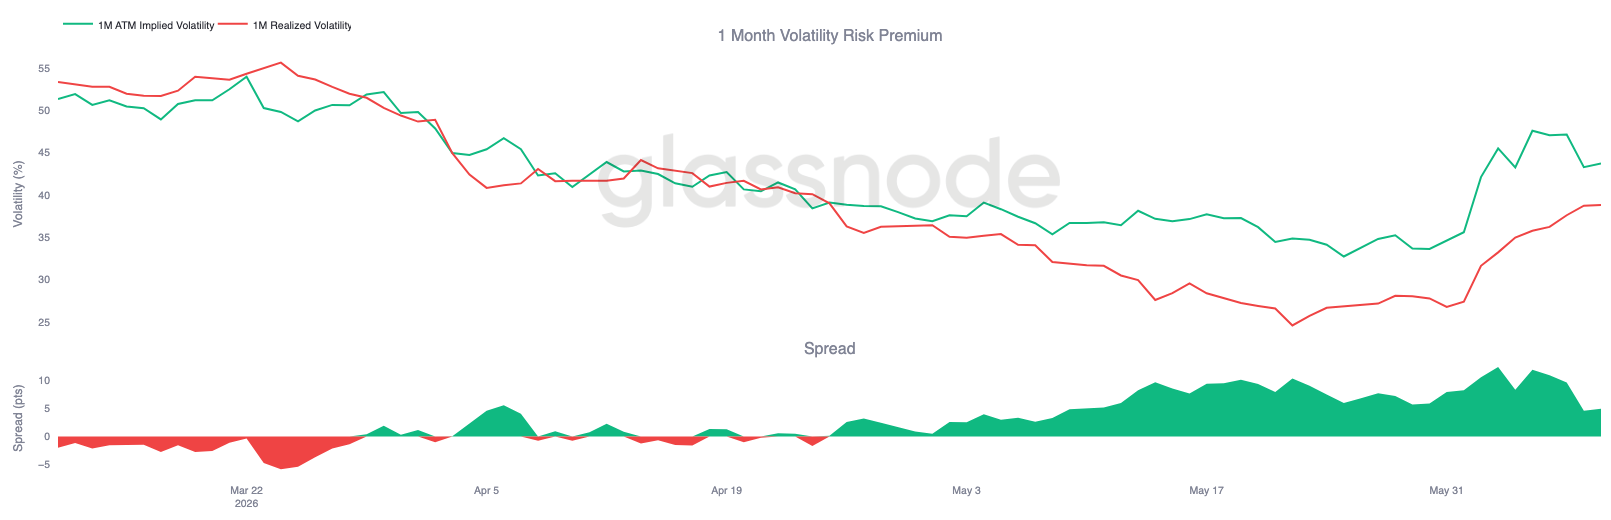
Volatility Risk Premium Remains High
After the sharp rise in implied volatility, comparing it to realized volatility reveals that the future price fluctuations priced into the options market still exceed the actual recent spot market volatility.
1-month implied volatility rose from around 35% to 44%. During this decline, realized volatility also climbed from 27% to 39%. Both metrics trended upwards, but the increase in implied volatility was more aggressive, keeping the volatility risk premium (the difference between implied and realized vol) positive.
Following the breakdown, the market urgently repriced risk, causing the volatility spread to widen to as much as 10 percentage points. While this spread has since narrowed slightly, options prices remain higher than the level justified by actual price history. This reflects a widespread market expectation that significant volatility will continue in the future.
The uncertainty priced into the options market regarding the future significantly exceeds the risk evidenced by recent actual price movements, leading to a persistently high volatility risk premium.
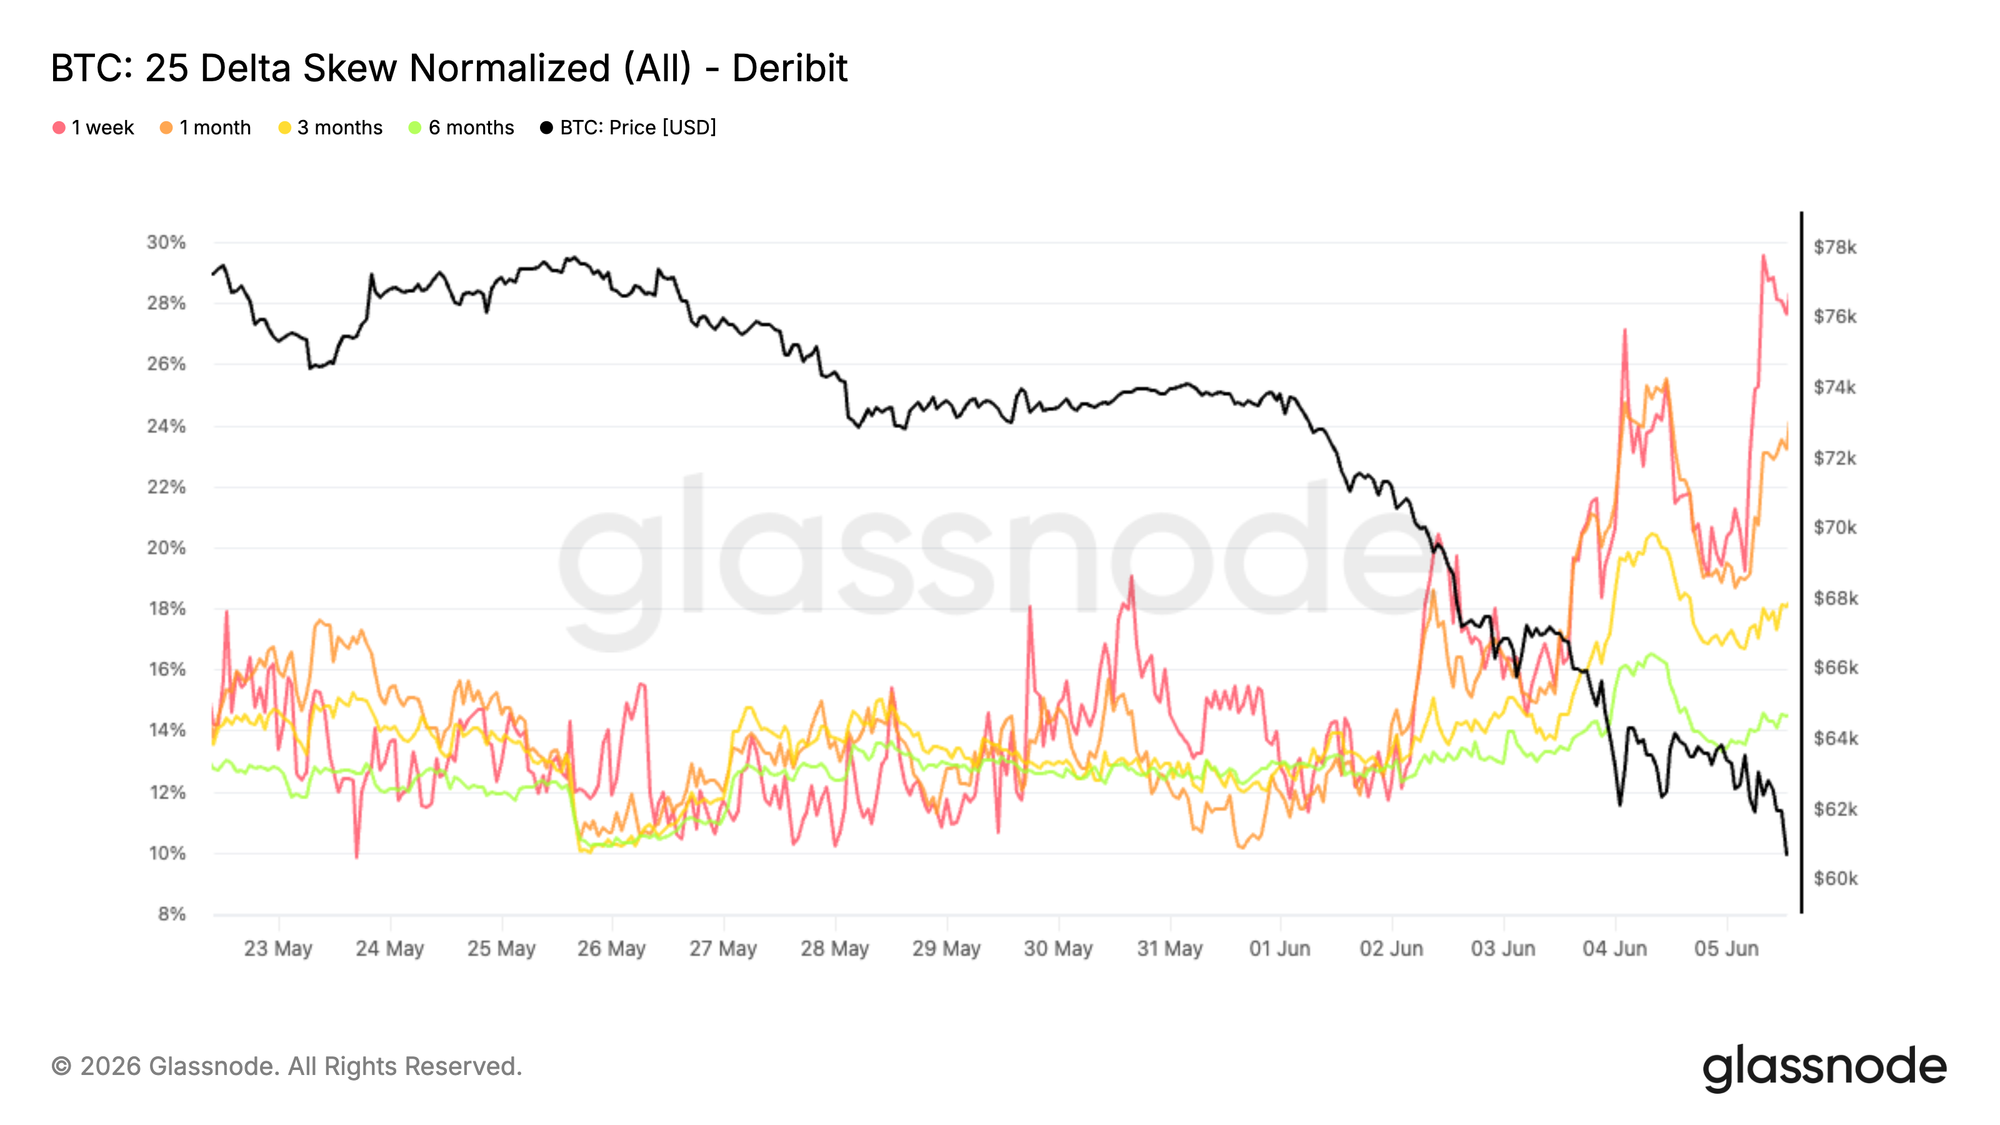
25-Delta Volatility Skew Surges
Within the broad increase in volatility premia, the volatility skew provides a clear picture of capital allocation. During the breakdown and subsequent decline towards February lows, traders concentrated their efforts on buying downside protection.
The volatility skew is calculated by subtracting call volatility from put volatility. A positive skew indicates that puts are more expensive than their equally-distant calls. This decline has caused skew across all tenors to rise collectively: 1-month skew climbed from around 11% to 24%, while 3-month and 6-month skews rose to 18% and 14%, respectively.
Short-dated skews reacted most intensely, with 1-week skew briefly approaching 30%. This highlights an urgent demand for short-term downside hedges during the sell-off. If the rise in implied volatilities signals market-wide risk alertness, the surge in skew points exclusively in one direction: capital flowing predominantly into bearish hedges.
As the market environment continues to weaken, the demand for downside protection has significantly strengthened, driving the premium traders are willing to pay for put options ever higher.
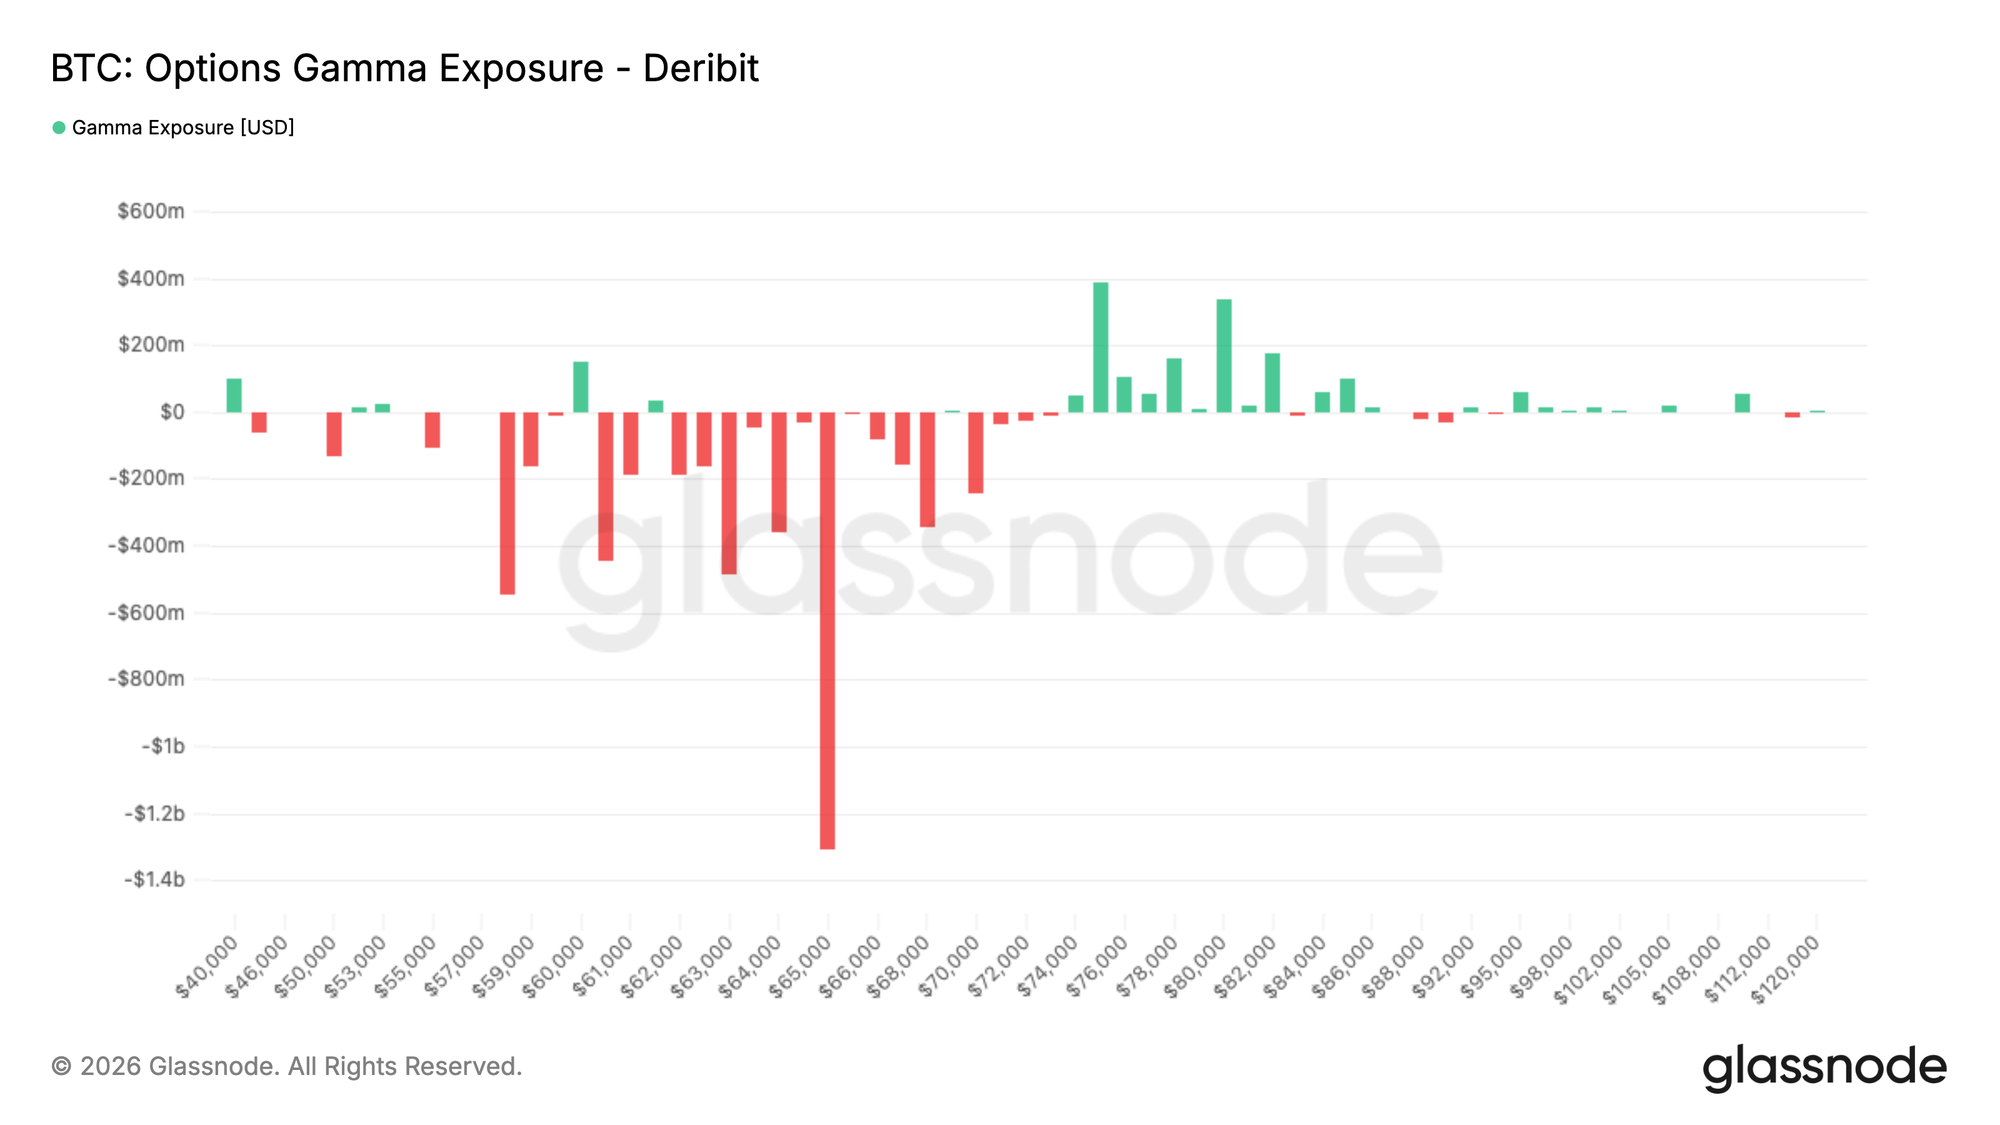
Significant Gamma Exposure Clustered Around $65,000
In addition to option prices, gamma exposure helps identify the strike prices where options market makers' hedging activity has the most significant impact on the underlying price action.
The current market trading style is broadly defensive. Over the past seven days, put options accounted for 32.4% of total options trading volume. In the last 24 hours, this proportion has further increased to 35.9%. Even after the significant decline, market activity remains focused on purchasing downside protection.
This trading behavior is directly reflected in the gamma exposure profile: the largest negative gamma exposure is currently concentrated around the $65,000 strike, with significant negative gamma also distributed across the $59,000 to $70,000 range. Bitcoin's current price, around $62,000, is situated just below the zone of peak short-dated negative gamma. Conversely, positive gamma exposure is primarily clustered at higher strikes, between $76,000 and $82,000.
Defensive trading dominates market maker positioning. The market's maximum negative gamma zone sits at the $65,000 level, which is remarkably close to the current spot price.
Summary
The current market displays classic characteristics of a late-stage bear market correction: deeply underwater recent entrants, persistently high levels of realized losses, and waning support from multiple core buying sources.
The decline towards $60,000 triggered a significant deleveraging event, leading to a concentrated liquidation of speculative positions. Leverage has reset to healthier levels, but effective new buying demand has failed to materialize in the spot market.
The options market maintains a defensive posture, characterized by elevated implied volatility, strong demand for downside hedges, and key dealer exposure positioned close to the current spot price. This, combined with declining institutional participation and reduced corporate treasury accumulation, strongly suggests that risk appetite remains deeply depressed.
Synthesizing the data, the market is progressively entering a phase of deep panic selling. While market leverage has largely been cleared and valuation metrics have reached historically deep discount levels, the incremental buying demand required to form a durable bottom, based on historical precedent, has yet to appear.


