Bitcoin consolidates as uptrend continues, HYPE momentum divergence test imminent | Special Analysis


- Core View: After a seven-segment rally on the daily chart, Bitcoin has entered a high-level range-bound consolidation phase, building momentum for the construction of a second upward consolidation zone. Medium-term positions should remain flat pending trend confirmation. HYPE's four-hour uptrend is currently in the departure leg of its second consolidation zone, and whether momentum divergence occurs will determine if the move concludes.
- Key Factors:
- BTC has staged a seven-segment rally since the July 1 low of $57,820. The first consolidation zone A is formed by the overlapping of three segments from (1-2) to (3-4), with the departure leg (4-5) concluding around the $81,500 level.
- The departure leg (4-5) shows stronger momentum than the entry leg (0-1), with no momentum divergence detected. However, the quantitative model has triggered a death cross and top warning signal, indicating the market has entered overbought territory.
- BTC is highly likely to enter a 2-3 week high-level sideways consolidation, building a second upward consolidation zone B within the range. Key resistance levels stand at $82,850, $84,500, and $90,000, while support is found at $73,500-$75,000 and $67,300-$69,100.
- HYPE has completed an 11-segment rally since the August 2 low of $51.11. The momentum comparison between the entry leg (78-79) and departure leg (82-83) of consolidation zone B is critical — if divergence appears, the probability of this rally concluding increases significantly.
- Last week's BTC short-term long position (1x leverage) was opened at $77,388 and closed at $80,836, yielding approximately 4.45% returns, validating the real-world effectiveness of the arbitrage trading model and momentum quantification model's conjoined signals.
Bitcoin extended its rebound structure that began from the July 1 low this week, with the daily chart forming a seven-segment upward move and completing the construction of its first consolidation zone (Consolidation Zone A). The market has now entered an adjustment and re-rebound phase following the confirmation of "Endpoint 5." Quantitative model top signals and overbought conditions suggest a high probability of a 2–3 week high-level range-bound consolidation in the short term, building momentum for the formation of the second upward consolidation zone (Consolidation Zone B). Mid-term positions should remain on the sidelines until trend effectiveness is confirmed, while short-term traders can flexibly execute Plan A and Plan B trial long/short setups based on the resonance between Chan Theory structure and proprietary quantitative model signals within the support/resistance ranges.
For HYPE, the 4-hour rebound initiated from the August 2 low has extended into the departure segment of the second consolidation zone (Consolidation Zone B). The key to subsequent price action lies in comparing the strength of this departure segment against the entry segment—whether momentum divergence emerges will determine if this upward move has concluded. Technical indicators are already showing overbought conditions, warranting caution against chasing highs.
Additionally, one BTC short-term long trade executed last week per the plan was successfully completed, realizing approximately 4.45% gains. This validates the effectiveness of the共振 signals from the "Spread Trading Model" and "Momentum Quantitative Model" in live trading. Detailed trade breakdown and review are provided at the end of this article.
Weekly Core Trading Insights Summary:
• BTC daily chart structure analysis (see Part 1 for details)
• BTC weekly outlook and medium/short-term trading strategies (see Part 2 for details)
• HYPE hourly-level structure analysis (see Part 3 for details)
• HYPE weekly outlook and short-term trading strategies (see Part 4 for details)
Market Validation of Last Week's Trading Strategy:
• BTC short-term trade performance: Last week, following our plan, we executed one short-term long trade (1x leverage), successfully realizing approximately 4.45% gains. (See Part 5 for details)
1. Bitcoin Daily-Level Structure Analysis
Last week's review introduced the Chan Theory analytical framework to systematically deconstruct and locate consolidation zones within BTC's rebound structure from the July 1 low of $57,820. This week, we continue with that framework, further analyzing the internal structure of this rebound from the perspectives of trend structure, consolidation zone evolution, and momentum divergence.
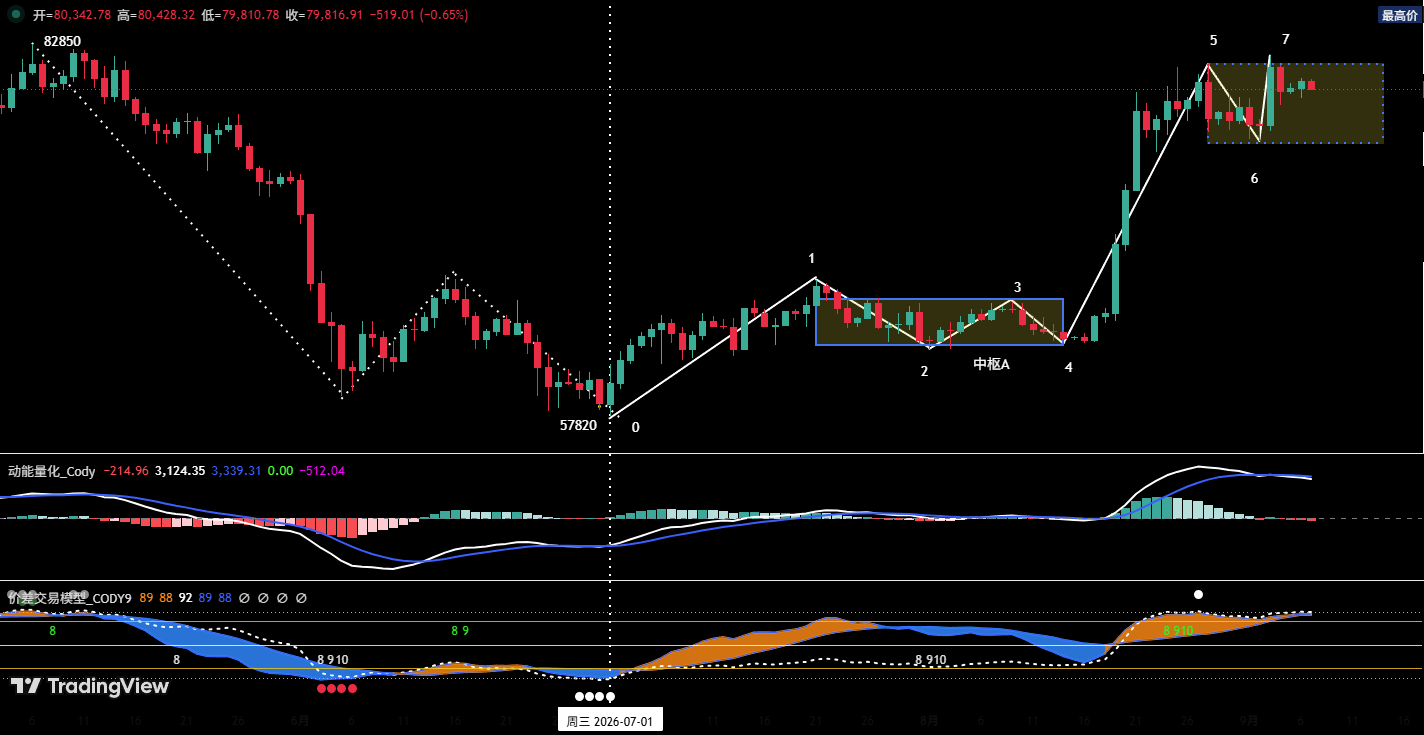
Chart 1: Bitcoin Daily K-Line Chart
1. As shown in Chart 1: Since the rebound from the July 1 low, a clear seven-segment upward structure (0-1) through (6-7) has emerged. Segments (1-2), (2-3), and (3-4) overlap to form the first upward consolidation zone (Consolidation Zone A) of this rebound, with its upward departure segment (4-5) confirming its conclusion around the $81,500 level.
2. Structural Assessment Based on Consolidation Zone A:
① The departure segment (4-5) shows significantly stronger rebound momentum than the entry segment (0-1), with no momentum divergence observed between the two.
② According to our proprietary quantitative model monitoring: The dual signal lines of the "Momentum Quantitative Model" have formed a bearish crossover, while the "Spread Trading Model" has simultaneously triggered a top warning signal (white dot in the chart). The resonance of both signals indicates the market has entered overbought territory.
③ Since the confirmation of "Endpoint 5," the market has exhibited an adjustment segment (5-6) and is currently in a rebounding segment (6-7).
3. High-Level Range-Bound Consolidation and the Construction of a Second Upward Consolidation Zone Is the Most Likely Scenario
Combining the above three points: Starting from "Endpoint 5," the market will likely enter a 2–3 week high-level range-bound consolidation pattern. Longs will use the wide-range oscillation to flush out profits accumulated during the earlier rapid advance and will randomly construct the second upward consolidation zone (Consolidation Zone B) within the box range. Once Consolidation Zone B is completed, another upward move departing from it is expected to commence.
2. Bitcoin Weekly Outlook and Trading Strategy
1. BTC Weekly Price Movement Forecast
Core view this week: The market is highly likely to enter range-bound consolidation, with close monitoring of where "Endpoint 7" concludes on the daily chart.
2. Key Resistance Levels
• First resistance zone: $81,700–$82,850 (previous key level)
• Second resistance zone: Around $84,500 (previous key resistance area)
• Third resistance zone: $90,000 area (key psychological round number)
3. Key Support Levels
• First support level: $73,500–$75,000 area (previous key support)
• Second support level: $67,300–$69,100 area (previous key support)
4. Trading Strategy This Week (excluding impact of unexpected news)
① Medium-term strategy:
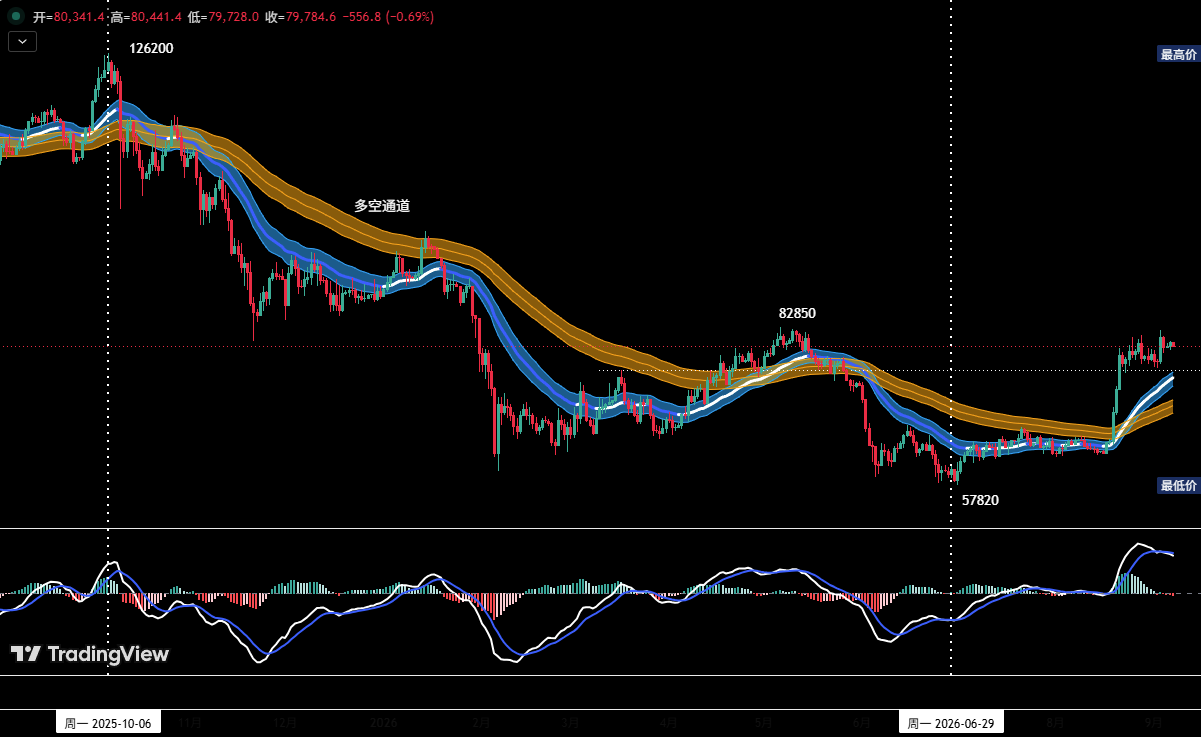
Chart 2: Bitcoin Daily K-Line Chart: (Position Monitoring Model)
Position Monitoring Model: As shown in Chart 2, the price has broken through the "Long/Short Channel," altering the short-term market structure. However, the post-breakout pullback confirmation phase is not yet complete, and the validity of a trend reversal remains unconfirmed. Given that the signal loop has not yet closed, medium-term positions remain at zero, maintaining a cash-only stance for now.
② Short-term strategy: Use 30% of capital with stop-losses in place, seeking "spread" opportunities based on support and resistance levels (trading on the 30-minute/60-minute timeframe).
③ To dynamically adapt to complex market evolution in short-term trading, we have prepared Plan A/B in advance.
• Plan A: Light trial long positions at strong support zones.
• Entry: When price pulls back to the first or second key support level mentioned above, shows clear stabilization patterns, and the quantitative model simultaneously issues a bottom signal, establish long positions of approximately 30%.
• Risk control: Set initial stop-loss.
• Exit: When price rebounds near key resistance levels combined with model signals, gradually close positions to lock in profits.
• Plan B: Light trial short positions at strong resistance zones.
• Entry: When price rises to the aforementioned key resistance levels, shows clear rejection patterns, and the quantitative model simultaneously issues a top signal, establish short positions of approximately 30%.
• Risk control: Set initial stop-loss.
• Exit: When price corrects near key support levels combined with model signals, gradually close positions to lock in profits.
3. HYPE Hourly-Level Structure Analysis
This week's review introduces the Chan Theory analytical framework to systematically deconstruct and analyze HYPE's rebound structure from its August 2 low of $51.11.
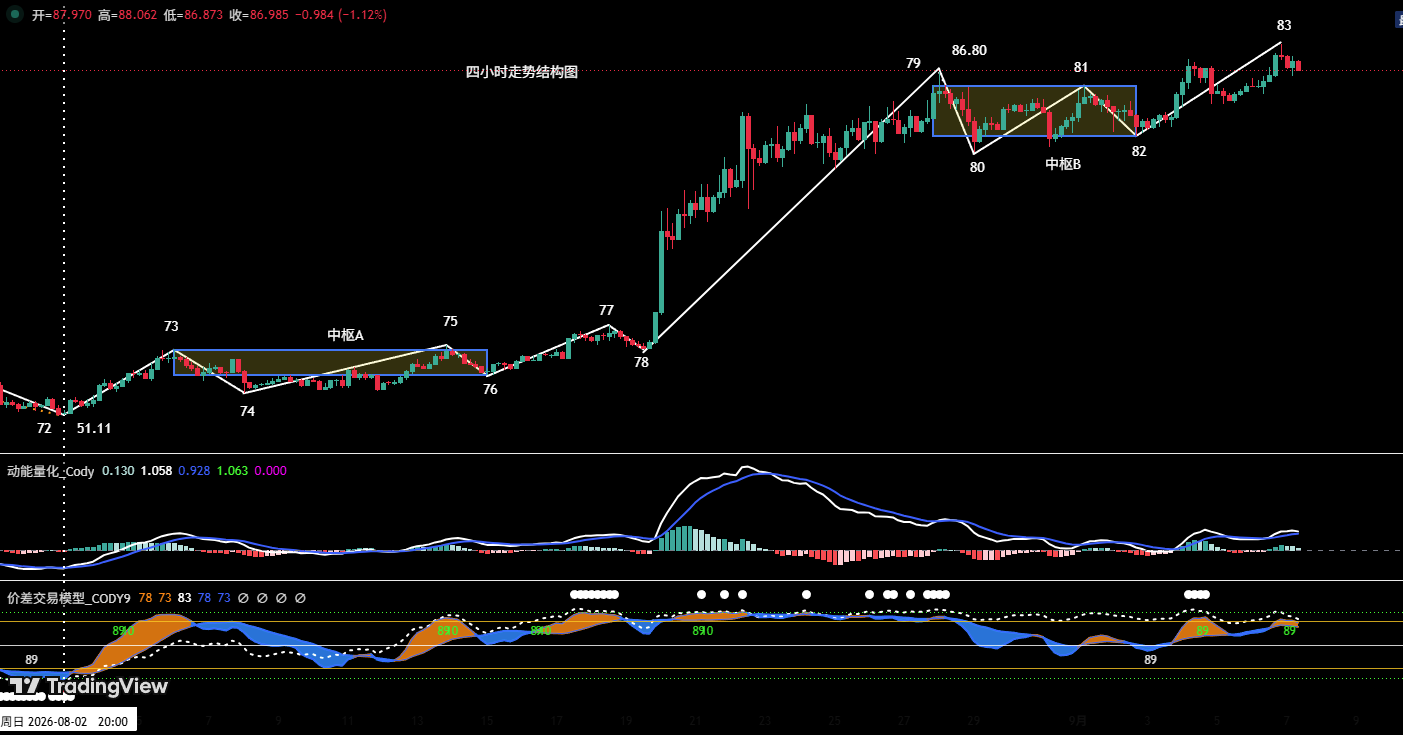
Chart 3: HYPE 4-Hour K-Line Chart
1. Overall Trend Structure Overview
As shown in Chart 3: HYPE's upward move from the August 2 low of $51.11 can be clearly divided into an 11-segment upward structure on the 4-hour timeframe, from (72-73) through (82-83).
2. Structural Assessment Based on Consolidation Zone A
• Consolidation Zone A formation: Segments (73-74), (74-75), and (75-76) overlap, forming the first upward consolidation zone (Consolidation Zone A).
• Momentum assessment: Comparing the upward momentum of the entry segment (72-73) with the departure segment (78-79) of Consolidation Zone A, the departure segment shows clearly stronger upward momentum than the entry segment, with no momentum divergence observed. Based on this assessment, after segment (78-79) concludes, price is expected to continue moving higher following a period of consolidation.
3. Structural Assessment Based on Consolidation Zone B
• Consolidation Zone B formation: Segments (79-80), (80-81), and (81-82) overlap, forming the second upward consolidation zone (Consolidation Zone B). For Consolidation Zone B, (78-79) serves as the entry segment, and (82-83) serves as the departure segment.
• Current positioning and forward projection: Price is currently trading within the departure segment (82-83). The key point going forward is comparing the upward momentum of this departure segment against the entry segment. If momentum divergence with the entry segment appears when the departure segment concludes, the probability that the current upward move originating from "Endpoint 72" has ended significantly increases. Conversely, if no divergence emerges, price is expected to extend its original uptrend after consolidation, potentially making new highs.
4. HYPE Weekly Outlook and Short-Term Trading Strategy
1. HYPE Weekly Price Movement Forecast
① Key resistance levels:
• First resistance level: Around $100
② Key support levels:
• First support level: $83–$85 area;
• Second support level: $77–$80 area;
③ Core view this week: Focus on where the departure segment (82-83) of Consolidation Zone B concludes, and compare its upward momentum against the entry segment (78-79) to determine whether momentum divergence is established.
2. HYPE Short-Term Trading Strategy This Week
① For holders (long positions): Those who entered around the $50–$52 area per the earlier trading plan should move their initial stop-loss up to approximately $80 to lock in accrued profits; strictly adhere to stop-loss discipline and hold for further upside.
② For those without positions: If price successfully stabilizes at the key $83–$85 support area and clear long signals emerge, consider light trial long positions, with stop-losses set and strictly enforced in tandem.
③ Risk warning: The recent consecutive advance has accumulated significant profit-taking pressure, and multiple technical indicators are in overbought territory. Therefore, chasing highs at current levels is strongly discouraged—remain vigilant against short-term pullback risk.
5. Bitcoin Short-Term Trade Review (08.31–09.06):
We strictly followed the trading plan and, based on signals from our proprietary "Spread Trading Model" and "Momentum Quantitative Model," executed one short-term long trade last week, realizing total trading profits of approximately 4.45%.
1. Short-Term Trade Record: (See Table 1)
Bitcoin Short-Term Trade Summary: (1x leverage)
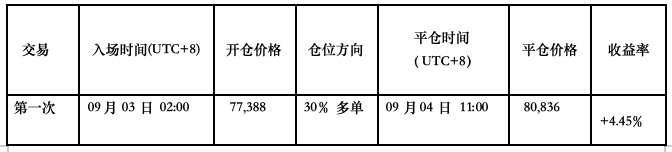
Table 1
2. Short-Term Trade Review: (See Chart 4)
• Entry strategy:
a. Price had previously completed a full corrective structure. When price declined to the area above $76,000, stabilization signals emerged, with the K-line forming a "bottom fractal" pattern;
b. The "Momentum Quantitative Model" generated a momentum bottom divergence signal, resonating with the "Spread Trading Model's" bottom reversal signal.
Based on the above multi-factor signal resonance, we established a 30% long position at $77,388.
• Exit strategy:
a. Price exhibited stagnation signals around $82,850, with the K-line forming a "top fractal" pattern;
b. The "Spread Trading Model" consecutively released top warning signals (white dots + green dots), followed by the signal band (blue) crossing below the horizon line (green), forming a top resonance signal with the "Momentum Quantitative Model."
Based on the above top resonance signals, we fully closed the position at approximately $80,836.
• Summary: This trade realized profits of approximately 4.45%.
3. Short-Term Trade Illustration
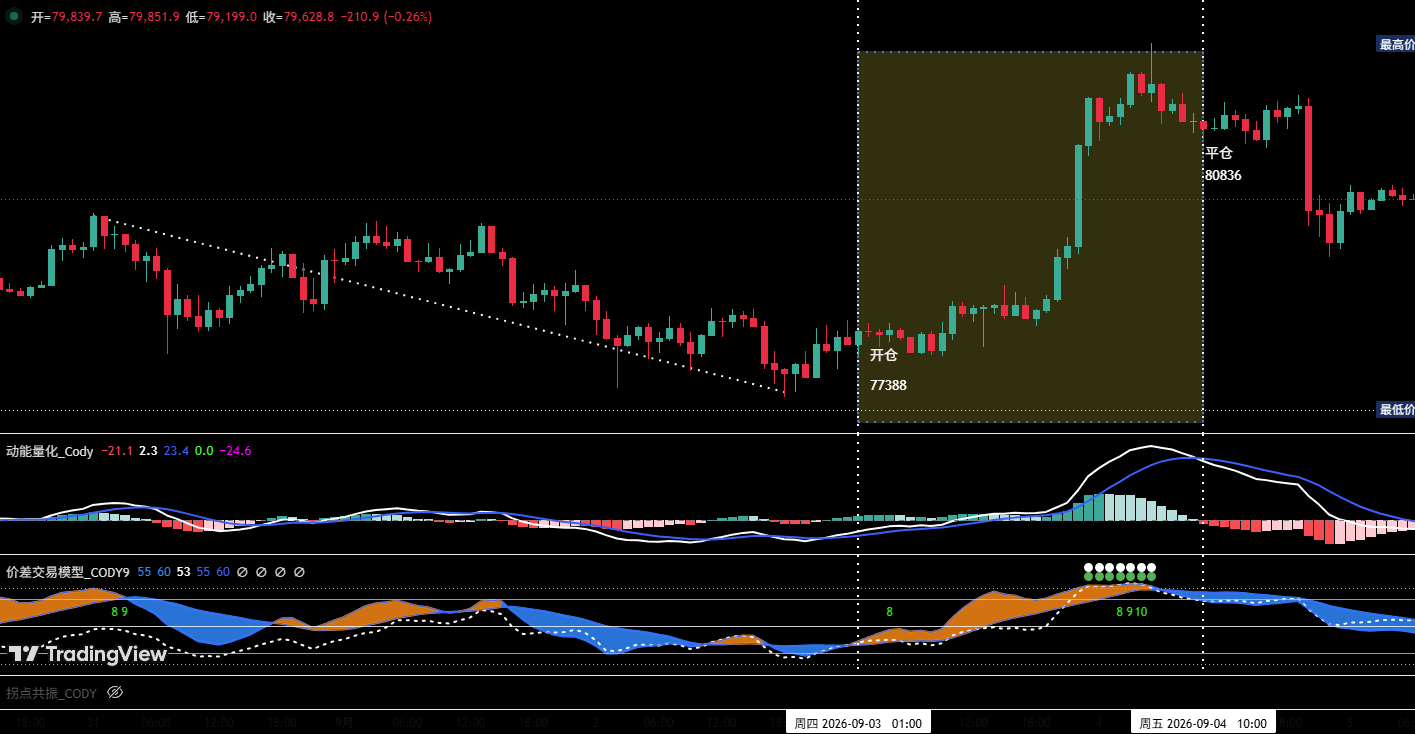
Chart 4: BTC 60-Minute K-Line Chart: (Momentum Quantitative Model + Spread Trading Model)
6. Special Reminders
1. On entry: Immediately set the initial stop-loss.
2. When profit reaches 1%: Move the stop-loss to the entry cost price (breakeven point) to protect principal.
3. When profit reaches 2%: Move the stop-loss to the 1% profit level.
4. Continuous tracking: Thereafter, for every additional 1% profit, move the stop-loss up by 1% in tandem, dynamically protecting and locking in gains.
Financial markets change rapidly, and all market analysis and trading strategies require dynamic adjustment. All views, analytical models, and trading strategies presented in this article originate from personal technical analysis and serve solely as personal trading logs. They do not constitute any investment advice or trading basis. Markets involve risk; invest with caution. Please do not make decisions based solely on this content.