
Bitcoin Monthly Adjustment Structure Confirmed, HYPE Presents Entry Opportunity | Special Analysis
- Core View: The monthly a-b-c three-wave adjustment structure for Bitcoin, which began from its October 2025 high, has been established. It is currently in the C-wave decline phase, with $60,000 acting merely as an intermediate stop rather than a bottom. After peaking at $75.87, HYPE has retraced 27% and entered a support area ready for positioning.
- Key Factors:
- Since the adjustment from its peak of $126,200, Bitcoin broke below $60,000 to $59,100 on June 5, confirming the initiation of the monthly C-wave decline. The cumulative adjustment is less than 35 days, and the structure is incomplete.
- This week, attention must be paid to the test results of two major pressure zones at $65,000 and $69,500-70,500, as well as the support area between $59,000 and $60,000, as these will be core indicators for judging subsequent price action.
- HYPE has retraced 27% from $75.87 to $55.47, confirming a short-term top; it is currently stabilizing and rebounding in the $55 area, with overhead resistance located at $62.5-$64.57.
- Technical analysis shows that Bitcoin's 4-hour chart presents a 10-segment adjustment pattern, including two descending consolidation zones. The rebound from the $60,000 level on February 6 is being redefined as Wave D or Wave C-2, not a trend reversal.
- The medium-term strategy maintains a bearish outlook, planning to initiate a 20% short position upon a rebound to $65,000, and increasing the position to 60% upon reaching the $69,500-$70,500 range. Short-term operations will focus on spread trading based on support levels.
In last week's newsletter, we explicitly stated that $60,000 was a relay node in this adjustment, not the bottom. This judgment was directly validated by the market on June 5th: the price broke below this level, hitting a low of $59,100. With this, the monthly-level a-b-c three-wave adjustment structure, which began from the high of $126,200 in October 2025, is fully established. The market is currently in the C-wave decline phase, having been in adjustment for less than 35 days, meaning the structure is far from complete.
This week, we will focus on tracking the rebound height and resistance performance: the two major resistance zones at $65,000 and $69,500~$70,500 will be the core observation windows for judging the subsequent trend.
Regarding HYPE, the top signal warned about last week has also been validated. The price has retraced a maximum of 27% from $75.87, entering a short-term positioning phase within the support zone this week. Strategically, the medium-term outlook remains bearish, waiting for a window to add positions after the rebound completes.
Summary of Core Trading Views for This Week:
• Multi-period trend structure analysis for BTC (Detailed in Part 1)
• BTC price forecast and medium/short-term trading strategies for this week (Detailed in Part 2)
• HYPE hourly-level trend structure analysis (Detailed in Part 3)
• HYPE price forecast and short-term trading strategies for this week (Detailed in Part 4)
Market Validation of Last Week's Trading Strategies and Core Views:
• Validation of BTC trend forecast: In last week's article, we pointed out that Bitcoin would maintain a volatile downward pattern after a weak rebound, with the short-term strategy primarily focusing on "selling on rallies." The current market trend has validated our previous forecast.
• Validation of HYPE trend forecast: In last week's article, we pointed out that HYPE faced multiple resistances near the $75.87 level, making the formation of a short-term top highly probable. The current market trend is highly consistent with our forecast.
1. Analysis of Bitcoin's Multi-Period Trend Structure
Analysis of BTC Daily-Level Trend Structure (Based on the trend since the low on Feb 6, 2026)
Bitcoin _ Daily K-line Chart: 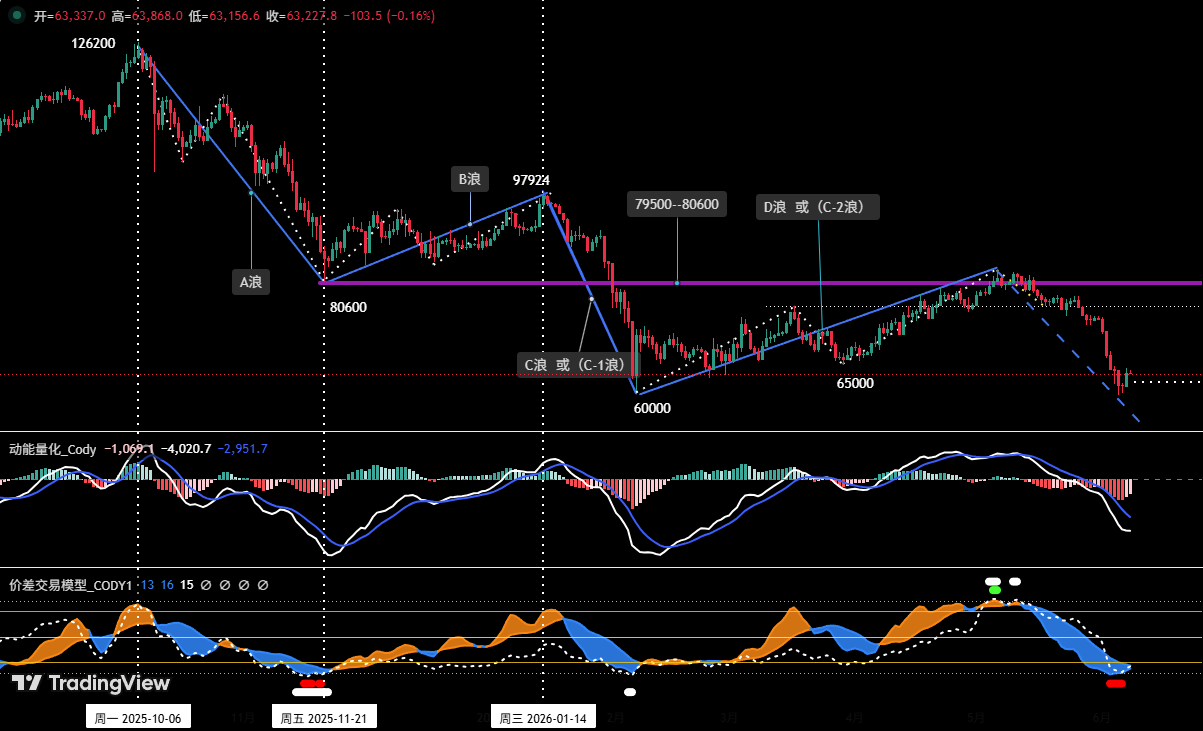
Figure 1
1. Dynamic Analysis of Bitcoin Market Structure Based on Elliott Wave Theory (Re-evaluating key turning points since the Oct 2025 high)
As shown in (Figure 1), after reaching an all-time high of approximately $126,200 in October 2025, the Bitcoin market entered a deep adjustment phase. In early February 2026, the price hit a low of $60,000 on February 6th, following which it began a rebound that lasted around 90 days. During this period, intense debate centered on whether the $60,000 level was the end of this adjustment or just a relay low. Our analysis consistently leaned towards the latter, identifying it as a temporary low rather than the final bottom. We believed the upward move starting February 6th was a rebound within a larger correction structure, not a trend reversal, and that the subsequent adjustment would still break below the $60,000 level.
Below is a review of the evolution based on the technical analysis framework:
①. Initial Characterization (Mid-February): Corrective rebound within Wave C (i.e., Wave C-2)
In the weekly review dated February 16th, we explicitly stated that the upward move from the Feb 6 low was, in nature, a "C-2" wave oversold rebound within the larger "Wave C" correction structure. This would be followed by a "C-3" wave decline, making a break below $60,000 highly probable.
②. Mid-Course Correction (Late April): Reclassification of the Wave Structure
In the weekly review dated April 20th, we considered that with the extension of the rebound in both time and space, by April 19th, this rally had lasted approximately 73 days, far exceeding the 54-day "Wave B" rebound. Therefore, we reclassified this rally as a larger-scale "Wave D rebound." This would be followed by a "Wave E" decline, which would most likely break below the $60,000 support.
③. Later Upgrade (Mid-May): Re-evaluating the Adjustment Degree
In the weekly review dated May 18th, we re-emphasized that by May 17th, this rebound had been running for about 100 days, its time span approaching the cycle from the $126,200 high to the $60,000 low (about 122 days). This led us to judge that the entire adjustment pattern was highly likely to be upgraded to a monthly-level correction. Consequently, we reclassified the wave structure.
④. Summary: This entire analysis process has been a dynamic tracking of the evolution of market structure. Throughout this period, we have consistently treated the $60,000 level as a critical relay point within a major adjustment process, not the final bottom of this bear cycle. As of now, with the price breaking below the key support at $60,000 on June 5th to touch a low near $59,100, the overall market trend has validated our earlier judgment regarding this break.
2. Wave Classification of BTC Based on Monthly-Level Trend Structure
Bitcoin _ Monthly K-line Chart: 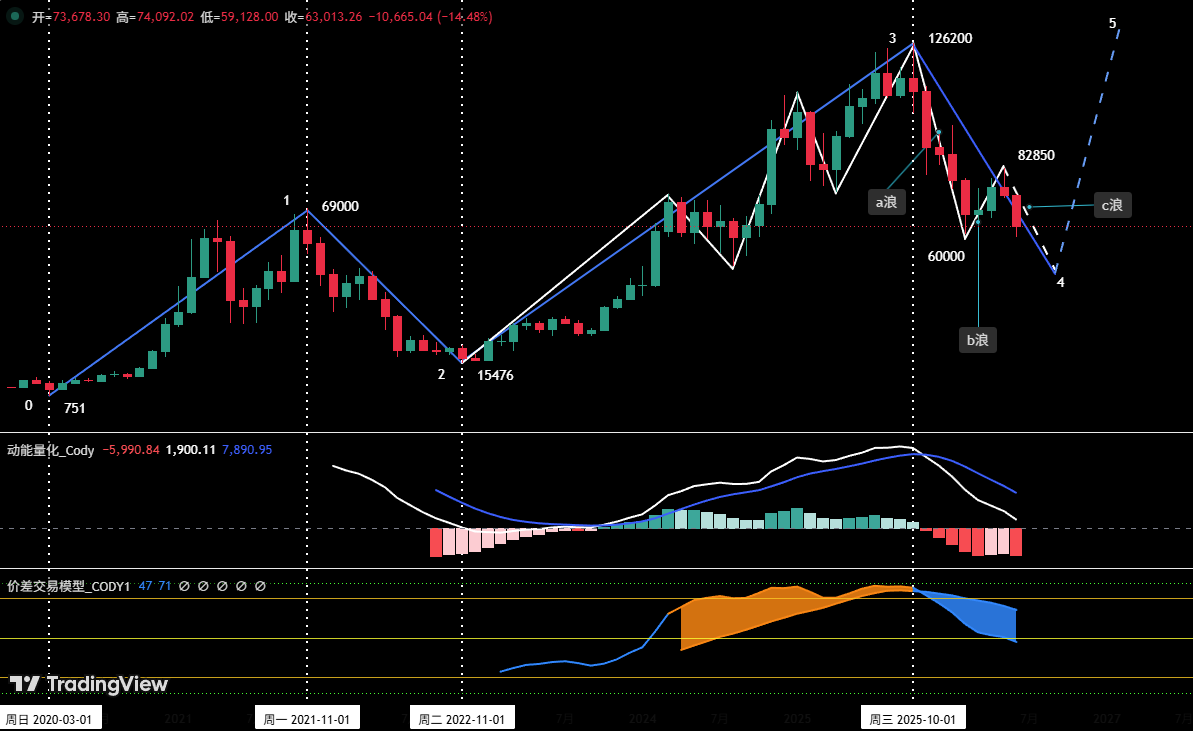
Figure 2
①. The BTC monthly chart shows: from January 1, 2017, to the present (only this segment of complete trading data is captured), it can be divided into a 4-segment structure;
• Segment 0-1 (Uptrend): From $751 (2017-01-01) to $69,000 (2021-11-10), lasting approximately 59 months (about 1774 days).
• Segment 1-2 (Correction): From $69,000 (2021-11-10) to $15,476 (2022-11-21), lasting approximately 13 months (about 376 days). The maximum drawdown during this period was approximately 77.57%.
• Segment 2-3 (Uptrend): From $15,476 (2022-11-21) to $126,200 (2025-10-06), lasting approximately 35 months (1050 days). This was the main uptrend that set a new all-time high, with a maximum gain of approximately 715.46%.
• Segment 3-4 (Correction): From $126,200 (2025-10-06) to present, running for about 8 months (approx. 243 days), with a maximum drawdown of 53.17% so far.
②. As shown in (Figure 2), the correction that began from the previous high of $126,200 (i.e., Segment 3-4) can be preliminarily identified as a monthly-level a-b-c three-wave correction structure. The market is currently in the C-wave decline phase.
• Wave a (Downward Wave): $126,200 (2025-10-06) to $60,000 (2026-02-06), lasting about 4 months (approx. 122 days), with a maximum drawdown of approximately 52.5%.
• Wave b (Rebound Wave): $60,000 (2026-02-06) to $82,850 (2026-05-06), lasting 3 months (about 90 days), with a maximum gain of approximately 38.1%.
• Wave c (Downward Wave): $82,850 (2026-05-06) to present, running for 33 days. During this period, on June 5th, the price broke below the $60,000 support, hitting a low near $59,100. This breakdown confirms the validity of Wave C (downward wave).
In-depth Analysis of BTC Hourly-Level Trend Structure (Using 4-hour as the analysis cycle)
Bitcoin _ 4-hour K-line Chart 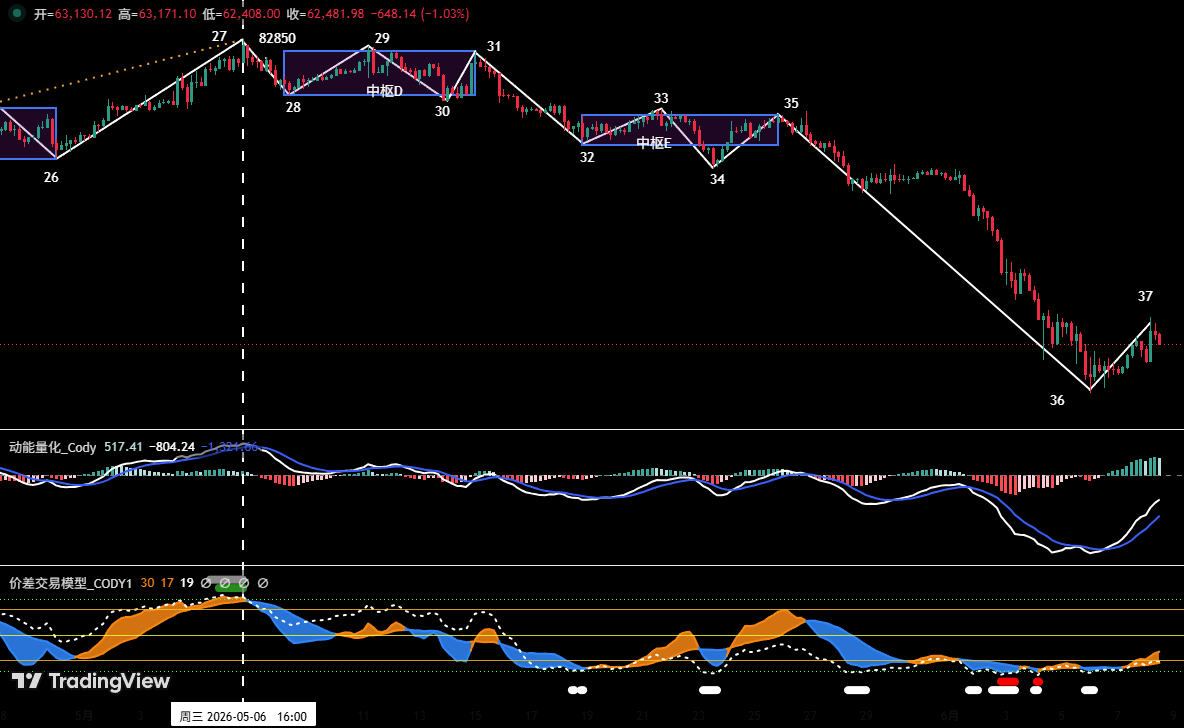
Figure 3
①. As shown in (Figure 3), the correction since the high of $82,850 on May 6th can be subdivided into a 10-segment structure on the 4-hour chart. This includes two descending centers: Center D and Center E. The overall structure is clear, presenting a typical complex correction pattern.
②. From the perspective of the 4-hour trend structure, the market is currently running in the 36-37 rebound segment. The first resistance above is near the $65,000 level; the significant resistance lies in the $69,500~$70,500 zone.
2. Current Operational Judgment for Bitcoin
1. BTC Price Trend Forecast for This Week:
Core Views for This Week:
• Monitor the test results of the resistance zones near $65,000 and the $69,500~$70,500 area by both bulls and bears.
• Also, pay attention to the support effect when the price retests the $59,000~$60,000 zone.
2. Key Resistance Levels:
• First Resistance Zone: Near $65,000 (Previous major low)
• Second Resistance Zone: $69,500~$70,500 (Previous high-volume consolidation zone)
3. Key Support Levels:
• First Support Zone: $59,000~$60,000 (Previous key support level)
• Second Support Zone: Near $55,000 (Previous key support level)
4. Trading Strategy for This Week (Excluding sudden news events)
①. Medium-term Strategy:
Bitcoin _ Daily K-line Chart: (Position Monitoring Model) 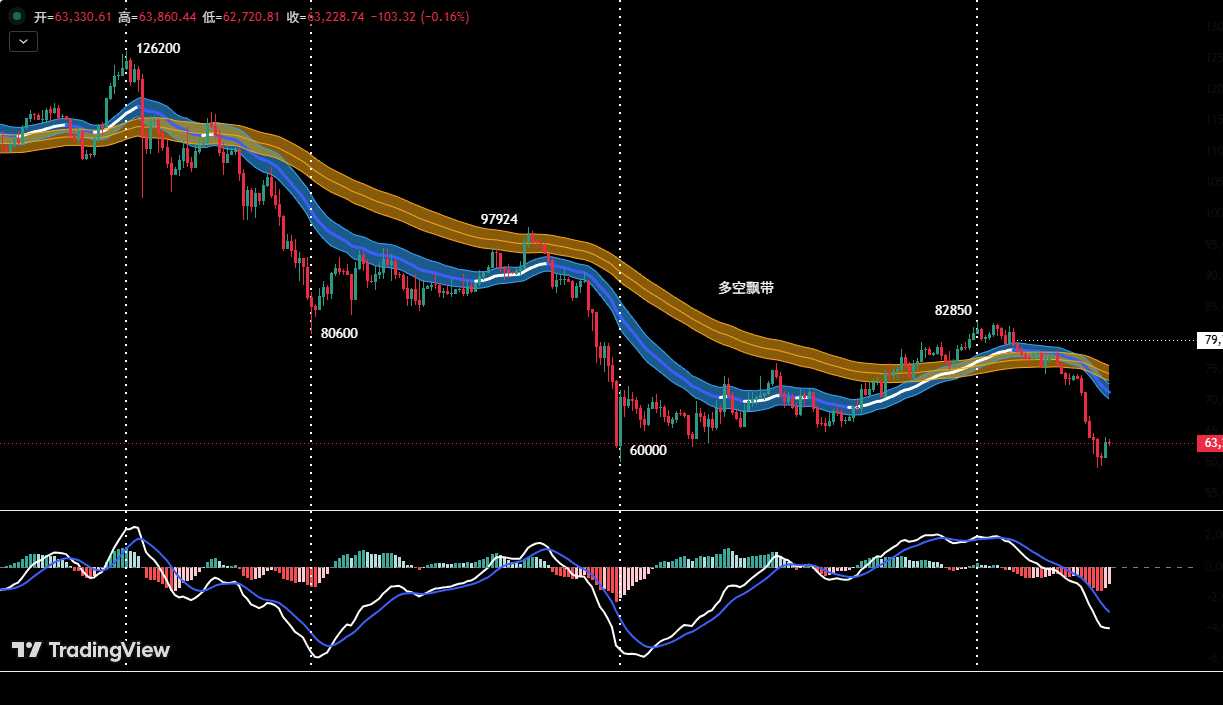
Figure 4
Position Monitoring Model: As shown in (Figure 4), the current price has effectively broken below the "Bull-Bear Channel," confirming a technical transition to a bearish-dominant格局. Last week, the market experienced a one-sided, sharp decline without significant resistance, and intraday rebound momentum was lacking. This market condition does not meet our established principles for initiating medium-term trend-following positions, so we maintain a medium-term cash position on the sidelines.
If a technical rebound occurs this week, short positions can be gradually established according to the following three-tier strategy:
• Weak Rebound Short: If the price rebounds and shows signs of stagnation near $65,000, a 20% medium-term short position can be initiated.
• Add on Strong Resistance: If the price rebounds further and shows clear signs of resistance in the $69,500~$70,500 zone, the medium-term short position can be increased to 60%.
• Breakdown Short: If the price falls back after a failed rebound near $65,000 and effectively breaks below the $59,000~$60,000 support range, follow the trend and add to the short position to 60%.
②. Short-term Strategy: Utilize 30% of capital, set a stop-loss, and look for "spread" opportunities based on support and resistance levels (using 30-min/60-min charts as the operating cycle).
③. For short-term operations, to dynamically adapt to complex market developments, we have prepared two specific operational plans (A/B) in advance.
• Plan A: Sell on rallies when encountering resistance.
• Entry: If the price rebounds to near $65,000 and shows stagnation signals, combined with a top signal from quantitative models, establish a 15% short position.
• Risk Management: Set an initial stop-loss.
• Exit: When the price adjusts near a key support level and combined with model signals, gradually close the position for profit.
• Plan B: Add to position in the strong resistance zone.
• Add Position: If the price rebounds further to near $69,500~$70,500 and shows stagnation signals, combined with a top signal from quantitative models, increase the short position to 30%.
• Risk Management: Set an initial stop-loss.
• Exit: When the price adjusts near a key support level and combined with model signals, gradually close the position for profit.
• Plan C: Effectively break below support, sell short following the trend.
• Entry: If the price falls back after a failed rebound near $65,000 and effectively breaks below the $59,000~$60,000 support range, combined with a model top signal, increase the short position to 30%.
• Risk Management: Set an initial stop-loss.
• Exit: When the price declines to a key support level and combined with model signals, gradually close the position for profit.
3. Analysis of HYPE Hourly-Level Trend Structure:
HYPE_4-hour K-line Chart 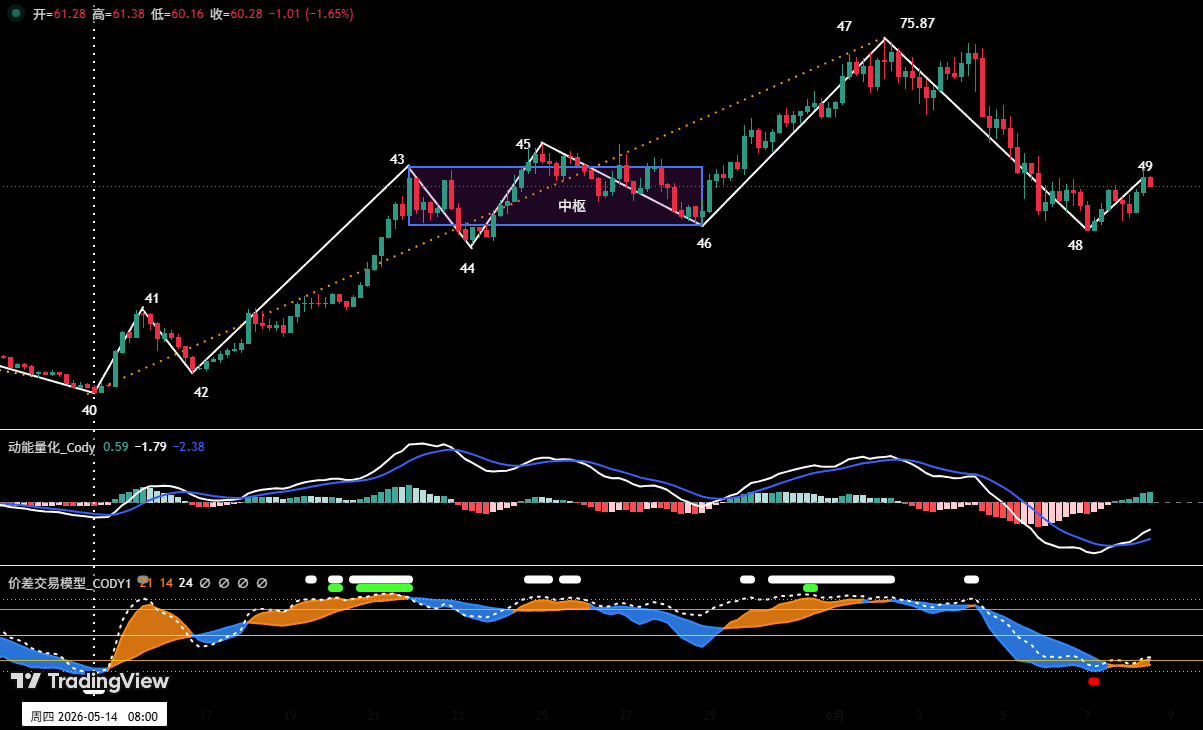
Figure 5
1. As shown in (Figure 5), on the 4-hour timeframe, HYPE's move from a low of $38.14 on May 14th to a high of $75.87 on June 2nd has clearly formed a seven-segment structure containing an "ascending center."
2. As warned in last week's review: because "Endpoint 47" exhibited a momentum divergence (bearish), compounded by a top warning signal from the "Spread Trading Model," this formed a resonance. Therefore, the probability of forming a short-term top here was high. The market trend has confirmed this judgment: the price adjusted from "Endpoint 47" ($75.87) to "Endpoint 48" ($55.47), a maximum decline of 26.89%.
3. Currently, HYPE's price has stabilized and started to recover from the support zone of $55, and is in the process of the 48-49 rebound. Upward pressure lies in the $62.5 to $64.57 zone. If the price rebounds to this level and falls under pressure, it will continue to seek stronger support lower.
4. HYPE Price Forecast and Short-term Trading Strategy for This Week (06.08~06.14)
1. HYPE Price Trend Forecast for This Week:
①. Key Resistance Levels:
• First Resistance Zone: $62.5 - $64.57;
• Second Resistance Zone: $68 - $70;
②. Key Support Levels:
• First Support Zone: $55 - $57;
• Second Support Zone: $47 - $49;
Core Views for HYPE This Week:
• Observe the test results of price at resistance and support levels.
2. HYPE Short-term Trading Strategy for This Week (Buying on Dips at Support)
This week, HYPE short-term trading should follow the strategy of "deploying on dips, avoiding chasing rallies."
Short-term Strategy: Try buying when the price stabilizes in the support zone.
When HYPE's price retests the key support zone of $55-$57 or the deeper zone of $47-$49, and shows signs of stopping and stabilizing, combined with bottom signals triggered by the two major models, consider opening small long positions. Position size must be strictly controlled below 30%, and stop-loss discipline must be adhered to.
5. Special Reminders:
1. Position Entry: Immediately set an initial stop-loss.
2. Profit Reaches 1%: Move the stop-loss to the entry cost price (break-even point) to ensure capital safety.
3. Profit Reaches 2%: Move the stop-loss to the 1% profit level.
4. Continuous Tracking: For every subsequent 1% increase in profit, move the stop-loss up by 1% to dynamically protect and lock in profits.
Financial markets change rapidly, and all market analysis and trading strategies require dynamic adjustment. All views, analysis models, and operational strategies mentioned in this article are derived from personal technical analysis. They serve solely as a personal trading journal and do not constitute any investment advice or operational basis. Markets involve risk, and investment requires caution. Do not make decisions based solely on this information.


