






BTC Consolidates in a Range, HYPE's Daily Rebound Confirmed | Special Analysis


- Core View: This week, the market focuses on two key validation points: whether BTC's daily adjustment can stabilize above $60,950, and whether HYPE can effectively hold the $58–$58.5 resistance zone to form a departure segment from the consolidation zone. The technical structure indicates that BTC's adjustment is nearing its end, while HYPE's rebound momentum remains to be confirmed.
- Key Elements:
- BTC's daily chart shows a seven-wave adjustment structure. Since the rebound from the July 1 low of $57,820, there are three potential paths: continuation of the c-wave rebound (targeting $67,300), a breakout after consolidating in the $60,950–$65,500 range, or a break below support leading to a second bottom test. Quantitative models suggest the first two scenarios are more likely.
- On the 4-hour chart, BTC's adjustment has completed a five-wave structure; if it makes a new low, it would extend to seven waves. The current price is resonating with the strong support zone of $60,950–$61,500, significantly increasing the probability of the adjustment concluding.
- BTC Strategy: Medium-term short positions are at approximately 20%. If the price effectively breaks above $67,300 and shows signs of stagnation upon rising to the $69,500–$71,000 zone, positions can be increased to 50%. For short-term trading, two plans (A and B) are set up to address shorting at strong resistance zones and testing longs at strong support zones, respectively.
- HYPE initiated a daily rebound from the August 2 low of $51.11, displaying a five-wave upward structure on the 4-hour chart. Three overlapping waves form the upward consolidation zone, and the price is currently in the (76-77) rebound segment.
- Key HYPE Observation: If it effectively holds the $58–$58.5 resistance zone, the (76-77) segment will constitute the departure segment from the consolidation zone, requiring a comparison of momentum divergence between the entry and departure segments. If it breaks below, the consolidation zone will extend with oscillation. Key support levels are $50–$52 and $45.
- Risk Management Note: Set an initial stop-loss immediately upon opening a position. When profit reaches 1%, move the stop-loss to breakeven; when profit reaches 2%, move it to the 1% profit level. Thereafter, for every 1% increase in profit, the stop-loss moves up by 1%, dynamically locking in profits.
This week, the market is at a critical structural validation stage: whether BTC's daily pullback can stabilize above the $60,950 level, and whether HYPE can effectively hold above the $58–$58.5 resistance zone to form a departure segment from the consolidation zone, are the two core observation points that will determine the direction of the subsequent market movement. Below are this week's core viewpoints and detailed technical analysis.
Summary of this week's core trading viewpoints:
- BTC multi-timeframe trend structure analysis (detailed in Part 1)
- BTC this week's market forecast and medium/short-term trading strategy (detailed in Part 2)
- HYPE hourly trend structure analysis (detailed in Part 3)
- HYPE this week's market forecast and short-term trading strategy (detailed in Part 4)
Market validation of last week's trading strategy and core viewpoints:
- BTC market analysis validation: Last week's article emphasized that the probability of the daily short-term pullback concluding above the $60,900–$61,500 zone is relatively high. Currently, the actual market movement aligns with our forecast.
- HYPE market analysis validation: Reviewing last week's article: at the intersection of triple technical supports (long-term ascending trendline, lower boundary of the short-term descending channel, and the $50–$52 zone), the probability of forming a daily-level rebound was significant. The current market movement is highly consistent with our analysis.
I. Bitcoin Multi-Timeframe Trend Structure Analysis
1. Bitcoin daily-level trend structure analysis: (based on price action after May 6)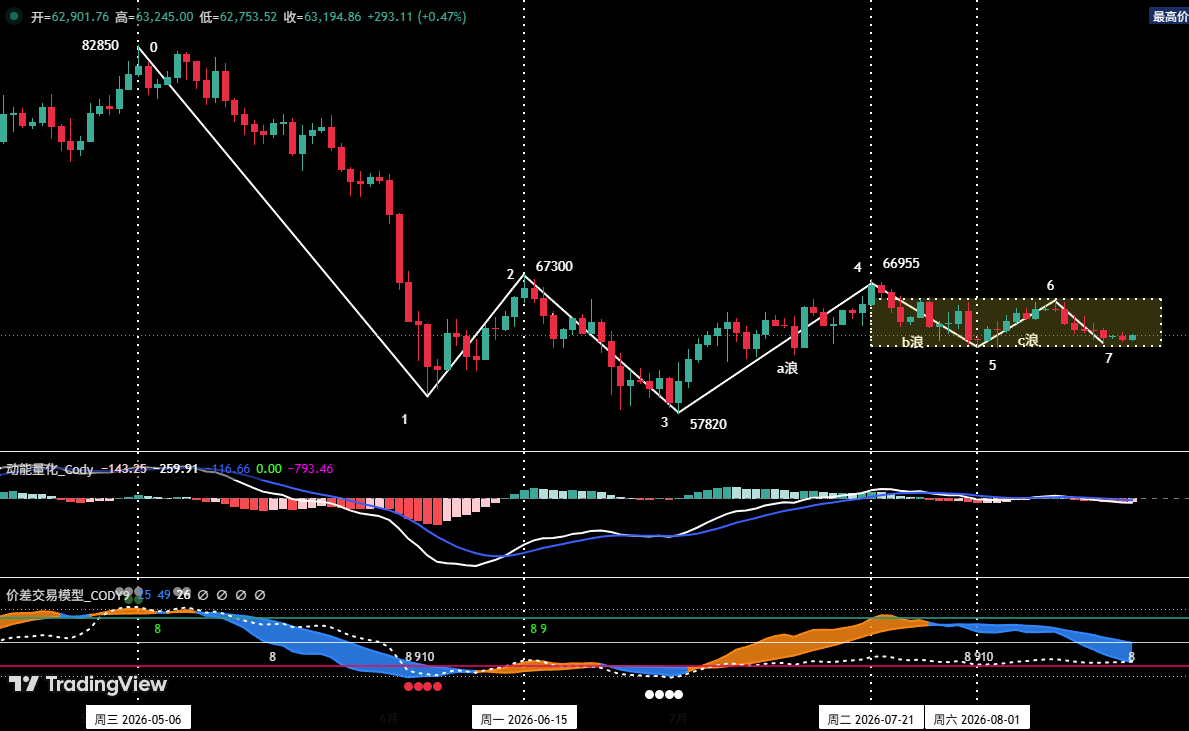
Figure 1: BTC Daily Candlestick Chart
①. As shown in (Figure 1): Since the pullback that began from the May 6 high of $82,850, the daily chart has displayed a seven-segment adjustment structure: (0-1), (1-2), (2-3), (3-4), (4-5), (5-6), and (6-7).
②. Daily structure analysis: Based on the rebound from the July 1 low of $57,820, the future market may evolve along the following three possible paths:
Path 1: Maintaining the previous view, extending the daily wave-c rebound. Assuming the daily wave-b adjustment concluded at the August 1 low of $62,268, the current price action is in the wave-c rebound phase. The primary target for this path is the $67,300 resistance zone; if a valid breakout occurs, the next target would be the $69,500–$71,000 zone.
Path 2: Range-bound consolidation followed by a breakout. The price finds support above $60,950, maintaining a $60,950–$65,500 box range (building an accumulation/an upward continuation structure). Once this structure is complete, the price breaks above the upper boundary of the box, retesting the key $67,300 resistance.
Path 3: Breakdown leading to a second bottom test. If the price validly breaks below the strong support zone of $60,950–$61,500, the market will initiate a process of retesting the lows.
③. Based on our proprietary quantitative model, the probability of the market following the first two paths is higher.
2. In-depth analysis of Bitcoin's hourly trend structure (using the 4-hour chart as the analysis timeframe):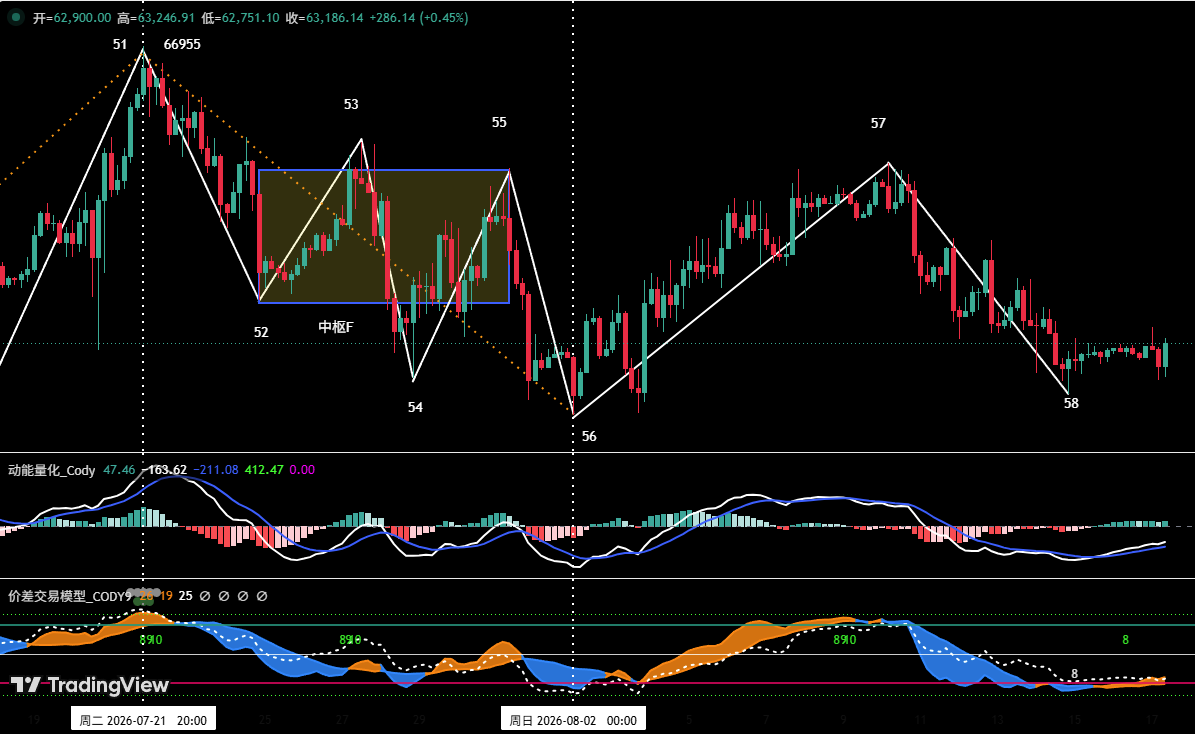
Figure 2: BTC 4-Hour Candlestick Chart
①. The daily adjustment that began from the July 21 high of $66,955 can be clearly broken down on the 4-hour chart into seven segments, from (51-52) to (57-58).
②. Based on the 4-hour framework analysis, the adjustment that began from "Point 51" (approximately $69,550) and extended to "Point 56" (approximately $62,268) has already displayed a complete five-segment structure. If subsequent "Point 58" falls below "Point 56", the adjustment would extend to a seven-segment structure. Considering both the trend structure and the extent of adjustment, this phase of correction is nearing its conclusion. The current price is resonating with the strong support zone of $60,950–$61,500, significantly increasing the probability that the adjustment concludes above $60,950.
II. BTC This Week's Market Forecast and Trading Strategy
1. BTC this week's price forecast:
Core viewpoint for the week: Closely monitor whether the daily adjustment can stabilize and hold above $60,950.
2. Key resistance levels:
•First resistance zone: Around $65,500 (Previous key resistance zone)
•Second resistance zone: Around $67,300 (Previous key resistance zone)
•Third resistance zone: $69,500–$71,000 area (Previous key resistance zone)
3. Key support levels:
•First support level: Around $62,268 (Previous key support level)
•Second support zone: $60,950–$61,500 area (Previous key support zone)
•Third support level: Around $57,820 (Previous key support level)
4. This week's trading strategy (excluding impacts from unexpected news)
①. Medium-term strategy: 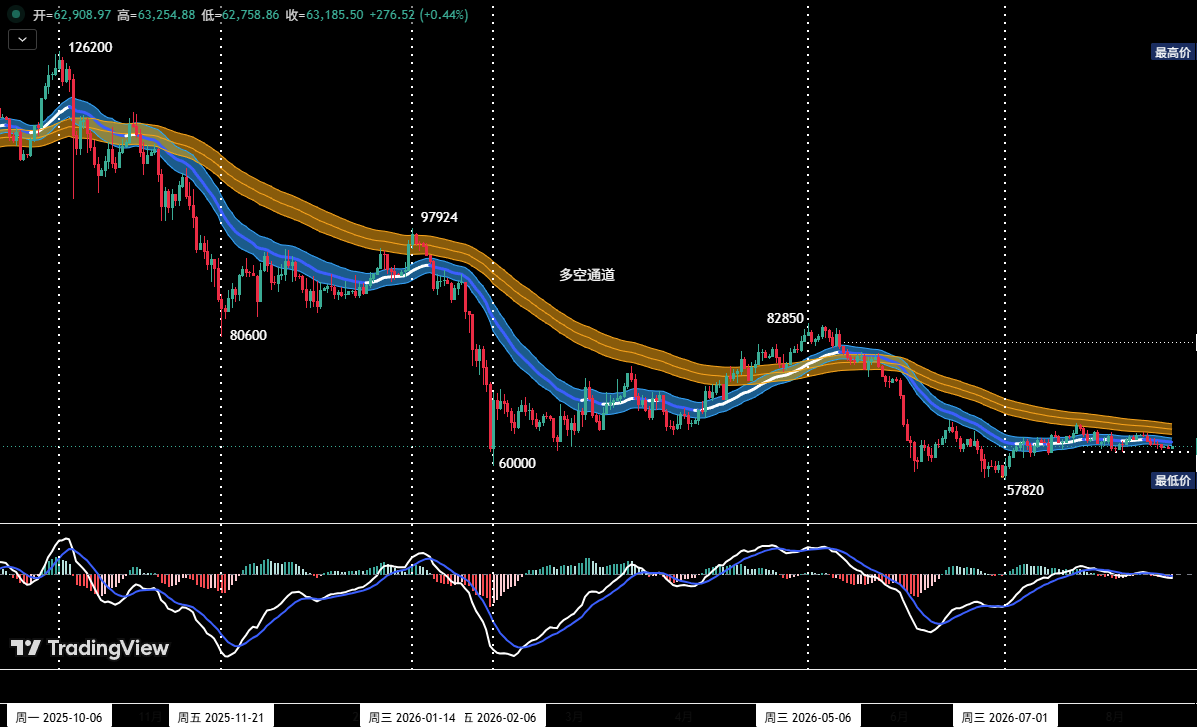
Figure 3: BTC Daily Candlestick Chart: (Position Monitoring Model)
Position monitoring model: As shown in (Figure 3), the current price has validly broken below the "Bull/Bear Channel," confirming a structural shift to a bearish-dominant market. The current medium-term short position is approximately 20%.
•If the price validly breaks through the $67,300 resistance this week, continues to rally into the $69,500–$71,000 zone, shows clear signs of stalling (loss of upward momentum), and the quantitative model simultaneously issues a short signal, the medium-term short position will be increased to 50%.
②. Short-term strategy:
Utilize 30% of the position, set stop-loss orders, and look for "spread" trading opportunities based on support and resistance levels (using the 30-minute/60-minute charts as the operating timeframe).
③. For short-term operations, to dynamically respond to the market's complex evolution, we have pre-defined two specific operational plans (A/B).
•Plan A: Tentative shorting at strong resistance zones.
•Entry: If the price validly breaks above the $67,300 resistance this week and rallies into the $69,500–$71,000 zone showing clear stalling signals, combined with signals from the quantitative model, a short position of approximately 30% can be established.
•Risk Management: Set an initial stop-loss.
•Exit: When the price pulls back to significant support levels, combined with signals from the quantitative model, gradually close the position to lock in profits.
•Plan B: Light long position near strong support zones.
•Entry: If the price shows signs of stabilization and holding above the $60,950–$61,500 zone, combined with bottoming signals from the quantitative model, a long position of approximately 15% can be established.
•Risk Management: Set an initial stop-loss.
•Exit: When the price rebounds to significant resistance levels, combined with model signals, gradually close the position to lock in profits.
III. HYPE Hourly Trend Structure Analysis
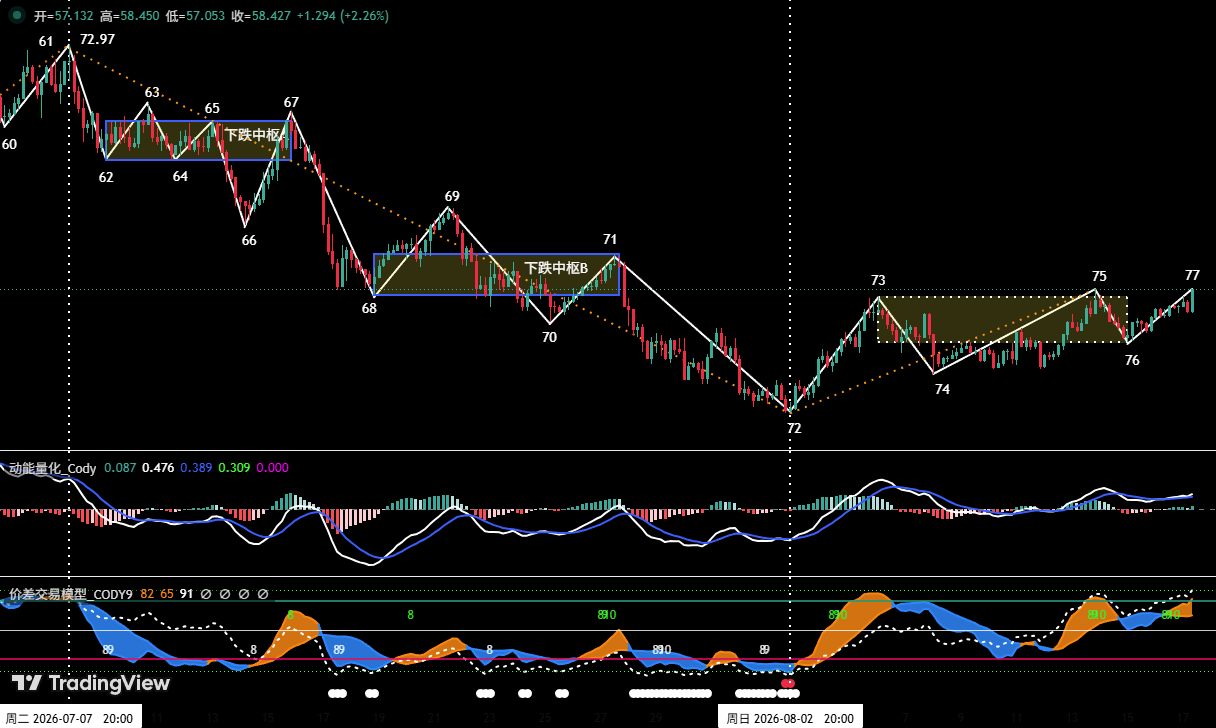 Figure 4: HYPE 4-Hour Candlestick Chart
1. As shown in (Figure 4): HYPE initiated a daily-level rebound from the August 2 low of $51.11. On the 4-hour chart, this is clearly divided into a five-segment upward structure from (72-73) to (76-77). Among these, segments (73-74), (74-75), and (75-76) have overlapping ranges, forming an upward consolidation/continuation structure.
2. The market is currently running the (76-77) rebound segment. The subsequent market may evolve in two possible ways:
Scenario 1: Formation of a departure segment from the consolidation zone. If the price can validly break through and hold above the $58–$58.5 resistance zone and continue to rebound, then (76-77) will constitute the departure segment from the consolidation zone. At that point, it is necessary to compare the momentum strength of the entry segment (72-73) versus the departure segment (76-77) to assess whether momentum divergence is forming, which would then help evaluate the potential for trend continuation or reversal risk.
Scenario 2: Extended consolidation/oscillation within the zone. If the price fails to validly hold above the $58–$58.5 zone and instead falls back into the consolidation zone for continued oscillation, it suggests the consolidation zone will enter an extension phase, potentially forming a more complex sideways pattern. The direction of the subsequent trend will require confirmation from a new breakout signal.
IV. HYPE This Week's Market Forecast and Short-term Trading Strategy
1. HYPE this week's price forecast:
①. Key resistance levels:
•First resistance zone: $58.5–$60 area
•Second resistance: Near the upper boundary of the descending channel
•Third resistance: Around $72.97
②. Key support levels:
•First support zone: $50–$52 area;
•Second support: Around $45;
Core viewpoint for the week: Focus on observing whether the price can validly break through and hold above the $58–$58.5 resistance zone, forming the departure segment from the consolidation zone. This will dictate the market's subsequent mode of operation.
2. HYPE this week's short-term trading strategy:
①. For those holding long positions: For investors who have already established long positions in the $50–$52 zone based on the previous trading plan, it is recommended to move the initial stop-loss up to above the entry cost basis, strictly adhere to stop-loss discipline, and hold the position awaiting further upside.
②. For those with no position: If the price validly breaks through the $58.5–$60 zone and shows signs of stabilization, one may consider a light试探性 long position. A stop-loss must be set, and the principle of "quick entry and quick exit" should be followed. If momentum divergence appears during the rebound, exit decisively to avoid the risk of a deeper pullback.
V. Special Reminders:
1. Upon entry: Immediately set an initial stop-loss.
2. When profit reaches 1%: Move the stop-loss to the entry cost price (breakeven point) to ensure capital safety.
3. When profit reaches 2%: Move the stop-loss to the position representing a 1% profit.
4. Continuous tracking: Thereafter, for every additional 1% profit, the stop-loss should be moved up by an equivalent 1%, dynamically protecting and locking in gains.
The financial markets are ever-changing; all market analysis and trading strategies require dynamic adjustment. All viewpoints, analytical models, and operational strategies mentioned in this article are derived from personal technical analysis and serve solely as a personal trading log. They do not constitute any investment advice or operational basis. Markets are risky; investment requires caution. Please do not make decisions solely based on this content.





