Gold returns to $4,350 — Is the precious metals correction over?


- Key Takeaways: Sprott has characterized the 2026 precious metals pullback as a cyclical correction within a secular bull market, rather than a trend reversal. Gold has held above $4,000 and rebounded to $4,350, with central bank purchases and structural silver deficits providing medium- to long-term support, but a short-term reversal still requires confirmation from macro variables.
- Key Factors:
- As of August 7, gold briefly broke above $4,350/oz, hitting a seven-week high, after finding support from physical and central bank buying in the $4,000–$4,100 range.
- Global central banks made net purchases of 289 tonnes of gold in Q2, roughly five times the revised Q1 figure and a record for the quarter; however, the H1 total of 345 tonnes remains the lowest since 2022.
- CFTC data shows that net long positions in gold managed funds rose to 132,000 contracts in the week ending August 4, reaching January levels; silver net longs increased 32% week-over-week, indicating a clear return of speculative capital.
- Silver's supply deficit is expected to widen to 46.3 million ounces in 2026, marking the sixth consecutive year of undersupply; however, industrial demand is projected to decline 3% year-over-year, with silver demand from photovoltaics down 19%.
- After gold rose 64.58% and silver gained 147.95% in 2025, gold is down 6.33% and silver down 19.63% year-to-date in 2026, though prices remain significantly higher than a year ago.
- The market is focused on four key variables—central bank purchasing intensity, silver inventory depletion, the trajectory of the dollar and real rates, and the sustainability of futures capital inflows—to determine whether the rebound can continue.
TL;DR
- Sprott believes the 2026 decline in gold and silver resembles a cyclical correction within a long-term bull market, with gold breaking above $4,350/oz on August 7.
- Central banks net purchased 289 tons of gold in Q2, roughly five times the revised Q1 figure of 57 tons, but first-half purchases remain the lowest since 2022.
- Silver is expected to remain in supply deficit for a sixth consecutive year, but softer industrial demand, the dollar, real rates, and liquidity conditions will continue to amplify short-term volatility.
Sprott Asset Management recently published a precious metals report, characterizing the pullback in gold and silver since 2026 as a cyclical correction within a long-term bull market rather than the end of the rally that began in 2025.
As of August 7, gold briefly broke above $4,350/oz, hitting a seven-week high. Prior to that, prices had stabilized in the $4,000–$4,100 zone, suggesting that safe-haven demand and capital flows were beginning to recover.
The question the report seeks to answer is straightforward: after gold rose 64.58% and silver surged 147.95% in 2025, does the pronounced pullback in the first seven months of 2026 signal a trend reversal, or a rebalancing after leverage and speculative sentiment were flushed out?
As of July 31, gold closed at $4,046.15/oz, down 6.33% year-to-date, while silver closed at $57.60/oz, down 19.63% year-to-date. Despite both metals retreating from their start-of-year levels, prices remain significantly higher than a year ago. For investors, the key question is not whether gold and silver are pulling back, but whether the long-term demand drivers behind the previous rally have fundamentally changed.
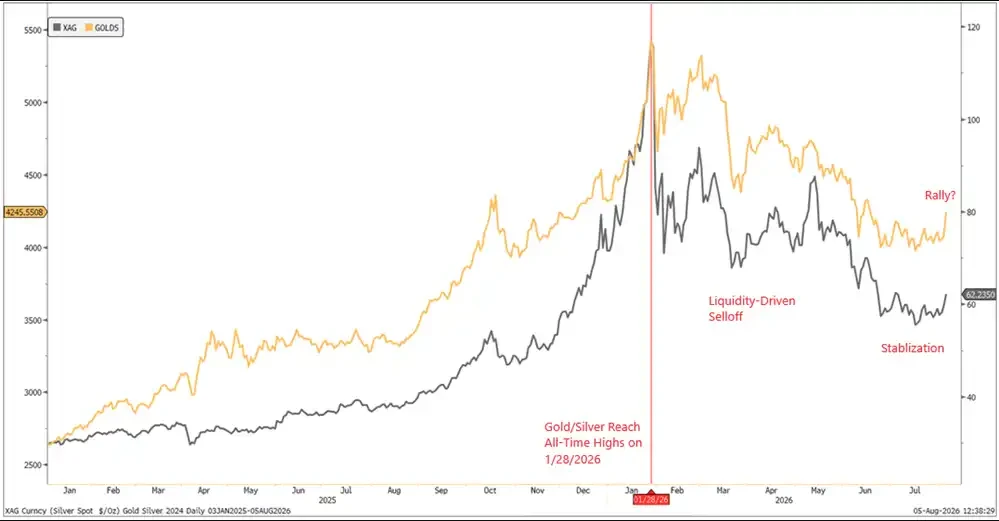
Gold and silver surged in 2025, hit record highs in early 2026, then pulled back notably, though prices remained above year-ago levels by end-July
Gold Stabilizes Near $4,000, Futures Flows Begin to Return
Sprott's assessment is not that precious metals won't fall further, but rather that this pullback has not yet undermined the long-term support factors.
Gold and silver rose too much in 2025 and continued to hit record highs in early 2026, leading to an accumulation of leverage and profit-taking positions. Sprott believes that a geopolitical conflict in March unexpectedly tightened global liquidity, forcing some leveraged investors to sell gold to raise cash. Entering Q2, easing US-Iran tensions, falling oil prices, a stronger dollar, and expectations that US rates could stay higher for longer further weighed on precious metals prices.
By early summer, much of the selling pressure had been released. Gold regained support from physical demand and central bank buying around $4,000, before breaking above $4,350 on August 7. Silver experienced even more volatile swings but also stabilized in the $55–$60 range and briefly moved back above $60.
Futures positioning also showed signs of returning flows. According to Saxo Bank's compilation of CFTC data, in the week ending August 4, hedge funds had already increased precious metals exposure before gold's technical breakout. Net speculative long positions in silver futures rose 32% week-over-week, while net gold longs also continued to climb, reaching their highest level since January.
Meanwhile, speculators cut roughly $13 billion in dollar longs within a week, the largest weekly reduction in six years. However, overall dollar positioning remains distinctly net long, so it's premature to conclude that the dollar trend has reversed.
COT data is best suited for gauging short-term speculative sentiment. It shows that precious metals are regaining speculative interest, but it cannot alone prove that a new bull market has begun.
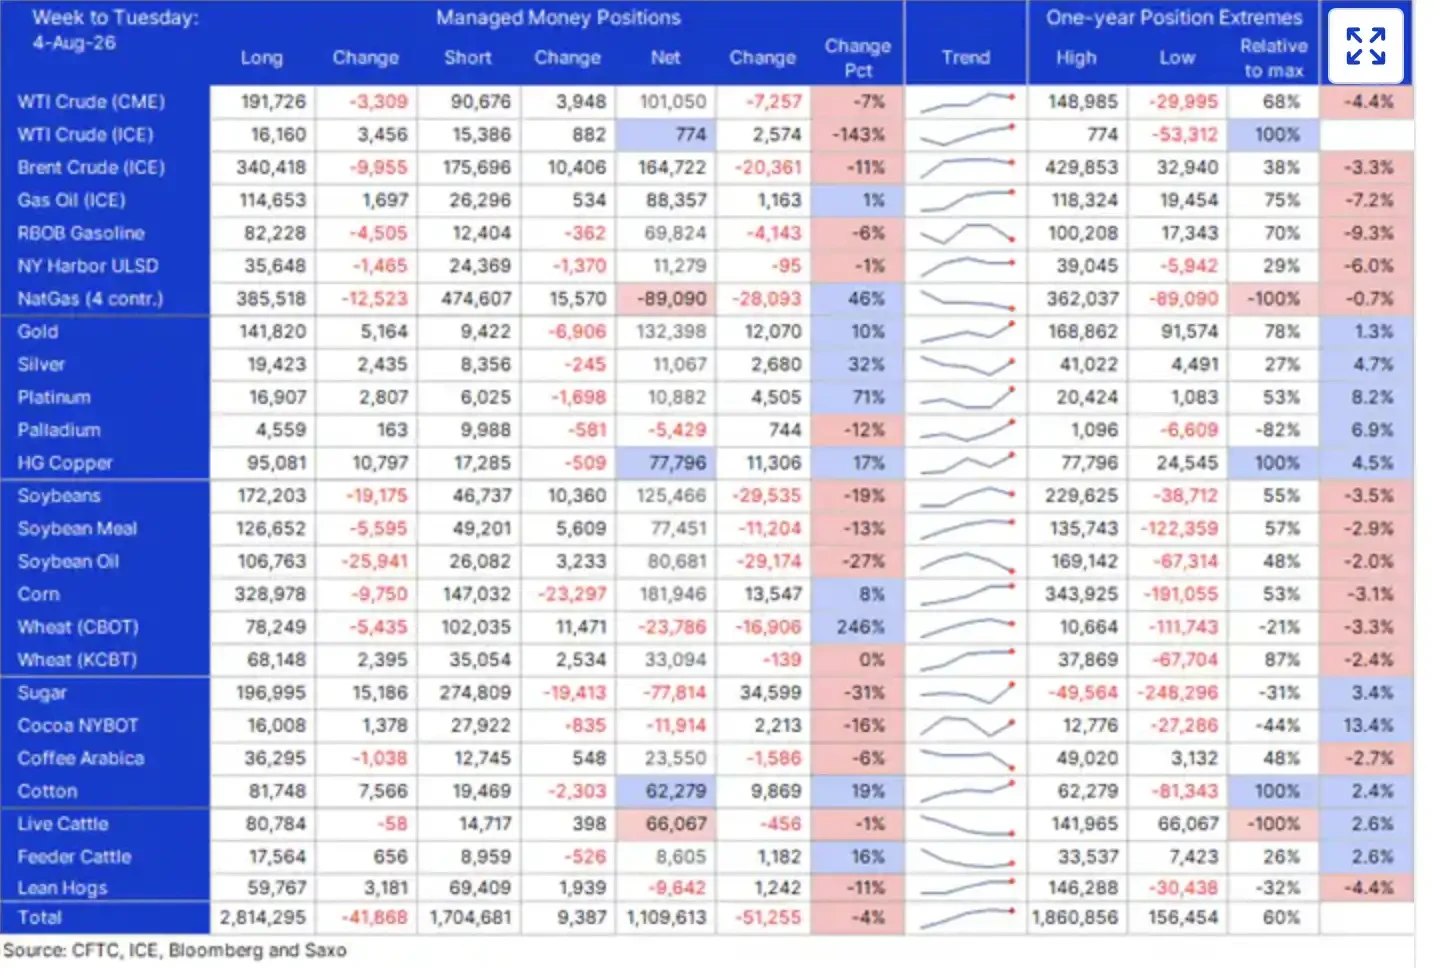
In the week ending August 4, net longs from managed funds in gold rose to 132,000 contracts, the highest since January; silver net longs increased 32% to approximately 11,000 contracts, though overall positioning remains at relatively low levels.
Central Banks Net Purchased 289 Tons in Q2, But H1 Demand Not Fully Recovered
Gold's long-term support remains tied to central bank and sovereign flows.
According to the World Gold Council, global central banks net purchased 289 tons of gold in Q2 2026, roughly five times the revised Q1 figure of 57 tons. This represents a 62% year-over-year increase and marks the highest Q2 level on record.
However, there's another side to this data. Due to a significant downward revision in Q1 purchases, total net central bank buying in H1 2026 reached 345 tons, the lowest first-half total since 2022. This suggests that central bank demand recovered notably in Q2, but whether it has re-entered a sustained acceleration phase remains to be confirmed by subsequent data.
Among disclosed figures, Poland and China were the most prominent buyers in Q2, adding roughly 51 tons and 33 tons respectively. Official sector continued allocation to gold remains underpinned by long-term factors such as sovereign debt expansion, fiscal deficits, geopolitical fragmentation, and reserve diversification.
Gold's independence from any single sovereign credit makes it a strategic asset beyond traditional FX reserves for some central banks. Such buying may not continuously push short-term prices higher, but it can provide support for physical demand during ETF outflows, leveraged liquidations, or weakening investor sentiment.
Whether central bank gold purchases maintain their intensity will be a key variable in assessing the durability of support near $4,000.
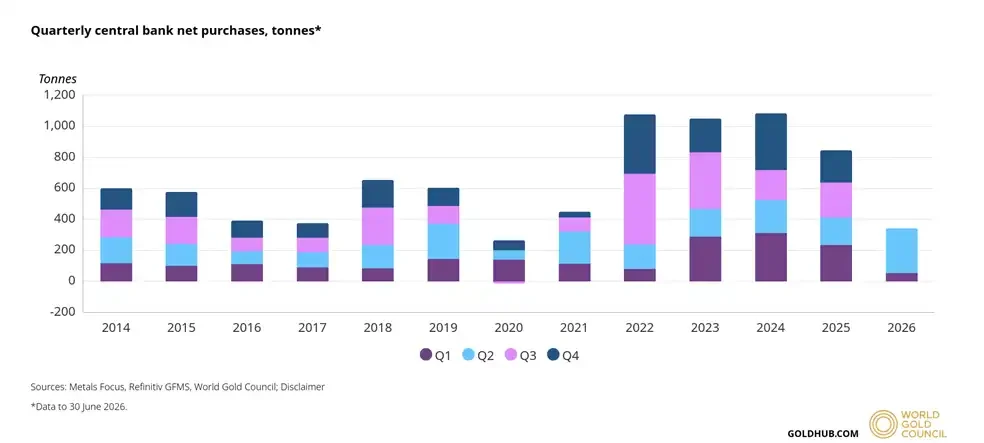
Global central banks net purchased 289 tons of gold in Q2 2026, roughly five times the revised Q1 figure of 57 tons and the highest Q2 level on record; however, H1 net purchases remain the lowest since 2022
Silver Industrial Demand Softens, Yet Supply Deficit Widens
Silver's pricing dynamics are more complex than gold's. It carries both monetary and investment characteristics while also being influenced by industrial demand, mine supply, and inventory changes.
The World Silver Survey 2026, published by the Silver Institute and Metals Focus in April, shows a global silver market deficit of 40.3 million ounces in 2025, projected to widen to 46.3 million ounces in 2026, marking a sixth consecutive year of supply shortfalls.
Consecutive deficits mean the market still needs to draw down above-ground inventories to bridge the gap. However, industrial demand in 2026 is not uniformly growing.
The report projects industrial silver demand to fall to 639.6 million ounces in 2026, down approximately 3% year-over-year, with photovoltaic silver demand expected to decline 19%. This largely reflects higher silver prices prompting solar manufacturers to reduce silver usage per unit, rather than all industrial applications expanding simultaneously.
Grid investment, electrification, AI infrastructure, and advanced manufacturing remain long-term demand sources for silver, but it's overly simplistic to assume every industrial segment is growing in 2026. The widening silver deficit is not solely driven by industrial demand either—it also relates to changes in mine supply, recycling flows, and investment demand.
This is precisely why silver tends to be more volatile than gold. During rallies, the smaller market size, tight inventories, and speculative inflows amplify price elasticity. During selloffs, concerns over industrial demand, tightening liquidity, and deleveraging of speculative positions can deepen the declines.
Silver fell nearly 20% in the first seven months of 2026, significantly underperforming gold. As prices stabilize in the $55–$60 range, the market is reassessing how consecutive deficits, recovering investment demand, and a gold rebound might lift silver.
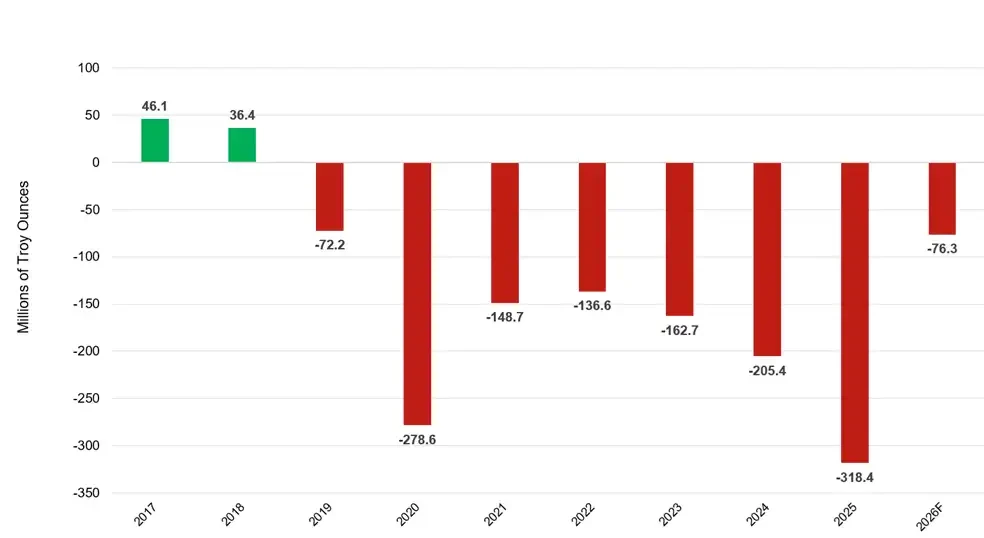
The global silver market posted a supply deficit of 40.3 million ounces in 2025, projected to widen to 46.3 million ounces in 2026, marking a sixth consecutive year of supply shortfalls
Long-Term Thesis Intact, But Short-Term Reversal Needs Confirmation
Sprott's long-term bullish stance is unambiguous, but "a pullback doesn't end the bull market" is not the same as "a new rally has been confirmed."
The biggest source of disruption for precious metals remains the macro environment. If the dollar regains strength, real rates continue to rise, or global liquidity tightens again, rebounds in both gold and silver could be interrupted. Silver, given its dual industrial attributes, smaller market size, and higher leveraged trading participation, may continue to experience greater short-term volatility than gold.
Central bank buying and silver deficits are medium-to-long-term supports and do not preclude sharp price drawdowns. While Q2 central bank purchases recovered notably, first-half volumes remain below recent years' levels. Silver is seeing consecutive supply deficits, but industrial demand is slowing. COT data shows capital returning, but futures positioning can quickly reverse with shifts in the dollar and Treasury yields.
Therefore, the significance of $4,350 is not just a price level—it represents the market beginning to re-test whether the long-term bull market in precious metals still holds after gold stabilized near $4,000.
Going forward, whether the gold and silver rebound can persist will largely depend on four variables: whether central bank gold purchases maintain their intensity, whether the silver deficit continues to draw down inventories, whether the dollar and real rates resume their upward path, and whether futures inflows prove sustainable.
The available data supports the view that "the long-term bullish thesis remains intact," but it is not yet sufficient to prove that a new one-way rally has begun.