Gate 機構月報 | ETF資金持續淨流出,加密市場進入寬幅震盪階段


- 核心觀點:2026年5月,加密市場在地緣風險與政策預期交替影響下進入震盪階段;ETF資金流入放緩,行業重心正從交易轉向合規化與真實收入驅動的基礎設施建設,穩定幣市值突破3000億美元,VC融資顯著回暖。
- 關鍵要素:
- 地緣政治(中東、俄烏)反覆干擾壓制風險偏好,加密市場偏向存量博弈,比特幣相對穩健,山寨幣承壓。
- 加密ETF資金流入明顯放緩並階段性淨流出,機構由積極配置轉向謹慎,比特幣與以太坊ETF均呈現調整趨勢。
- 全球權益市場延續上漲,美股在AI主線(半導體)與醫療板塊領跑,VIX指數下跌顯示風險偏好提升,黃金高檔震盪回調。
- 預測市場交易量維持在百億美元規模,Kalshi在合規路徑下交易量與費用領先,Polymarket的全球流量與監管考驗並存。
- 加密支付卡交易量增至7.52億美元,穩定幣(USDT、USDC)主導支付場景,紅海市場高度集中,分化為大額出金與小額高頻兩類模式。
- 穩定幣市值突破3000億美元(一年翻三倍),受監管框架落地、新興市場美元需求及鏈上金融擴張驅動,但市場高度集中於Tether與Circle。
- 加密VC融資回暖,a16z募集22億美元,Haun Ventures募集10億美元,資金流向穩定幣、RWA、AI Agent金融軌道等真實收入方向。
Summary
• In May 2026, the global market oscillated between geopolitical disruptions, policy expectations, and risk appetite restoration. The crypto market entered a volatile phase characterized by structural opportunities.
• ETF inflows noticeably slowed and turned into net outflows at times, reflecting a shift in institutional capital from active allocation to cautious观望. The market lacks a clear short-term directional consensus.
• Global equity markets continued their upward trend overall. The US stock market maintained strength driven by the AI theme, with the semiconductor and healthcare sectors leading. Sentiment towards risk assets generally improved.
• Gold traded at high levels with volatility, while oil prices dominated commodity fluctuations. This indicates that risk aversion has not completely subsided, and global macro pricing remains influenced by geopolitical risks and inflation expectations.
• Prediction markets and crypto payment cards continued to expand. The industry's focus is shifting from trading narratives towards compliant, payment-oriented, and real revenue-driven infrastructure development.
• Gate officially launched stock trading, allowing users to trade stocks and ETFs in major US securities markets directly with USDT on the platform.
1. Market Macro Trends
1.1 Geopolitical Volatility Persists, Putting Continuous Pressure on Global Risk Appetite
The main theme of the macro environment in May was the recurring disruption of geopolitical events. Although there were signals of ceasefires and negotiations in the Middle East during the month, overall progress was unstable. Local conflicts and implementation setbacks made it difficult for the market to fully digest related risks. There were also brief attempts at easing tensions between Russia and Ukraine, but these were not sustainable, indicating that global political uncertainty remains at a high level. Against this backdrop, market risk aversion intensified periodically, supporting assets like crude oil and gold, while the overall performance of global risk assets was more cautious.
For the crypto market, the external environment in May was unfavorable. Rising geopolitical risks tend to suppress overall market risk appetite, with capital flowing towards safe-haven assets like cash and gold. Highly volatile crypto assets are more susceptible to sentiment-driven fluctuations, amplifying short-term price swings. Structurally, Bitcoin, benefiting from its liquidity and market consensus, usually performs relatively more stably, whereas altcoins and highly volatile sectors are more prone to pressure when risk appetite declines. Therefore, the crypto market in May was more tilted towards a battle among existing capital. The market's trading logic was dominated by defense, caution, and event-driven actions. A comprehensive rally still awaits a further reduction in external uncertainties.
1.2 ETF Flows: Inflows Slow Down Significantly, Market Sentiment Turns Cautious
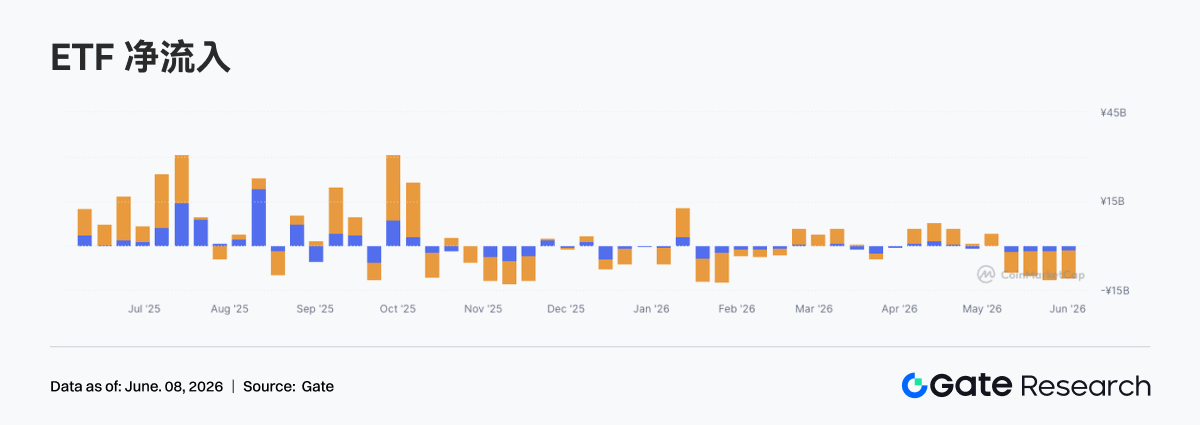
In May 2026, the cryptocurrency ETF market exhibited characteristics of slowing inflows and increasing net outflows. Correlating with market performance, as Bitcoin and Ethereum prices gradually weakened during the month, investor risk appetite dropped noticeably. Institutional capital began shifting from the previous active allocation phase to a cautious wait-and-see approach. Compared to the sustained inflow period in the second half of 2025 and early 2026, the ETF capital flow in May showed a clear cooling trend, reflecting the market's lack of a clear direction for short-term movements.
Structurally, Bitcoin spot ETFs remained the core driver influencing overall capital flows. During May, Bitcoin's price corrected after consolidating at high levels, leading some institutional investors to lock in profits and reduce risk exposure. Towards the end of the month, net ETF outflows expanded further, resonating with BTC's drop below key support levels, indicating that market sentiment was gradually shifting from optimism to caution. The increase in outflows also showed that institutional investors' concerns about short-term market volatility were rising.
Concurrently, the performance of Ethereum spot ETFs was also relatively weak. Although the Ethereum ecosystem and its long-term development prospects still garnered market attention, the willingness for new capital to enter was insufficient amidst the overall market correction, leading to a significant decline in ETF capital liquidity. Overall, the cryptocurrency ETF market in May exhibited a net outflow trend. Institutional capital allocation turned conservative, and the market entered a phase of periodic consolidation. In the short term, investors are more inclined to wait for the macro environment and market sentiment to become clearer before making large-scale allocations.
1.3 Global Capital Market Trends
1.3.1 Major Global Stock Indices: Risk Appetite Rises, US Stocks Continue Upward
In May 2026, major global stock indices generally continued their upward trend, with the US market performing particularly strongly. The Nasdaq Composite Index rose 5.61% for the month, the S&P 500 Index increased by 4.39%, and the Dow Jones Industrial Average gained 4.77%, reflecting strong market confidence in the US economic growth outlook and corporate profitability. The technology sector continued to be a significant driver of the market rally.
Looking at other major markets, Canada's S&P/TSX Composite Index rose 4.60%, largely in sync with the US market. The UK's FTSE 100 Index fell slightly by 0.26%, showing relative weakness. Meanwhile, the VIX volatility index, a measure of market fear, fell by 12.70% during the month, indicating an improvement in investor risk appetite and a noticeable decrease in market demand for safe havens.
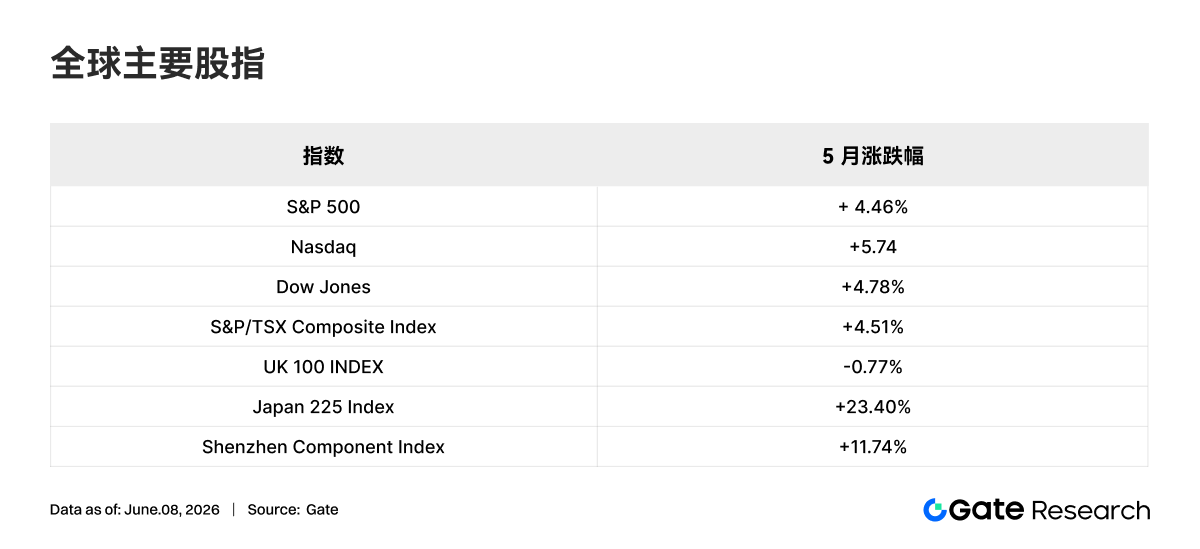
Overall, global equity markets showed strong resilience in May 2026, with major economies' stock markets generally recording positive returns. Risk assets outperformed safe-haven assets, and overall market sentiment was leaning towards optimism, providing a favorable investment environment for global capital markets. However, against the backdrop of rising valuations, investors still need to pay attention to the potential impact of macroeconomic data, monetary policy changes, and geopolitical factors on the market.
1.3.2 Stocks: AI Theme Strengthens, Semiconductors and Healthcare Lead
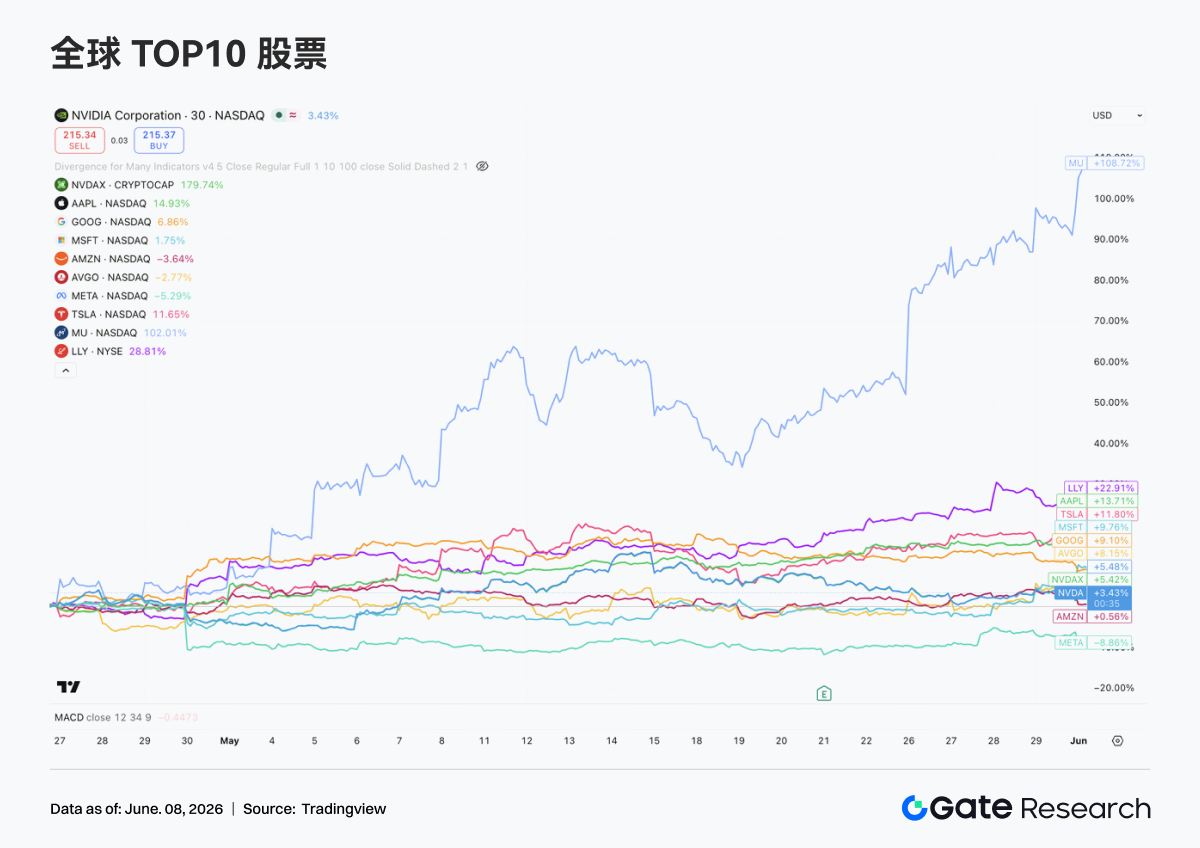
In May, the top ten US-listed companies by market cap generally continued their upward trend, but divergence among sectors and individual stocks widened significantly. The market narrative still revolved around artificial intelligence, with capital concentrating on leading companies possessing AI infrastructure, cloud computing capabilities, and deterministic profit growth. In terms of performance, the semiconductor sector clearly led the pack, with most tech giants posting positive returns, while some internet platform and e-commerce companies lagged relatively.
Semiconductors became the strongest trend of this cycle. Rising market expectations for AI computing demand drove valuations across the entire chip industry chain. Micron Technology (MU) performed most prominently, benefiting from surging demand for HBM (High Bandwidth Memory) and data center expansion, with its stock price doubling. Nvidia (NVDA), although showing relatively moderate gains, remained strong after significant increases over the past two years. Meanwhile, network and custom chip suppliers like Broadcom (AVGO) also continued to benefit from the AI infrastructure buildout cycle, indicating that capital has spread from the single-GPU logic to the entire computing ecosystem.
The healthcare sector emerged as another important investment theme in May. Eli Lilly (LLY) achieved significant excess returns driven by the continued strong sales of its GLP-1 weight loss and diabetes drugs. The market has gradually come to view it as a scarce asset combining both tech-growth attributes and pharmaceutical defensive characteristics.
1.3.3 Gold: Safe-Haven Demand Cools, Prices Consolidate and Pull Back from Highs
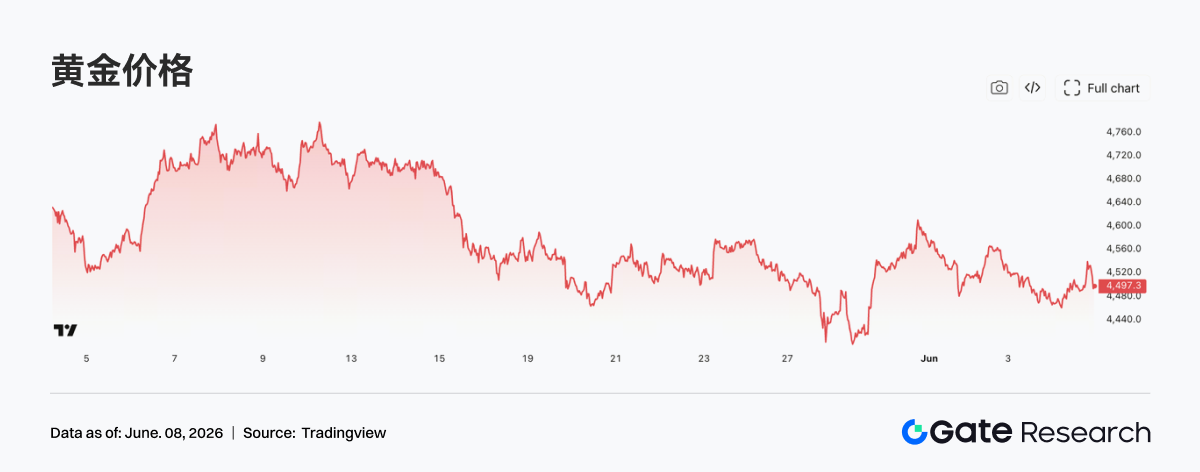
In May, international gold prices exhibited a high-level consolidation trend. After consecutive rallies that set new all-time highs, the market entered a phase of profit-taking, and gold prices edged down by approximately 0.8% during the month. Although the correction was limited, it reflected that investors were reassessing short-term safe-haven demand and expectations for interest rate cuts.
However, the long-term support logic for gold has not fundamentally changed. Continued gold reserve accumulation by global central banks, challenges to the US dollar credit system, and expectations of an upcoming rate cut cycle in major economies still provide medium to long-term support for gold. During this adjustment phase, gold prices have generally traded near historical highs, indicating that market demand for gold allocation remains robust.
Overall, the gold market in May appeared more like a technical consolidation following a strong previous rally rather than a trend reversal. Amid slowing global economic growth, persistent geopolitical uncertainties, and a gradual shift towards accommodative monetary policy by major central banks, gold still possesses strong strategic allocation value.
1.3.4 Commodities: Oil Prices Dominate the Fluctuation Range, Industrial Metals Reprice Around "Inflation Expectations"
In May 2026, the most significant change in the commodity market was energy prices becoming the market's pricing anchor once again. Affected by the recurring situation in the Middle East, transportation risks in the Strait of Hormuz, and expectations of supply disruptions, international oil prices experienced multiple sharp rallies and sell-offs during May. The market's sensitivity to geopolitical premiums increased noticeably. A Reuters report on May 12 showed Brent crude briefly reaching around $107.77 per barrel and WTI rising to about $101.89 per barrel. This reflects a trading logic shift from "demand concerns" to "supply security first." It means that commodities in May were no longer simply following fluctuations in macro growth expectations but were more influenced by sudden events and a resurgence of inflation expectations. Specifically, crude oil has once again become a key variable affecting global asset pricing.
Amid oil price disruptions, industrial metals also showed significant divergence. Industrial metals like copper exhibited characteristics of "coexisting macro expectations and supply-demand expectations." While price elasticity remained, its persistence was not as strong as the energy sector. Overall, the commodity market in May has moved from the previous macro-trading phase into a new stage jointly driven by "geopolitical shocks + interest rate expectations + supply constraints." Short-term high volatility is likely to continue, with energy commodities clearly dominating over precious and base metals.
2. Analysis of Popular Sectors
2.1 Prediction Markets: Institutional Inflection Point, Regulatory Test, and Liquidity Redistribution
In May, Taker volume in prediction markets was approximately $11.36 billion, a slight increase of about 2% from April's ~$11.14 billion, marking the 5th consecutive month in 2026 with volumes exceeding $10 billion. Meanwhile, internal structural changes were significant. Kalshi's May volume was about $6.15 billion, accounting for approximately 54% of the total market; Polymarket International contributed ~$3.23 billion (about 28%); and Polymarket US reached $695 million, doubling month-over-month. The industry's incremental growth is shifting from pure crypto-native traffic towards more regulated trading scenarios akin to traditional derivatives markets.
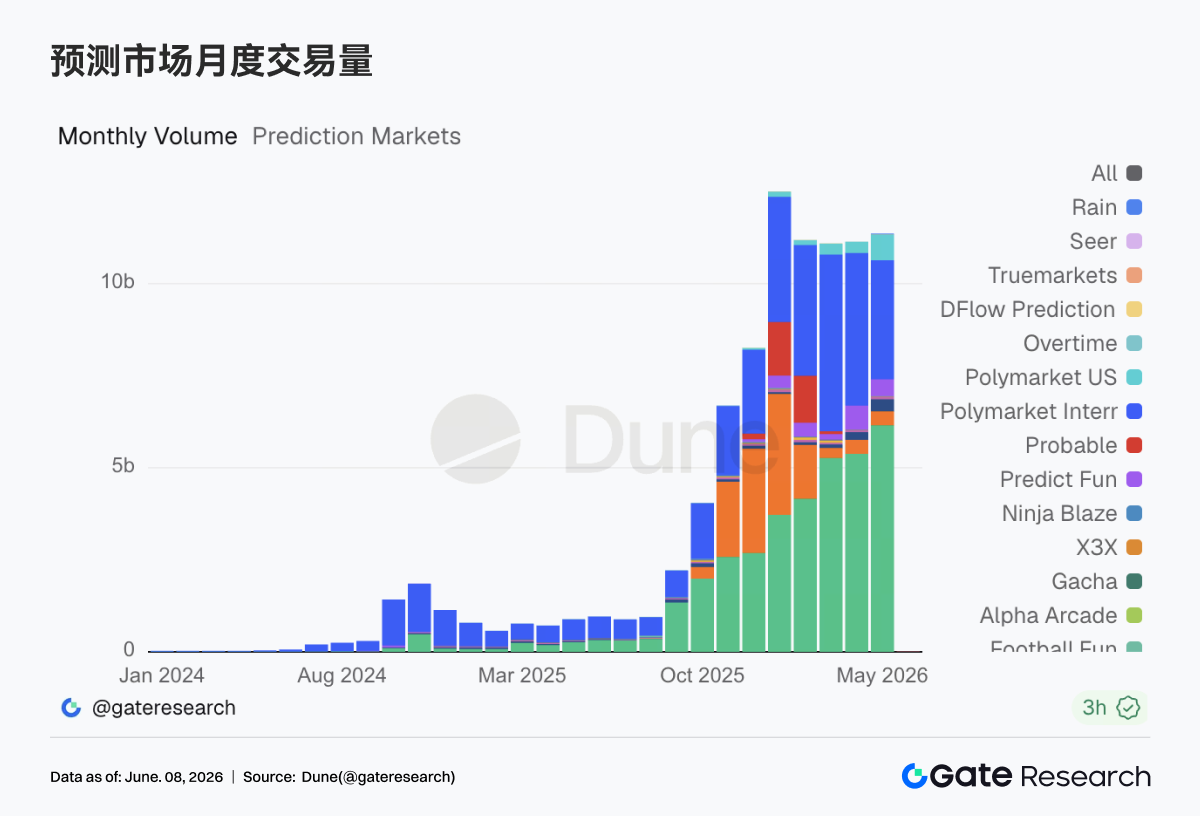
Beyond trading volume, valuations for prediction market leaders in the primary market continued to rise. Kalshi completed a $1 billion funding round, raising its valuation to $22 billion. Participants included Coatue, Sequoia, a16z, Morgan Stanley, ARK, etc. Prediction markets are now being viewed by mainstream capital as event-risk trading infrastructure. Kalshi explicitly stated in its fundraising information that the funds would be used to expand institutional clients such as hedge funds, asset managers, proprietary trading firms, and insurance companies, and to develop block trading, risk management products, and broker integration. This is precisely the direction institutions are truly interested in: converting uncertainties related to macroeconomics, elections, policy, sports, and geopolitics into standardized contracts that can be traded, cleared, and risk-managed. Data supports this assessment. Kalshi's current 30-day average daily Taker volume is about $199 million, with a 7-day average of ~$218 million and a 7-day market share rising to ~57%. Its open interest is approximately $674 million, also ranking first.
In contrast, Polymarket still boasts strong global traffic and brand recognition, but its International platform's May volume of ~$3.23 billion was lower than April's ~$4.15 billion, declining for the second consecutive month since introducing comprehensive fees. Meanwhile, Polymarket US volume rose from ~$302 million in April to ~$695 million in May, indicating that Polymarket's compliant return path to the US market is gaining traction.
Fee data further illustrates that the commercialization capability of prediction markets is concentrating among top platforms. Industry-wide fees in May were approximately $184 million, higher than April's ~$155 million, with fee growth significantly outpacing volume growth. Kalshi contributed an estimated ~$138 million in fees (about 75% of the total). Polymarket International contributed ~$28.07 million, and Polymarket US ~$12.78 million. For institutional investors, trading volume indicates market heat, while fees demonstrate a platform's real revenue-generating capacity and pricing power. As prediction markets may eventually be valued on the logic of exchanges, brokers, or derivatives infrastructure, fee concentration, client structure, and sustainable revenue will become more important than single-month volume.
Regulatory events in May constituted the largest source of risk premium for the industry. The House Oversight Committee launched an insider trading investigation into Kalshi and Polymarket, requesting details on identity verification, geographical restrictions, and abnormal trading detection mechanisms. In the same month, Kalshi supported the establishment of the "Americans for Fair Markets" lobbying group, attempting to promote a federal regulatory framework centered on the CFTC. These two events – one representing pressure, the other defense – essentially point to the same thing: prediction markets are being brought into a more serious financial regulatory discussion. For institutional capital to use prediction markets for hedging macro, policy, and geopolitical risks, issues like insider information, government employee trading, market manipulation, and restrictions on markets related to violence or terrorism must be institutionally addressed.
Polymarket's activities in May also highlighted the tension between global expansion and regulatory boundaries. Polymarket is preparing to enter the Japanese market while still facing regulatory scrutiny in jurisdictions like the US, India, and South Korea. Its advantage lies in crypto-native users, global event coverage, and on-chain transparency, but its challenge is the inconsistent legal classification of "prediction markets," "gambling," "derivatives," and "information markets" across different countries.
For institutions, Polymarket represents an open, globalized, crypto-native growth path; Kalshi represents a regulated, centralized, institutional-access-oriented growth path. May data suggests the latter temporarily leads in volume, fees, and OI, but the former may remain strong in global markets and long-tail event categories.
In summary, May was a crucial transitional month for prediction markets moving towards becoming financial infrastructure. The key focus is whether prediction markets can establish themselves as a new type of event derivatives market – enabling opinion expression, risk management, and covering non-standardized event risks that traditional futures, options, and macro hedging tools cannot address. Kalshi's fundraising and data lead indicate that the compliant path is gaining capital recognition. Polymarket's US return and Japan expansion show that global platforms are still searching for regulatory breakthroughs. Meanwhile, long-tail platforms like Limitless, Predict Fun, and Opinion serve more as venues for vertical niches and high-churn experiments. The future winners will likely be platforms that can simultaneously satisfy compliance, liquidity, market surveillance, institutional access, and depth of event coverage.
2.2 Crypto Payment Cards: Steady Progress Towards Stablecoin Payment Infrastructure
In May, transaction volume for crypto payment cards continued its expansion. Attributable on-chain payment card volume reached approximately $752 million, an increase of about 12.5% from April's ~$669 million. Transaction count was around 3.05 million, up roughly 8% from April's ~2.82 million. The growth stems not only from large capital inflows but also from higher-frequency real-world usage.
Looking at the project landscape, the market was highly concentrated in May. RedotPay accounted for about $445 million, representing roughly 59% of the total market, making it the dominant player. KAST contributed approximately $93.88 million (about 12.5%), and EtherFi accounted for about $80.4 million (around 10.7%). The top three collectively held about 82% of the market. Although there are many crypto payment card projects, only a few leading products can achieve scale in payments or fiat on/off-ramps. This concentration indicates that clear distribution channels have emerged. Future business partnerships, card issuing collaborations, stablecoin distribution, and payment network negotiations will prioritize high-volume players like RedotPay, KAST, and EtherFi.
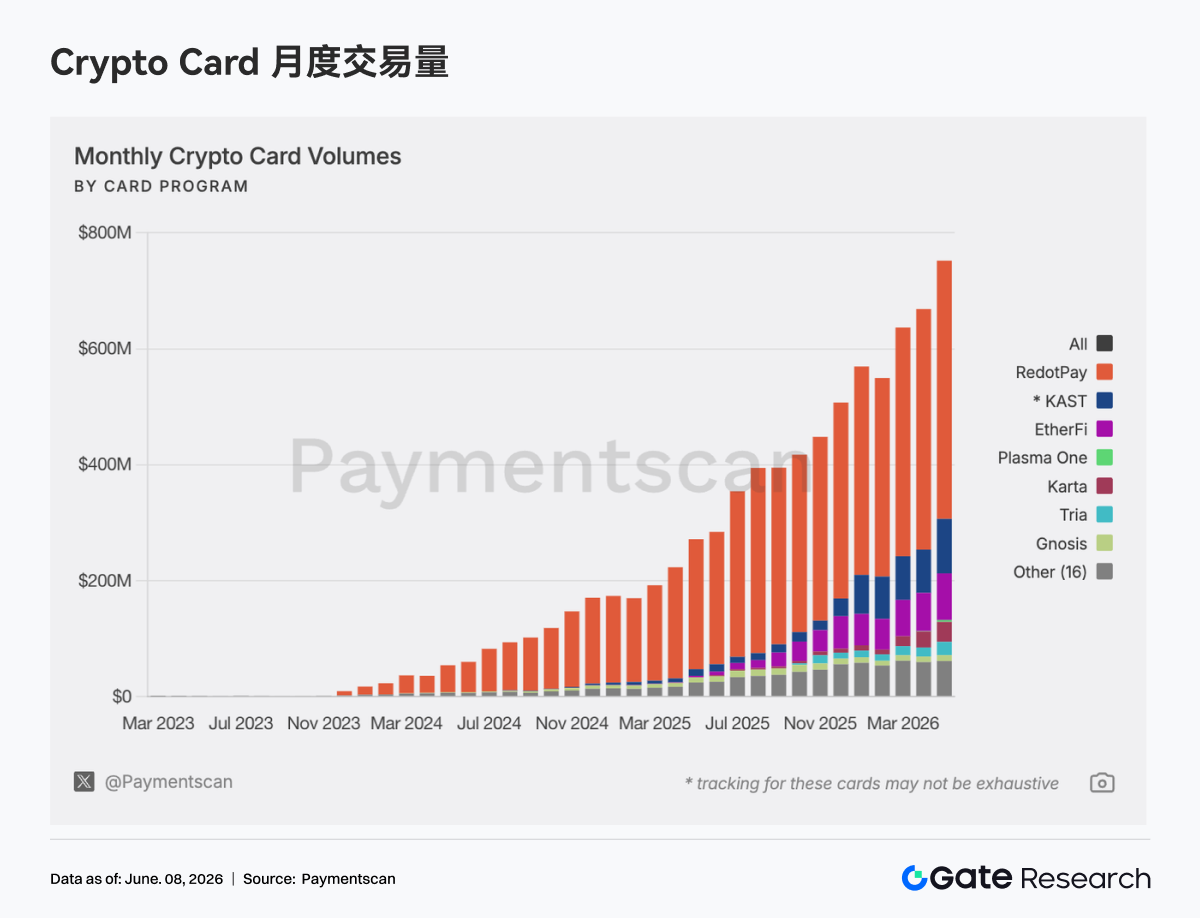
From a daily consumer spending perspective, RedotPay and KAST have average transaction values of approximately $766 and $931 respectively, pointing towards large-scale fiat on/off-ramps, stablecoin off-ramps, or high-net-worth consumer spending scenarios. EtherFi processed about 977,000 transactions in May with an average value of ~$82, closer to genuine daily consumer spending. Gnosis had ~220,000 transactions averaging ~$46, and Bitget Wallet had ~450,000 transactions averaging ~$14, also exhibiting small-ticket, high-frequency characteristics. This suggests an internal divergence within the crypto payment card market into two business models: one focuses on stablecoin off-ramps/large-value consumption cards, contributing the bulk of transaction volume; the other involves wallet-embedded daily payment cards, contributing user habits and transaction frequency.
In terms of chains, payment card activity in May remained clearly dependent on chains with high stablecoin liquidity. Based on attributable