Gate 機構週報:BTC 槓桿多頭承壓,Gate 正式推出股票交易


- 核心觀點:上週加密市場在加息預期與宏觀不確定性中持續承壓,BTC與ETH週跌幅約4-5%;全球加密ETF連續兩週淨流出累計達25.4億美元,資金向AI科技股轉移;鏈上交易重心向深度更強的平台(如PancakeSwap)集中,槓桿多頭堅守反彈預期,但市場整體風險偏好謹慎。
- 關鍵要素:
- 宏觀施壓:美國PCE通脹升至3.8%,CME FedWatch顯示約68%交易員預期2026年底前至少加息25BP,30年期美債收益率突破5.14%,壓制風險資產。
- ETF資金流出:BTC ETF連續14日淨流出,創2025年12月以來最長記錄;ETH ETF連續11日淨流出;兩週全球加密ETP合計淨流出25.4億美元。
- 鏈上交易集中:PancakeSwap交易量反超Uniswap,鏈上資金向流動性更深、執行效率更高的平台聚集;Solana生態Meme交易熱度降溫。
- 衍生品結構背離:BTC價格下跌但資金費率維持正值,顯示槓桿多頭仍在堅守;期權25D Skew持續為負,DVOL處於低位(34-38),市場等待方向性催化。
- TradFi與穩定幣進展:Gate推出股票交易,支援超1萬支美股及ETF;穩定幣進入基礎設施競爭期,Circle推出ChainBench強化多鏈開發與USDC整合。
Summary
• The market re-prices Fed rate hike expectations, continuing to pressure the crypto market. BTC fell approximately 4.3% weekly, while ETH fell about 4.8%. Global crypto ETFs saw net outflows for the second consecutive week, totaling $2.54 billion.
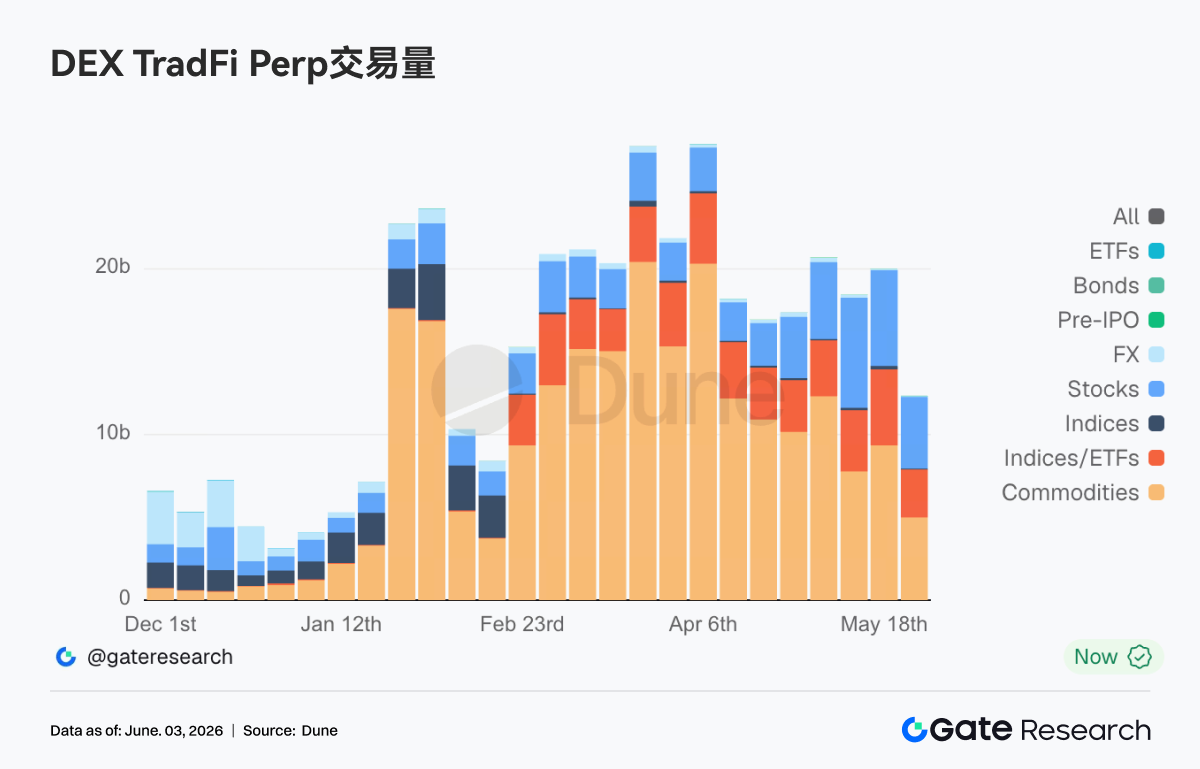
• Total trading volume on TradFi Perp DEXs fell back to around $12 billion. Gate officially launched stock trading services, supporting over 10,000 US stocks and ETFs. The total number of TradFi assets continues to grow, with the expansion of stock categories leading the industry.
• On-chain funds are concentrating on platforms with deeper liquidity and higher execution efficiency. PancakeSwap's trading volume surpassed Uniswap. Overall stablecoin supply saw limited change, with no concentrated flow towards any single type of yield-bearing stablecoin product. The LST sector cooled down, while the SOL ecosystem showed relatively stable performance.
• Risk appetite in DeFi remains cautious. Aave's lending scale continued to decline, while borrowing rates for its three core assets generally stabilized.
• In the derivatives market, BTC exhibited a pattern of "falling prices, positive funding rates, and continuously compressed volatility," indicating that leveraged longs are still holding on to expectations of a rebound.
• Next week, the market will face key macro data releases, including the May non-farm payrolls and the ISM Services PMI. Regarding token unlocks, special attention should be paid to HYPE's large unlock, valued at approximately $684 million, which could significantly impact market liquidity and sentiment.
1. Market Focus Analysis
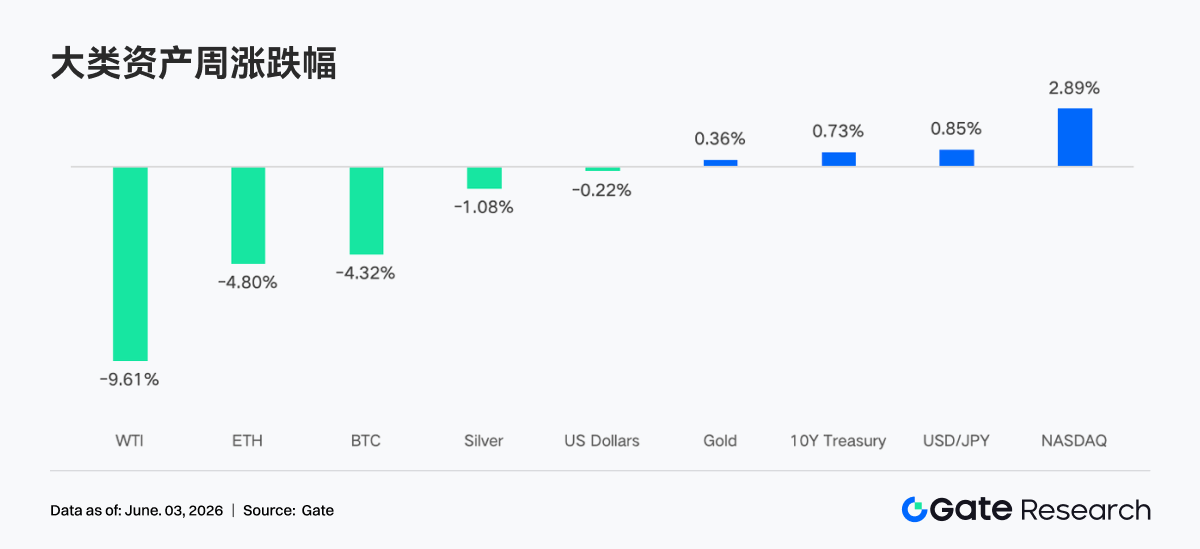
The Fed's monetary policy stance remains the market's primary focus. The US PCE inflation rate rose to 3.8%, its highest level since August 2023, with core PCE also increasing. This has sparked market concerns about Fed rate hikes. According to the CME FedWatch tool, about 68% of traders anticipate at least a 25 basis point rate hike before the end of 2026, with zero probability of a rate cut this year. The 30-year US Treasury yield broke through 5.14%, and Japan's 10-year government bond yield reached 2.8%, indicating structural loosening in the global fixed-income market. In the energy market, the US-Iran conflict hasn't fully subsided, with another round of attacks occurring on May 27, pushing oil prices up and exacerbating inflation expectations, further dampening market risk appetite. In the stock market, the S&P 500 and Nasdaq performed relatively strongly, with tech stocks driven by the AI sector continuing to attract capital. In contrast, Bitcoin significantly underperformed equities. Some institutional analysts point out that capital is shifting from crypto assets to AI tech stocks.
In the crypto market, BTC started the week at $77,027 and trended lower, briefly falling below $73,000 on Thursday, marking a 7-day decline of approximately -4.3%. ETH also declined, reaching a weekly low of $1,967, a drop of about -4.8%. Global crypto ETP products have experienced net outflows for two consecutive weeks, totaling a high of $2.54 billion, with the US contributing the vast majority. Institutions are generally implementing "de-risking" operations. The consecutive net outflows from ETFs set the longest streak since December 2025, leading to cautious overall market sentiment. On the regulatory front, there are reports that Bitcoin and Ethereum saw gains amid regulatory progress. Federal regulators spoke at the 2026 Bitcoin Conference, aiming to provide regulatory clarity on key current issues. These factors combine to create a complex macroeconomic environment marked by persistent inflation concerns, an unclear Fed policy outlook, and ongoing regulatory developments in the cryptocurrency market. Notably, Gate recently launched stock trading, allowing users to trade assets from major US securities markets directly on the platform using USDT, currently supporting over 10,000 stocks and ETF assets.
2. Liquidity Analysis
2.1 BTC and ETH ETFs Continue to See Significant Capital Outflows
BTC ETFs have recorded net outflows for 14 consecutive days, breaking the longest streak since December 2025. CoinShares data shows that over the past two weeks, global crypto ETPs have had a combined net outflow of $2.54 billion. The capital flow pattern clearly shows characteristics of "macro hedging + tactical position reduction." Multiple institutional analysts note that the ETF outflows fundamentally represent institutions rebalancing their portfolios by treating BTC as a macro risk asset, rather than an endogenous sell-off within the crypto market.
ETH ETFs continued their net outflow trend last week. As of May 28, they have seen net outflows for 11 consecutive days, the longest streak since March 2025. The overall performance of ETH ETFs is weaker than BTC ETFs, with no significant signs of large institutional buying. In contrast, alternative ETFs like XRP and SOL recorded net inflows during the same period, suggesting some institutional capital is rotating into non-BTC/ETH assets.
As of May 29, the total Assets Under Management (AUM) for BTC ETFs was approximately $94.17 billion, representing 6.38% of Bitcoin's total market cap. The historical cumulative net inflow stands at $55,714 million. The total AUM for ETH ETFs is around $11.40 billion, with a net asset ratio of about 4.5%, and historical cumulative net inflows of $11,404 million. Looking at institutional movements, capital flows show clear divergence: BlackRock's IBIT was the main source of BTC outflows last week, with a single-week outflow of $966.3 million, while its ETH product, ETHB, bucked the trend and recorded net inflows, indicating a subtle shift in institutional allocation focus between different assets.
2.2 TradFi Liquidity
• TradFi Perp DEX: Over the past week, the total trading volume on TradFi Perp DEXs fell significantly from the April highs, dropping to around $12 billion, the lowest level in nearly two months. However, structurally, the market isn't experiencing a broad-based cooldown but rather a clear rotation of asset classes. Commodities remain the dominant sector, accounting for roughly over 60% of total volume, although this is notably lower than the previous $15-20 billion stage, reflecting a pullback in demand for safe-haven assets like gold. Meanwhile, stock trading volume maintained its growth trend, with its share continuously increasing. This suggests that as US stocks hold at high levels, on-chain investors are gradually shifting their trading interest towards individual stocks and stock-related products.
• Gate TradFi Perp: Last week saw significant volatility, characterized by a pattern of "rapid volume increase – decline – re-increase." Precious metals remained the dominant sector. Trading volume noticeably expanded on May 27 and 28, with daily total volume approaching $550-600 million, before subsequently declining. This indicates market funds are still primarily trading around gold-related products, reflecting the enduring appeal of gold as a safe-haven asset and trading target in the current macro environment. Concurrently, the trading share of stock-based contracts has increased, showing noticeable thickening on multiple trading days. This suggests rising user participation in US stock-related perpetual contracts, particularly against the backdrop of recent US stock indexes near historical highs and sustained activity in AI and tech stocks. TradFi Perps are beginning to fulfill part of the demand from crypto users participating in the US stock market. Notably, Gate has recently been advancing stock tokenization, TradFi asset integration, and multi-asset trading system development. Judging by the changing trading volume structure, TradFi Perps are gradually evolving from a single gold trading market towards a dual-core structure of "Gold + US Stocks."
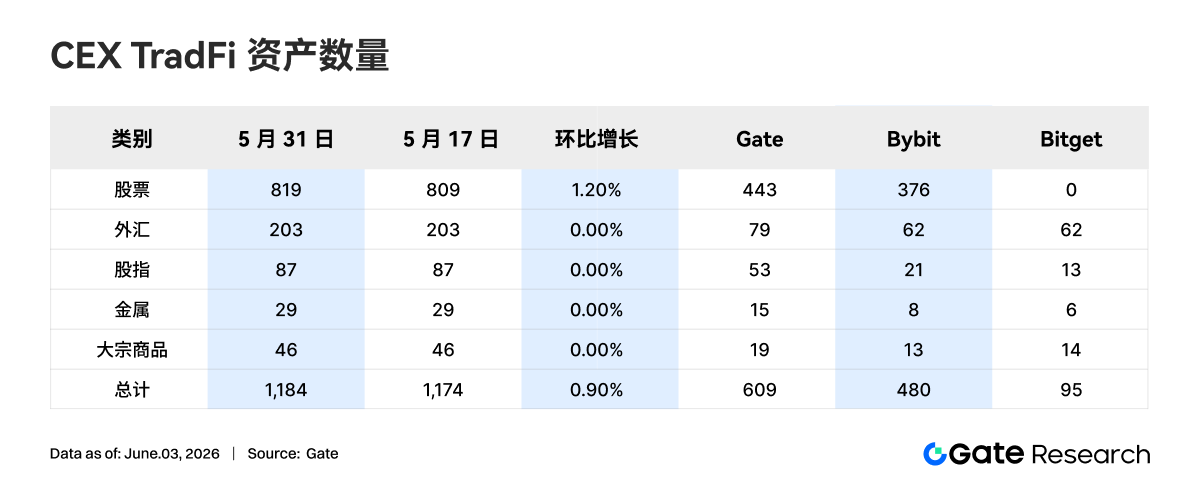
• CEX TradFi Asset Count: In the past week, the number of TradFi asset categories on CEXs expanded further. The total number of TradFi assets (counting only TradFi and CFD sectors, excluding perpetual contracts) across three major CEXs increased from 1,174 to 1,184, a month-over-month increase of 0.90%. Stock categories saw the most significant growth, rising from 809 to 819, a month-over-month increase of 1.20%. This stock count increase was contributed by Gate, where TradFi stocks grew by 10, a 2.3% increase.
• TradFi Order Book Depth: We selected XAUT, the TradFi asset with the highest trading volume, to analyze its order book depth (Delta). Market depth showed distinct phase-based changes, which can be divided into two stages: "liquidity replenishment in the first half of the week, and liquidity withdrawal in the second half." In the first half of the week, the order book consistently recorded positive Delta, with a large influx of bid and ask orders. Net liquidity added per hour exceeded $1 million multiple times. Concurrently, XAUT's price oscillated within the $4,500–$4,550 range, providing a relatively stable trading environment. In the second half of the week, the liquidity structure weakened noticeably. The order book Delta lingered in negative territory for extended periods. Although the price remained around $4,500, market depth continuously declined, suggesting some liquidity providers began reducing risk exposure or taking profits. Looking at the relationship between price and depth, XAUT experienced a brief pullback during the week but quickly recovered. However, order book liquidity did not recover simultaneously; instead, it continued to weaken. This implies that the current price support relies more on active buying than on deep resting liquidity. If gold prices experience further fluctuations, the shallower order book structure could amplify short-term price swings. In the near term, attention should be paid to whether liquidity will return and the support level in the $4,450–$4,500 zone.
3. On-Chain Data Insights
3.1 DEX Trading Shifts Towards Concentrated Liquidity, PancakeSwap Overtakes Uniswap
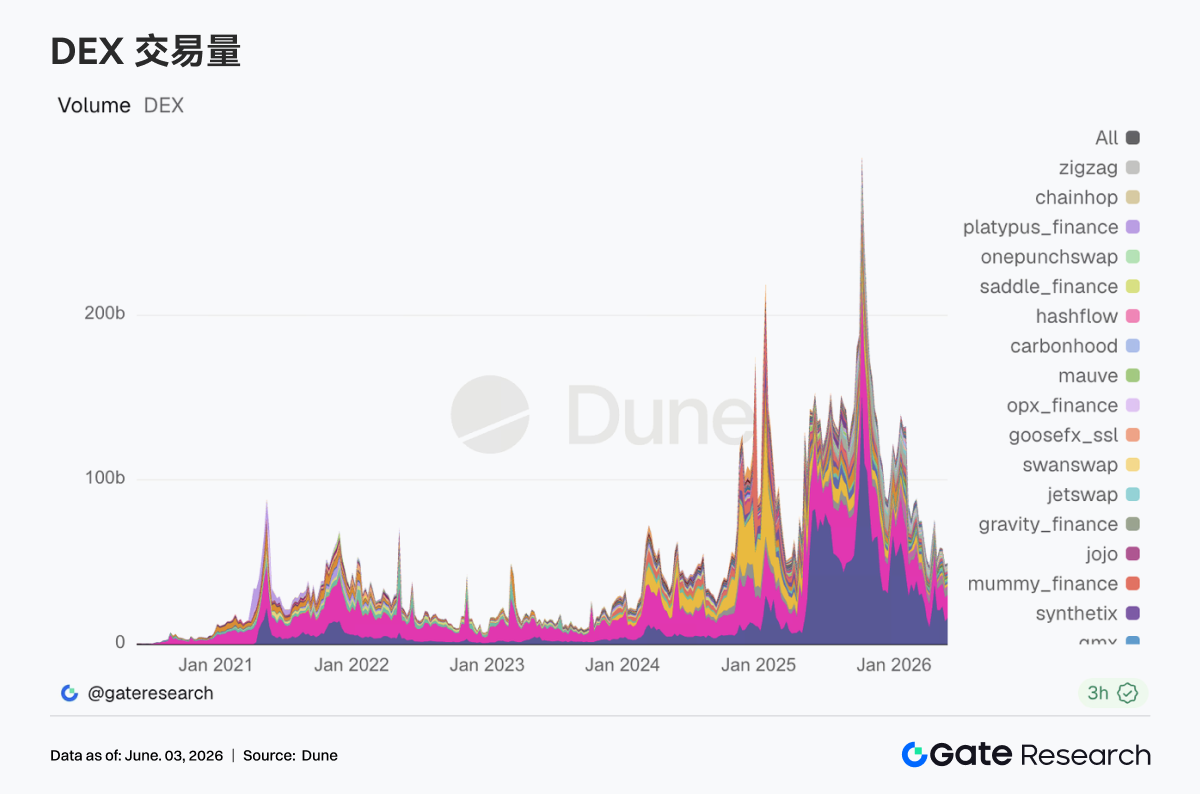
Overall DEX trading volume remained relatively high last week, but a new structural change emerged. PancakeSwap saw a significant rebound from the previous week, overtaking Uniswap. Uniswap experienced a slight decline but remained at a high-volume level, indicating persistent spot turnover demand for mainstream assets. Meanwhile, Raydium, Meteora, and PumpSwap within the Solana ecosystem underperformed overall, with trading activity related to Meme coins and high-volatility assets cooling off compared to earlier periods. Looking at the market environment, spot BTC ETFs also saw relatively high single-day net outflows, reflecting a decline in risk appetite for traditional market capital. However, on-chain funds did not simultaneously exit the trading market. Instead, they concentrated further on platforms offering deeper liquidity, lower transaction costs, and higher execution efficiency.
3.2 Stablecoins Enter a Phase Dominated by Compliance and Payment Narratives, USDC's Infrastructure Advantages Continue to Strengthen
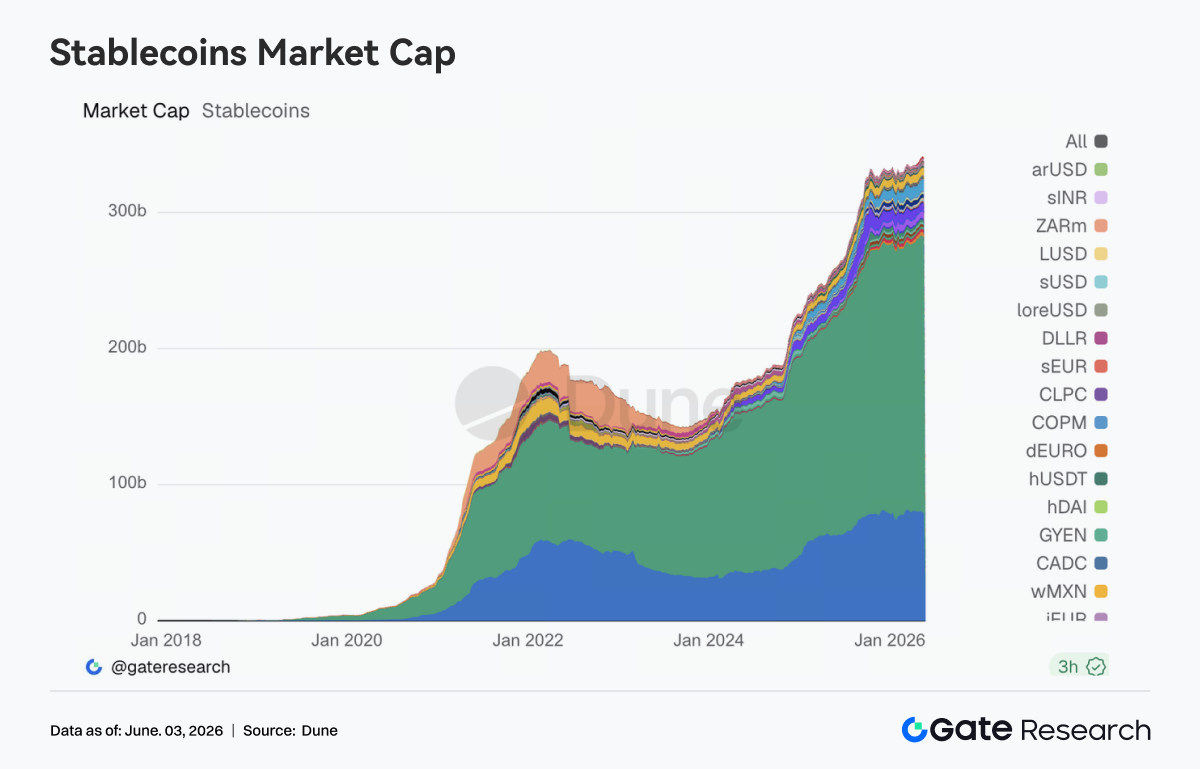
The overall supply of stablecoins saw limited changes last week, with no significant expansion in USDT or USDC. Assets like USDS, USDe, PYUSD, and USD1 continued modest growth, but funds did not concentrate into any single type of yield-bearing stablecoin product. Compared to supply changes, competition at the stablecoin infrastructure level is more noteworthy. Circle launched ChainBench on May 27, further promoting multi-chain development, USDC integration, and agent-driven financial infrastructure. Earlier, Circle had been expanding USDC's application scope within ecosystems like Hyperliquid, strengthening its role in collateral, settlements, and cross-chain capital flows. Concurrently, legislation related to stablecoins and market structure continues to progress. The ongoing game between the banking system and the crypto industry over revenue distribution, issuance models, and regulatory frameworks will continue to influence future product design.
3.3 LST Sector Cools Down but Remains Stable; Market Re-prices Cross-Chain and Security Premiums
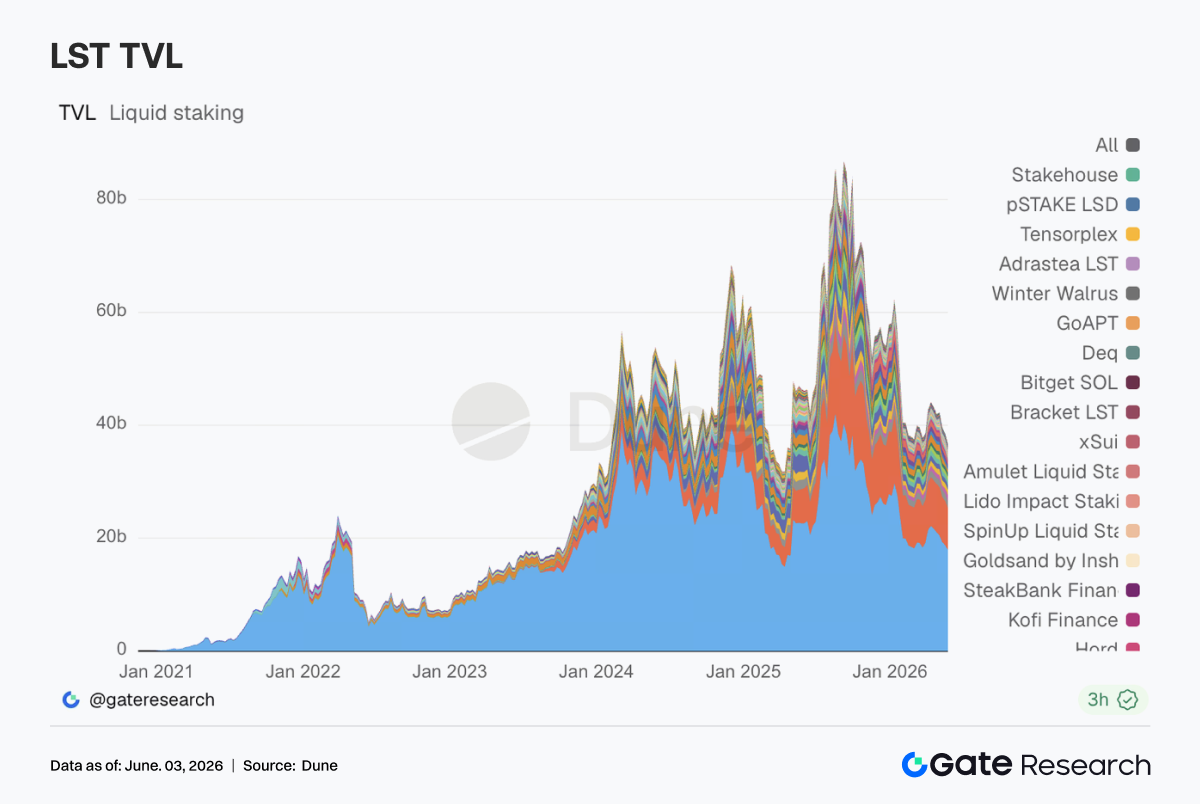
The LST sector entered a period of mild adjustment last week. TVL for ETH-side protocols like Lido and StakeWise decreased to varying degrees. Rocket Pool saw a relatively larger adjustment, though short-term changes are also influenced by factors like asset prices, TVL calculation methodologies, and capital re-allocation. In contrast, the SOL ecosystem showed relatively stable performance. Protocols like Sanctum, Jito, and Jupiter Staked SOL broadly maintained their levels from the previous week. From an industry perspective, Lido recently explained its choice of Chainlink CCIP for cross-chain expansion, citing core focuses on cross-chain security, issuance control rights, and risk isolation mechanisms. Following market discussions triggered by risk events related to KelpDAO and LayerZero, institutional attention on bridge security, redemption mechanisms, and governance transparency has noticeably increased.
3.4 Aave Lending Balances Continue to Decline; Risk Appetite Recovery Still Underway
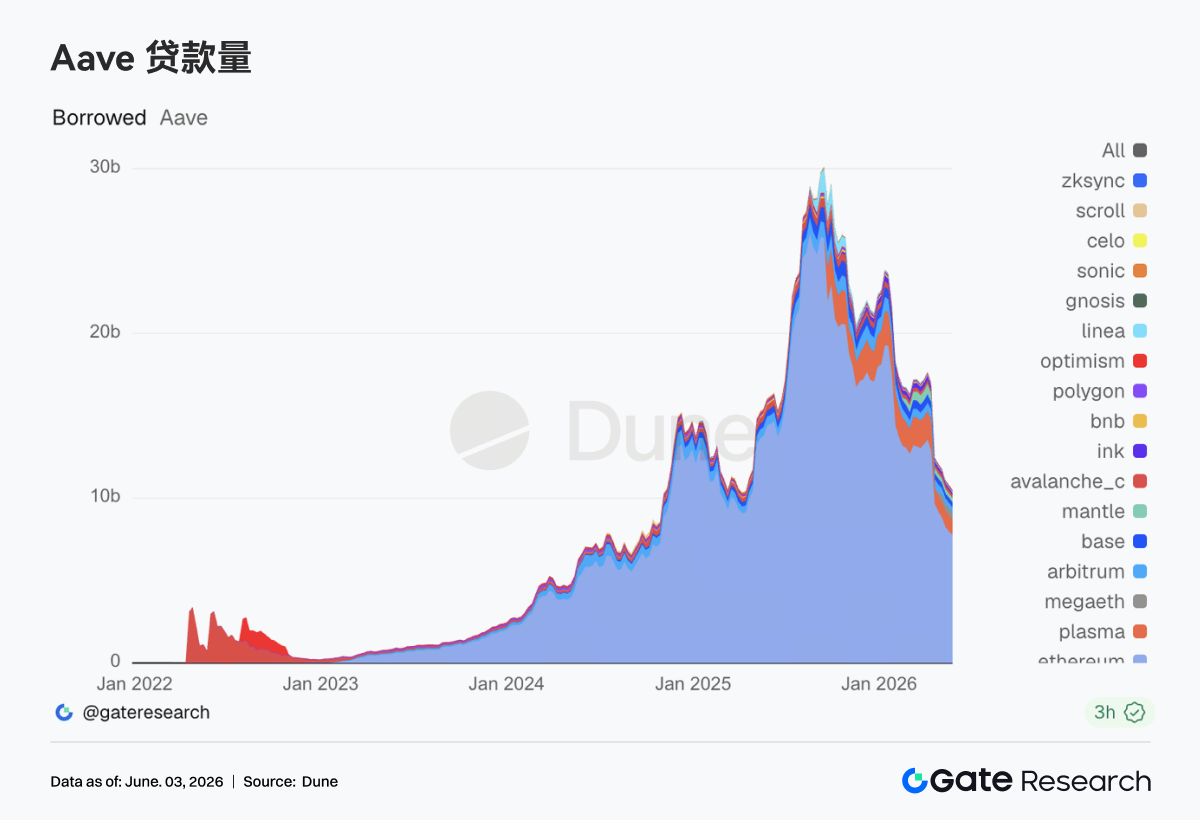
Aave's lending scale continued its slight decline last week. Major markets like the Ethereum main market, Plasma, Arbitrum, and MegaETH were all generally lower than the previous week's levels. While lending demand still exists, the market has not yet recovered to the expansion pace seen before the April risk event. The Ethereum market remains the dominant force. Plasma and MegaETH, which had previously absorbed some capital inflows, are also entering a consolidation phase. Overall, the current performance of the lending market aligns with the environment of cooling risk appetite. Concurrently, Aave is currently undergoing governance discussions on topics such as optimizing the USDC liquidity buffer mechanism, unfreezing WETH and restoring LTV, and rotating Emergency Guardian signers. This reflects the protocol's ongoing efforts to refine its risk management framework and institutionalize lessons learned from previous emergency response experiences.
3.5 Aave Core Asset Rates Return to Normal Range; Market Has Emerged from Liquidity Shock Phase
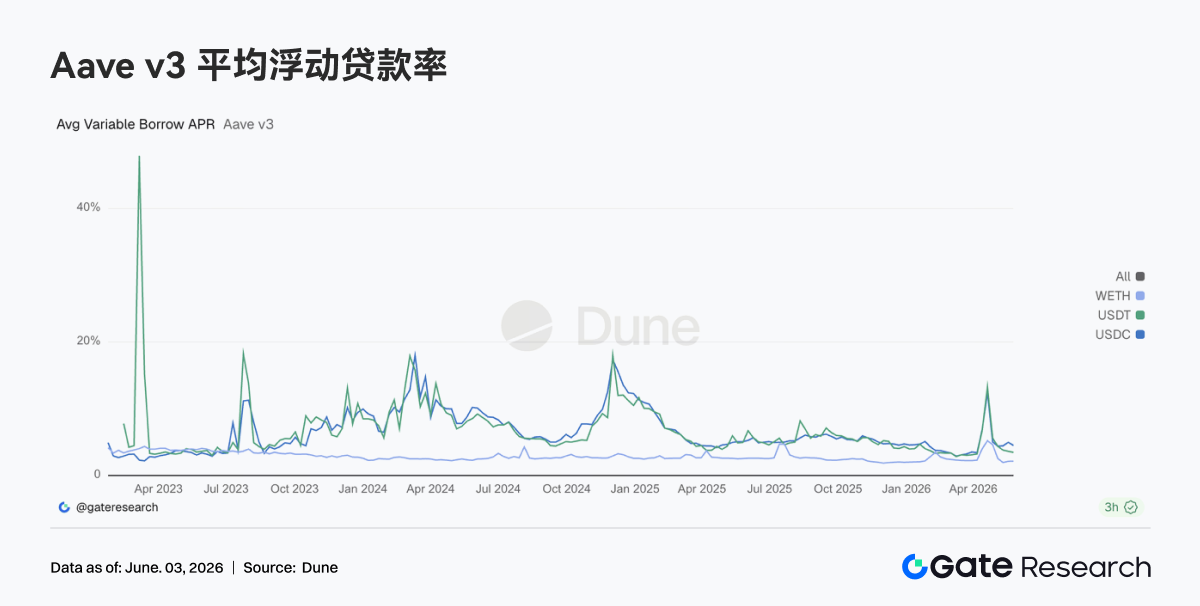
Borrowing rates for Aave's three core assets have generally stabilized. Borrowing costs for USDC and USDT have fallen compared to previous periods, while the WETH rate fluctuates narrowly at low levels. USDC remains the most closely watched pool. Although there were periodic rate increases during the week, they were short-lived, and the overall volatility was significantly milder than during the previous high-utilization phase. The governance discussion around enhancing the USDC liquidity buffer is fundamentally aimed at strengthening the protocol's stability and supply recovery capability during periods of extreme utilization. On the other hand, WETH borrowing costs did not increase significantly, suggesting that the market has not yet re-established large-scale directional ETH leveraged positions. In summary, current lending demand is more concentrated on stablecoin circulation, arbitrage, and position management. Panic sentiment has receded, but the market remains somewhat vigilant about tail risks.
3.6 Protocol Revenue Returns to Financial Services Drive; Stablecoins and Trading Infrastructure Show Greater Resilience
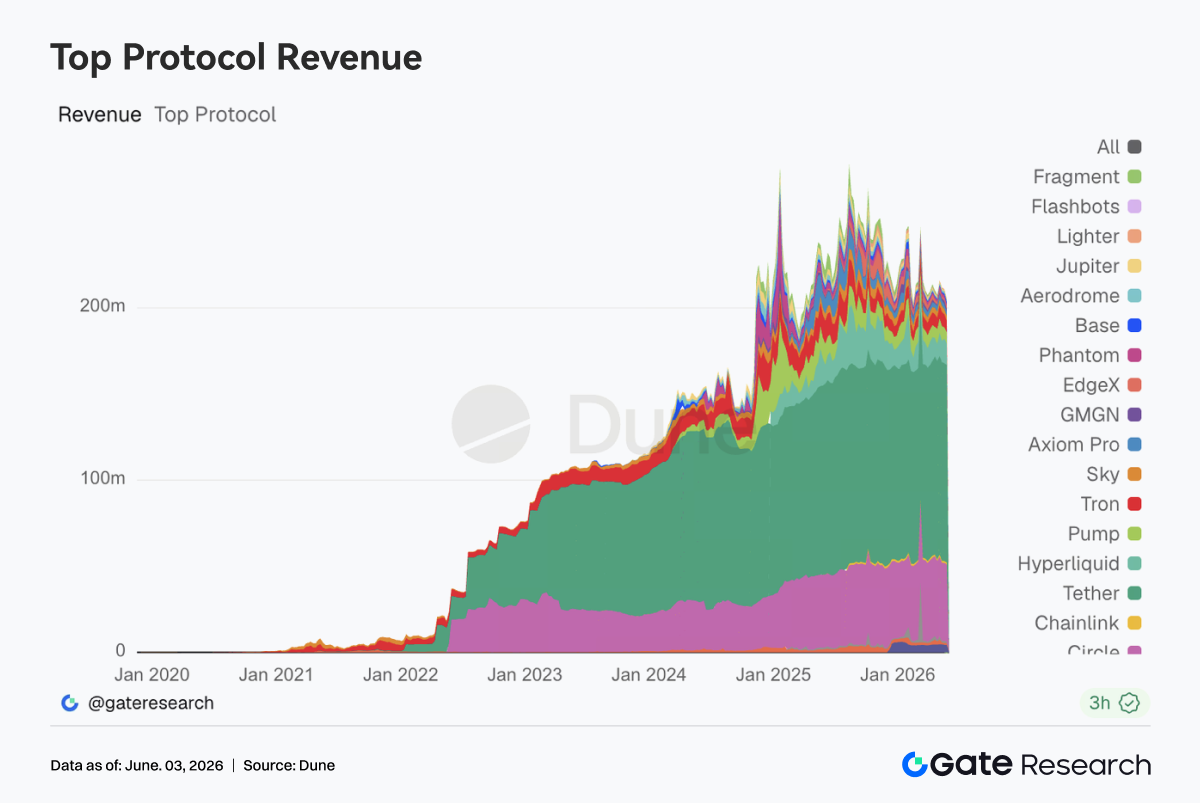
Tether and Circle continue to top the revenue rankings, with stablecoin issuance remaining the most stable source of cash flow in the entire industry. Hyperliquid's revenue, while slightly down from the previous week, remains high, indicating that on-chain derivatives trading demand has not weakened significantly. In contrast, protocols relying on front-end traffic and Meme trading activity, such as Pump, PumpSwap, Phantom, and Axiom, generally saw revenue declines as speculative sentiment gradually cooled. Aave V3's revenue saw a slight decline, broadly consistent with the trend of consolidating lending scale and normalizing interest rates, returning to a normal operational phase. Looking at the revenue structure, the key change last week is that the market is shifting back from a traffic-driven model to a financial services-driven one. Capital remains willing to pay for settlement capabilities, leverage demand, liquidity services, and trade execution efficiency, but the willingness to pay for pure traffic channels and short-term attention assets is declining.
4. Derivatives Tracking
4.1 BTC Funding Rate Stays Positive but Price Weakens, Leveraged Longs Under Pressure
From May 25 to May 31, 2026, BTC's price exhibited a structure of low-level consolidation following a unilateral decline. The price started the week near $77K but gradually weakened, falling to the $73K-$74K range between May 28 and May 31. Diverging from the price trend, the funding rate turned positive after May 26 and rose to a weekly high around May 28-29, peaking near 0.01.
This combination of "falling prices but persistently positive funding rates" indicates that the market did not quickly turn short-biased during the decline. Instead, there were signs of leveraged longs bottom-fishing or holding