比特币震荡蓄势延续上涨趋势,HYPE动能背驰考验将至|特邀分析


- Quan điểm cốt lõi: Bitcoin sau chuỗi tăng 7 sóng trên khung ngày đã bước vào giai đoạn dao động trong biên độ cao, tích lũy năng lượng để hình thành trung khu tăng thứ hai. Trung hạn nên đứng ngoài chờ xác nhận xu hướng. HYPE trên khung 4 giờ đang ở đoạn rời khỏi trung khu thứ hai của sóng tăng, việc động lượng có phân kỳ hay không sẽ quyết định liệu xu hướng có kết thúc.
- Yếu tố then chốt:
- Từ mức thấp 57.820 USD ngày 1/7, BTC đã hình thành chuỗi tăng 7 sóng. Trung khu A đầu tiên được cấu thành từ sự chồng lấn của ba đoạn (1-2) đến (3-4), đoạn rời khỏi (4-5) kết thúc quanh vùng 81.500 USD.
- Đoạn rời khỏi (4-5) có lực mạnh hơn đoạn đi vào (0-1), chưa xuất hiện phân kỳ động lượng, nhưng mô hình định lượng đã kích hoạt tín hiệu tử thần và cảnh báo đỉnh, báo hiệu thị trường bước vào vùng quá mua.
- BTC nhiều khả năng sẽ dao động ngang trong biên độ cao kéo dài 2-3 tuần, hình thành trung khu tăng thứ hai B bên trong biên độ. Vùng kháng cự chính là 82.850 USD, 84.500 USD và 90.000 USD; vùng hỗ trợ là 73.500-75.000 USD và 67.300-69.100 USD.
- HYPE từ mức thấp 51,11 USD ngày 2/8 đã hình thành chuỗi tăng 11 sóng. Việc so sánh lực giữa đoạn đi vào (78-79) và đoạn rời khỏi (82-83) của trung khu B là điểm mấu chốt. Nếu xuất hiện phân kỳ, xác suất đợt tăng này kết thúc sẽ tăng lên đáng kể.
- Tuần trước, lệnh mua ngắn hạn BTC (đòn bẩy 1x) được mở tại 77.388 USD và đóng tại 80.836 USD, mang lại lợi nhuận khoảng 4,45%, xác nhận tính hiệu quả thực chiến của tín hiệu cộng hưởng giữa mô hình giao dịch chênh lệch giá và mô hình định lượng động lượng.
Bitcoin continued its rebound structure initiated from the July 1 low this week, with the daily timeframe forming a seven-segment upward move and completing the construction of the first consolidation zone (Consolidation A). The market has now entered a phase of correction and re-rally following confirmation of "Endpoint 5." Top signals from quantitative models and overbought indicators suggest a high probability of a 2-3 week high-level range-bound consolidation in the short term, building momentum for the formation of the second upward consolidation zone (Consolidation B). Medium-term positions should remain in cash and on the sidelines until the effectiveness of the trend is confirmed, while short-term traders should rely on support/resistance ranges and execute flexible long/short plans A and B based on the resonance between Chan Theory structure and proprietary quantitative model signals.
As for HYPE, the rally on the 4-hour timeframe that began from the August 2 low has extended into the departure segment of the second consolidation zone (Consolidation B). The key to subsequent price action lies in comparing the momentum of this departure segment with the entry segment—whether momentum divergence emerges will determine whether this rally has concluded. Technical indicators are already showing overbought signals, so chasing highs warrants caution.
Additionally, a short-term BTC long position executed last week in accordance with our plan was successfully closed, realizing approximately 4.45% profit. This validates the real-world effectiveness of the resonance signals from the "Spread Trading Model" and "Momentum Quant Model." Trading details and a review are provided at the end of this article.
Weekly Trading Core Views Summary:
• BTC daily timeframe trend structure analysis (details in Part 1)
• BTC weekly outlook and medium/short-term trading strategy (details in Part 2)
• HYPE hourly timeframe trend structure analysis (details in Part 3)
• HYPE weekly outlook and short-term trading strategy (details in Part 4)
Market Validation of Last Week's Trading Strategy:
• BTC short-term trading results: Last week, we executed one short-term long position (1x leverage) per our plan, successfully realizing approximately 4.45% profit. (Details in Part 5)
I. Bitcoin Daily Timeframe Trend Structure Analysis
In last week's review, we introduced the Chan Theory analytical framework to systematically deconstruct and locate consolidation zones in BTC's rebound structure from the July 1 low of $57,820. This week, we continue with that framework, providing deeper analysis of the internal structure of this rebound from the perspectives of trend structure, consolidation zone evolution, and momentum divergence.
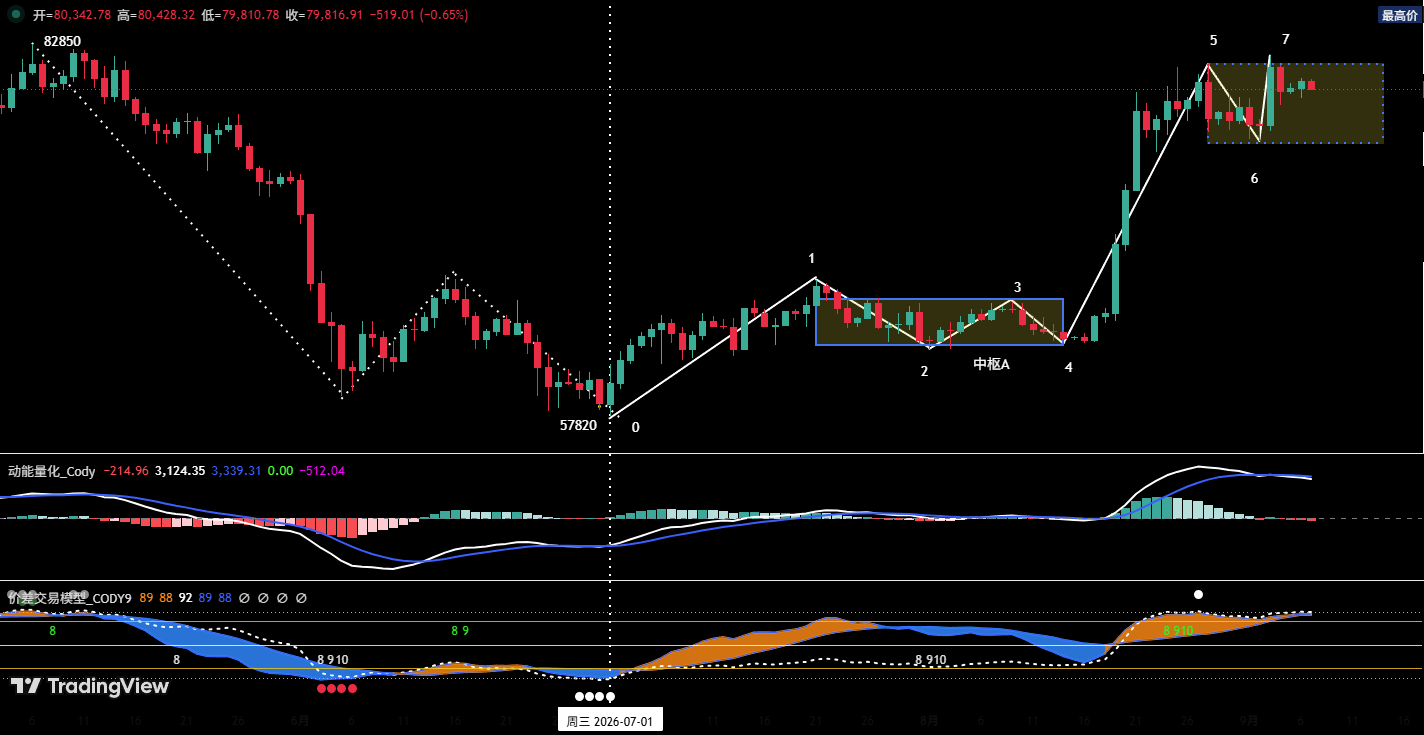
Figure 1 Bitcoin Daily K-Line Chart
1. As shown in (Figure 1): Since the rebound from the July 1 low, a clear seven-segment upward structure (0-1) through (6-7) has emerged. Among these, segments (1-2), (2-3), and (3-4) overlap to form the first upward consolidation zone (Consolidation A) of this rebound, with its upward departure segment (4-5) confirming termination around the $81,500 level.
2. Structural analysis based on Consolidation A:
① The rebound momentum of the departure segment (4-5) is significantly stronger than that of the entry segment (0-1), showing no momentum divergence between the two.
② According to our proprietary quantitative model monitoring: The dual signal lines of the "Momentum Quant Model" have formed a bearish crossover, while the "Spread Trading Model" has simultaneously triggered a top warning signal (white dot in the chart). The resonance of both signals indicates the market has entered an overbought zone.
③ Since the confirmation of "Endpoint 5," the market has exhibited a correction segment (5-6) and the currently unfolding rebound segment (6-7).
3. High-level range-bound consolidation to construct the second upward consolidation zone is the high-probability scenario
Combining the three points above: Starting from "Endpoint 5," the market will likely enter a 2-3 week high-level range-bound consolidation pattern. The bulls will use the wide-range fluctuation to flush out profits accumulated during the earlier sharp rally, while randomly constructing the second upward consolidation zone (Consolidation B) within the range. Once Consolidation B is complete, another upward move departing from Consolidation B is expected to begin.
II. Bitcoin Weekly Outlook and Trading Strategy
1. BTC Weekly Price Outlook
Core view for this week: High probability of range-bound consolidation, with close attention to the termination point of daily "Endpoint 7."
2. Key Resistance Levels
• First resistance zone: $81,700–$82,850 (previous key level)
• Second resistance zone: Around $84,500 (previous key resistance zone)
• Third resistance zone: $90,000 area (key psychological level)
3. Key Support Levels
• First support level: $73,500–$75,000 zone (previous key support)
• Second support level: $67,300–$69,100 zone (previous key support)
4. Weekly Trading Strategy (excluding unexpected news impacts)
① Medium-term strategy:
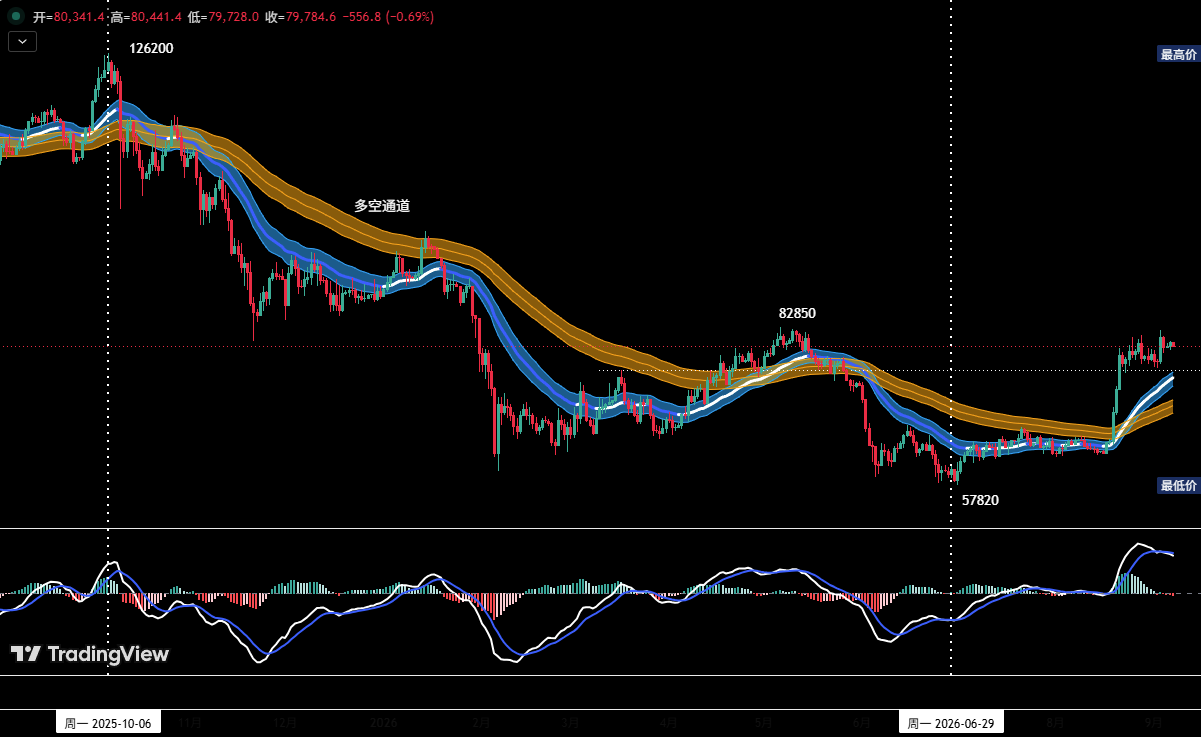
Figure 2 Bitcoin_Daily K-Line Chart: (Position Monitoring Model)
Position Monitoring Model: As shown in (Figure 2), the price has broken through the "Long/Short Channel," causing a change in the short-term market structure. However, the pullback-confirmation phase following the breakout has not yet been completed, and the validity of the trend reversal remains unconfirmed. Given that the signal loop is not yet closed, medium-term positions remain at zero, primarily staying in cash on the sidelines.
② Short-term strategy: Use 30% of position capital, set stop-losses, and seek "spread" trading opportunities based on support and resistance levels. (Use 30-minute/60-minute timeframes as the trading cycle.)
③ For short-term operations, to dynamically adapt to complex market evolution, we have prepared two trading plans in advance: Plan A and Plan B.
• Plan A: Light long position at strong support zones.
• Entry: When the price pulls back to the first or second key support levels mentioned above, shows a clear stabilization pattern, and quantitative models simultaneously issue bottom signals, establish a long position of approximately 30%.
• Risk control: Set an initial stop-loss.
• Exit: When the price rebounds near key resistance levels, combined with model signals, gradually close the position to lock in profits.
• Plan B: Light short position at strong resistance zones.
• Entry: When the price rallies to the key resistance levels above, shows a clear rejection pattern, and quantitative models simultaneously issue top signals, establish a short position of approximately 30%.
• Risk control: Set an initial stop-loss.
• Exit: When the price corrects near key support levels, combined with model signals, gradually close the position to lock in profits.
III. HYPE Hourly Timeframe Trend Structure Analysis
In this week's review, we introduce the Chan Theory analytical framework to systematically deconstruct and analyze HYPE's rebound structure that began from the August 2 low of $51.11.
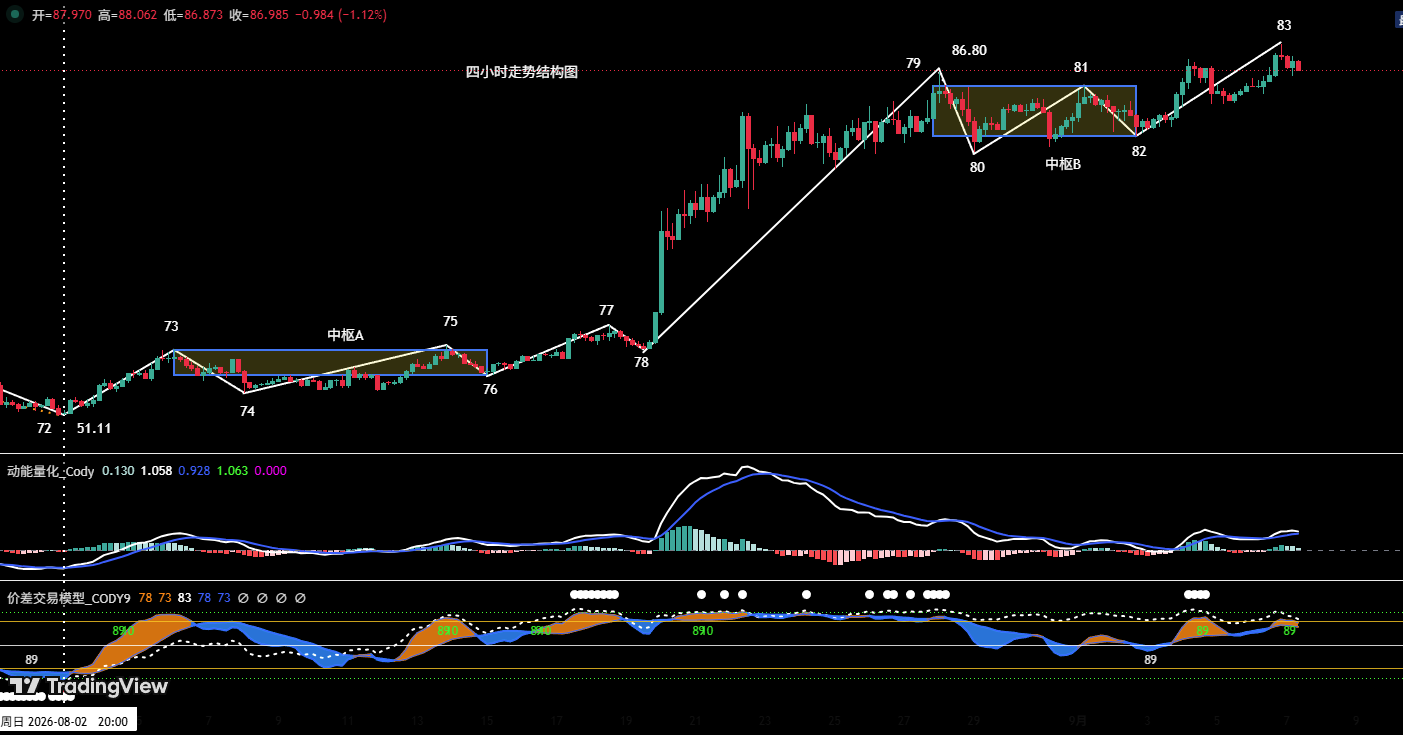
Figure 3 HYPE_4H K-Line Chart
1. Trend structure overview
As shown in (Figure 3): The upward move in HYPE that began from the August 2 low of $51.11 can be clearly divided on the 4-hour timeframe into an 11-segment upward structure from (72-73) through (82-83).
2. Structural analysis based on Consolidation A
• Composition of Consolidation A: The overlap of segments (73-74), (74-75), and (75-76) forms the first upward consolidation zone (Consolidation A).
• Momentum analysis: Comparing the upward momentum of the entry segment (72-73) and departure segment (78-79) of Consolidation A, the departure segment shows significantly stronger upward momentum than the entry segment, with no momentum divergence observed between them. Based on this analysis, after segment (78-79) concludes, the price is expected to continue upward following a period of consolidation and accumulation.
3. Structural analysis based on Consolidation B
• Composition of Consolidation B: The overlap of segments (79-80), (80-81), and (81-82) forms the second upward consolidation zone (Consolidation B). For Consolidation B, (78-79) serves as its entry segment, and (82-83) serves as its departure segment.
• Current positioning and forward projection: The price is currently trading within the departure segment (82-83). Going forward, the key observation is the momentum comparison between this departure segment and the entry segment. If the departure segment concludes with momentum divergence against the entry segment, the probability of this rally—initiated from "Endpoint 72"—coming to an end increases significantly. Conversely, if no divergence occurs, the price is expected to extend its original uptrend after a period of consolidation, reaching new highs.
IV. HYPE Weekly Outlook and Short-Term Trading Strategy
1. HYPE Weekly Price Outlook
① Key resistance levels:
• First resistance level: Around $100
② Key support levels:
• First support level: $83–$85 zone;
• Second support level: $77–$80 zone;
③ Core view for this week: Focus on observing the termination point of the departure segment (82-83) of Consolidation B, and compare its upward momentum with the entry segment (78-79) at termination to confirm whether momentum divergence has formed.
2. HYPE Short-Term Trading Strategy for This Week
① Position holders (long): Those who established positions in the $50–$52 zone earlier per the trading plan are advised to raise their initial stop-loss to around $80 to lock in accrued profits. Strictly adhere to stop-loss discipline and hold positions awaiting further upside.
② Those without positions: If the price pulls back to effectively stabilize at the key $83–$85 support zone and clear long signals emerge, consider lightly testing a long position, with a stop-loss set simultaneously and strictly enforced.
③ Risk warning: The recent consecutive rally has accumulated significant profit-taking pressure, and multiple technical indicators are in overbought territory. Therefore, avoid chasing highs at current levels and be alert to short-term correction risks.
V. Bitcoin Short-Term Trading Review (08.31–09.06):
We strictly followed our trading plan, executing one short-term long position last week based on trading signals from our proprietary "Spread Trading Model" and "Momentum Quant Model," achieving a total trading profit of approximately 4.45%.
1. Short-term trading records: (See Table 1)
Bitcoin short-term trading details summary: (Leverage: 1x)
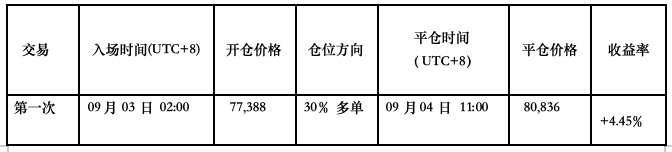
Table 1
2. Short-term trading review: (See Figure 4)
• Entry strategy:
a. The price had completed a full correction structure earlier. When the price declined to the area above $76,000, signs of stabilization emerged, and the K-line formed a "bottom fractal" pattern;
b. The "Momentum Quant Model" generated a bullish momentum divergence signal, resonating with the bottom-up signal from the "Spread Trading Model."
Based on the resonance of these multi-factor signals, we established a 30% long position at $77,388.
• Exit strategy:
a. When the price rallied to around $82,850, lagging signals appeared, and the K-line formed a "top fractal" pattern;
b. The "Spread Trading Model" continuously released top warning signals (white dots + green dots), after which the signal band (blue) crossed below the horizon line (green), forming a top resonance signal with the "Momentum Quant Model."
Based on the above top resonance signals, we fully closed the position at approximately $80,836.
• Summary: This trade realized a profit of approximately 4.45%.
3. Short-term trading illustrated
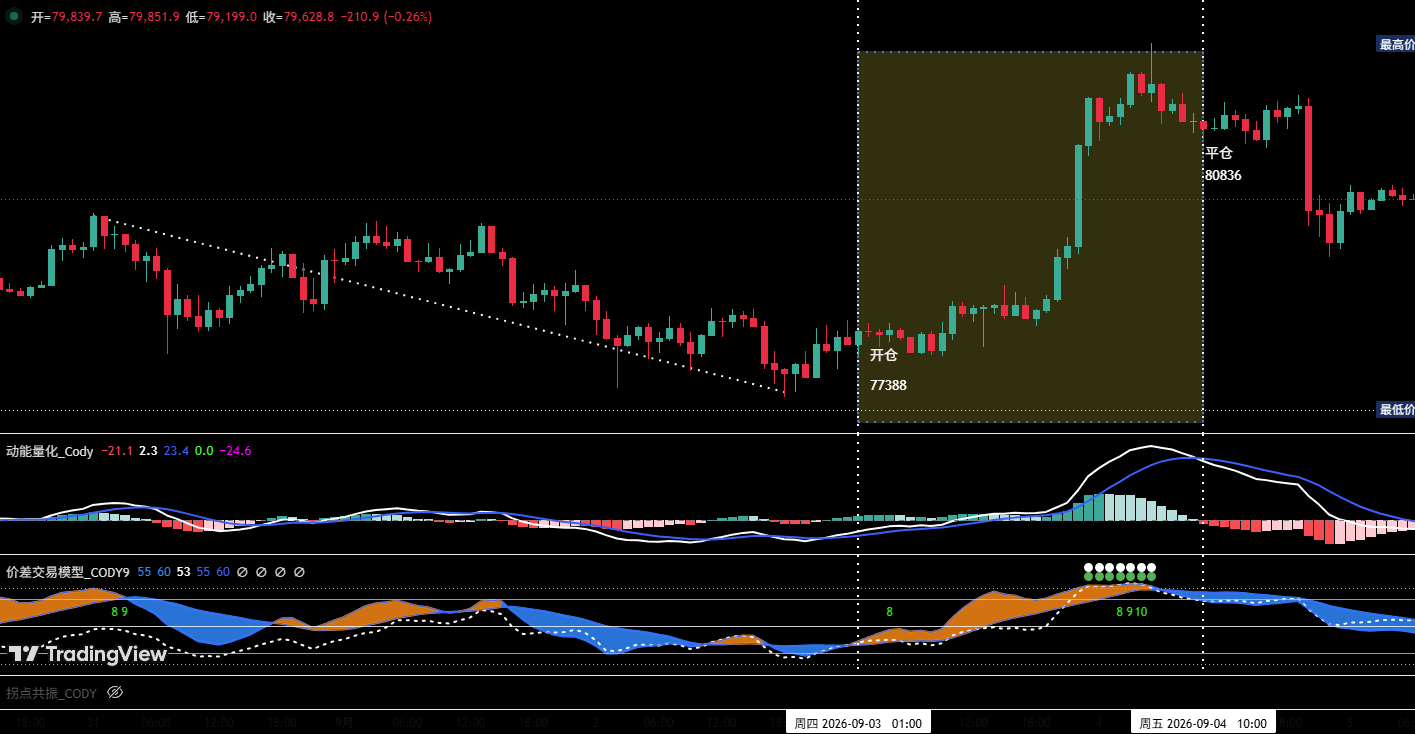
Figure 4 BTC_60min K-Line Chart: (Momentum Quant Model + Spread Trading Model)
VI. Special Reminders
1. Upon entry: Set the initial stop-loss immediately.
2. When profit reaches 1%: Move the stop-loss to the entry cost price (breakeven point) to protect principal.
3. When profit reaches 2%: Move the stop-loss to the 1% profit level.
4. Continuous tracking: Thereafter, for every additional 1% gain in price, move the stop-loss up by 1% accordingly, dynamically protecting and locking in profits.
Financial markets change rapidly, and all market analyses and trading strategies require dynamic adjustments. All views, analytical models, and trading strategies mentioned in this article are derived from personal technical analysis and serve solely as personal trading logs. They do not constitute any investment advice or basis for trading decisions. Markets carry risk; invest with caution. Please do not make decisions based solely on this content.