Google ร่วง 12.64% ขณะที่ Eli Lilly ทำสถิติสูงสุดใหม่ ตลาดเริ่มคำนวณบัญชีเงินสดของ AI


- ประเด็นหลัก:ความต้องการ AI ยังไม่เห็นสัญญาณเย็นลง แต่ตรรกะการกำหนดราคาของตลาดได้เปลี่ยนจาก "เรื่องราวการเติบโต" ไปสู่ "ผลตอบแทนเป็นเงินสด" ยักษ์ใหญ่ที่ขยายการใช้จ่ายด้านทุนอย่างต่อเนื่องแต่กระแสเงินสดอิสระกลายเป็นลบเผชิญการกำหนดราคาประเมินมูลค่าใหม่ ขณะที่กลุ่มการแพทย์ การเงิน และพลังงานที่มีเส้นทางสู่กำไรชัดเจนได้รับความนิยมจากเงินทุน
- ปัจจัยสำคัญ:
- Google Q3 มีรายได้ 1.27577 แสนล้านดอลลาร์ เพิ่มขึ้น 25% เมื่อเทียบปีต่อปี รายได้คลาวด์เพิ่ม 103% แต่การใช้จ่ายด้านทุนอยู่ที่ 5.1355 หมื่นล้านดอลลาร์ เพิ่มขึ้น 114% เมื่อเทียบปีต่อปี กระแสเงินสดอิสระไหลออกสุทธิ 9.065 พันล้านดอลลาร์ ร่วง 12.64% ในวันเดียว มูลค่าตลาดหายไปประมาณ 5 แสนล้านดอลลาร์
- Amazon AWS มีรายได้เพิ่ม 39.3% แต่ต่ำกว่าที่บางส่วนคาดไว้เล็กน้อย ใน 12 เดือนที่ผ่านมากระแสเงินสดอิสระไหลออกสุทธิ 4.24 หมื่นล้านดอลลาร์ ยังคงรักษาแผนการใช้จ่ายด้านทุนปี 2026 ที่ 2.2 แสนล้านดอลลาร์
- สี่บริษัทยักษ์ใหญ่ใช้จ่ายด้านทุนรวมกันปีนี้เกิน 7.2 แสนล้านดอลลาร์ ประมาณสามเท่าของสองปีก่อน โดยสามในนั้นมีกระแสเงินสดอิสระกลายเป็นลบ Meta มีกระแสเงินสดอิสระรายไตรมาสติดลบเป็นครั้งแรกนับตั้งแต่เข้าตลาด
- Eli Lilly Q3 มีรายได้ 2.4397 หมื่นล้านดอลลาร์ เพิ่มขึ้น 39% เมื่อเทียบปีต่อปี Mounjaro และ Zepbound ร่วมกันสร้างรายได้ประมาณ 66% กระแสเงินสดอิสระไหลเข้าสุทธิ 8.219 พันล้านดอลลาร์ ปรับเพิ่มคาดการณ์ทั้งปีเป็นครั้งที่สามในปีนี้ หุ้นพุ่ง 6.57% ทำสถิติสูงสุดใหม่
- กระแสเงินทุนสนับสนุน: กองทุนป้องกันความเสี่ยงเพิ่มการถือครองกลุ่มการแพทย์ 1.69 พันล้านดอลลาร์ในสองสัปดาห์และลดการถือครองเซมิคอนดักเตอร์ กองทุนธีมการแพทย์ในตลาดหุ้นสหรัฐมีเงินไหลเข้าสุทธิ 4.72 พันล้านดอลลาร์ในสองสัปดาห์
- จุดสำคัญที่ต้องจับตาต่อไป: รายงานทางการเงินของ NVIDIA กลางเดือนพฤศจิกายนเพื่อทดสอบความต้องการพลังประมวลผล คำแนะนำการใช้จ่ายด้านทุนรอบถัดไปของยักษ์ใหญ่คลาวด์เพื่อยืนยันจุดเปลี่ยนของผลตอบแทน การประชุมนโยบายการเงินของธนาคารกลางสหรัฐวันที่ 9 ธันวาคมซึ่งมีผลต่อการประเมินมูลค่ากระแสเงินสดในอนาคต
1. Google Plunges 12.64%: The Faster AI Grows, What Is the Market Actually Worried About?
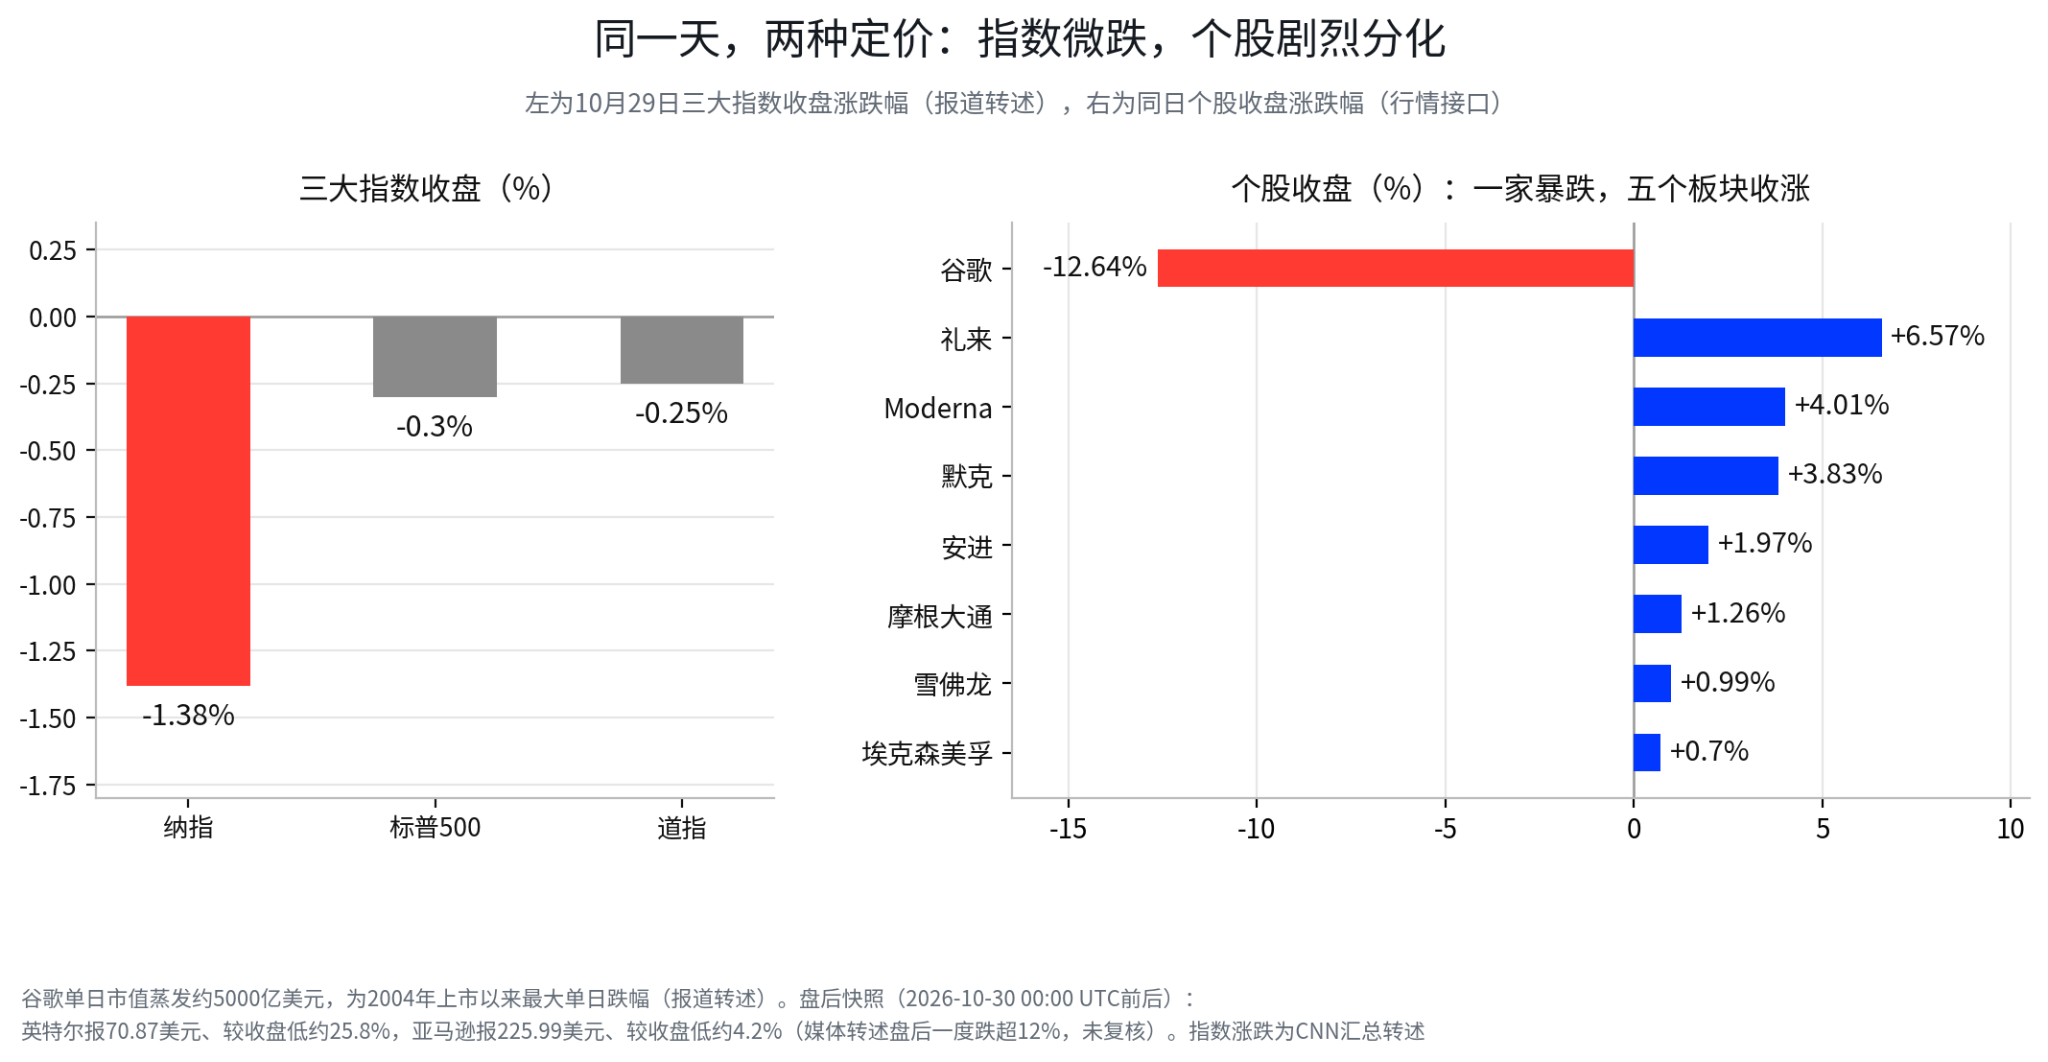
After the U.S. stock market closed on October 29, a clear divergence emerged between individual stocks and sectors. Google closed down 12.64%, with approximately $500 billion in market capitalization wiped out in a single day—the largest single-day decline since its 2004 IPO (as reported). Intel and Amazon subsequently released their earnings, and their after-hours share prices also fell significantly. In contrast to the weakness in tech stocks, Eli Lilly rose 6.57% to a record high, while the healthcare, financial, and energy sectors also broadly closed higher. That day, the Nasdaq fell 1.38%, the S&P 500 fell 0.30%, and the Dow fell 0.25% (as summarized by CNN). At the index level, there was no widespread panic—what truly changed was the market's judgment on the earnings quality of different companies. Against the backdrop of ever-expanding AI investment, the market is beginning to care more about when these investments will actually translate into cash returns, and this shift ran through all of the day's market action.
In Google's earnings report, the revenue portion was actually not bad. Third-quarter revenue reached $127.577 billion, up 25% year-over-year, marking the 13th consecutive quarter of double-digit growth. Google Cloud revenue was $30.709 billion, up 103% year-over-year, significantly exceeding market expectations. This shows that enterprise customer demand for cloud computing and AI infrastructure remains strong, and there is no obvious cooling on the demand side of the AI supply chain. What truly disappointed the market was the slowing growth of the advertising business and the cash flow pressure brought by continuously expanding capital expenditures.
The problem with the advertising business is that users are searching more and more frequently, but monetization has not kept pace. Third-quarter search and other advertising revenue was $63.35 billion, up 12% year-over-year, below market expectations of nearly $65 billion, with growth slowing markedly from 17% in the previous quarter. Google also disclosed that search volume year-over-year growth has reached its highest level in nearly five years—users have not reduced their searches, yet the growth in search volume has not brought a proportional increase in advertising revenue. According to reports from The Economist and other media, some queries under AI modes have lower advertising monetization efficiency than traditional search results pages. As users gradually become accustomed to getting answers directly through AI, Google needs to solve not only how to get more people to use AI, but also how to maintain the commercial value of its advertising business under new interaction formats.
Compared with the slowing advertising growth, the cash flow pressure brought by capital expenditures is the core issue behind this decline. Google's third-quarter capital expenditures reached $51.355 billion, up about 114% year-over-year, exceeding the quarter's operating cash flow of $42.290 billion. Free cash flow therefore turned to a net outflow of $9.065 billion, while the market had previously expected a slight net inflow of about $2.7 billion. More noteworthy is that this is no longer a one-off fluctuation. Google's second-quarter free cash flow was a net outflow of $5.855 billion, compared with a net inflow of $24.461 billion in the same period last year, and the cash flow gap is widening. Management also stated that capital expenditures in 2027 will continue to be higher than in 2026, but did not provide a clear timetable for the investment peak or when spending will peak.

Increased capital expenditures are not inherently a bad thing. For cloud computing and AI infrastructure companies, building data centers ahead of time, purchasing servers, and expanding network capacity are important means of competing for long-term market share. The key is whether the new investment can generate sufficient revenue and profit. If the cloud business continues to grow rapidly and profit margins improve with scale, then the current cash flow pressure may just be a阶段性 phenomenon in the expansion cycle. But if capital expenditures consistently outpace operating cash flow and cloud business revenue growth cannot be converted into corresponding cash returns, investors will have to reassess the company's future free cash flow and return on capital. The valuation repricing Google experienced this time is actually aimed at the payback period of AI investment, not at AI capabilities themselves.
2. Intel and Amazon: Both Fell After Hours, but the Problems Behind Them Are Different
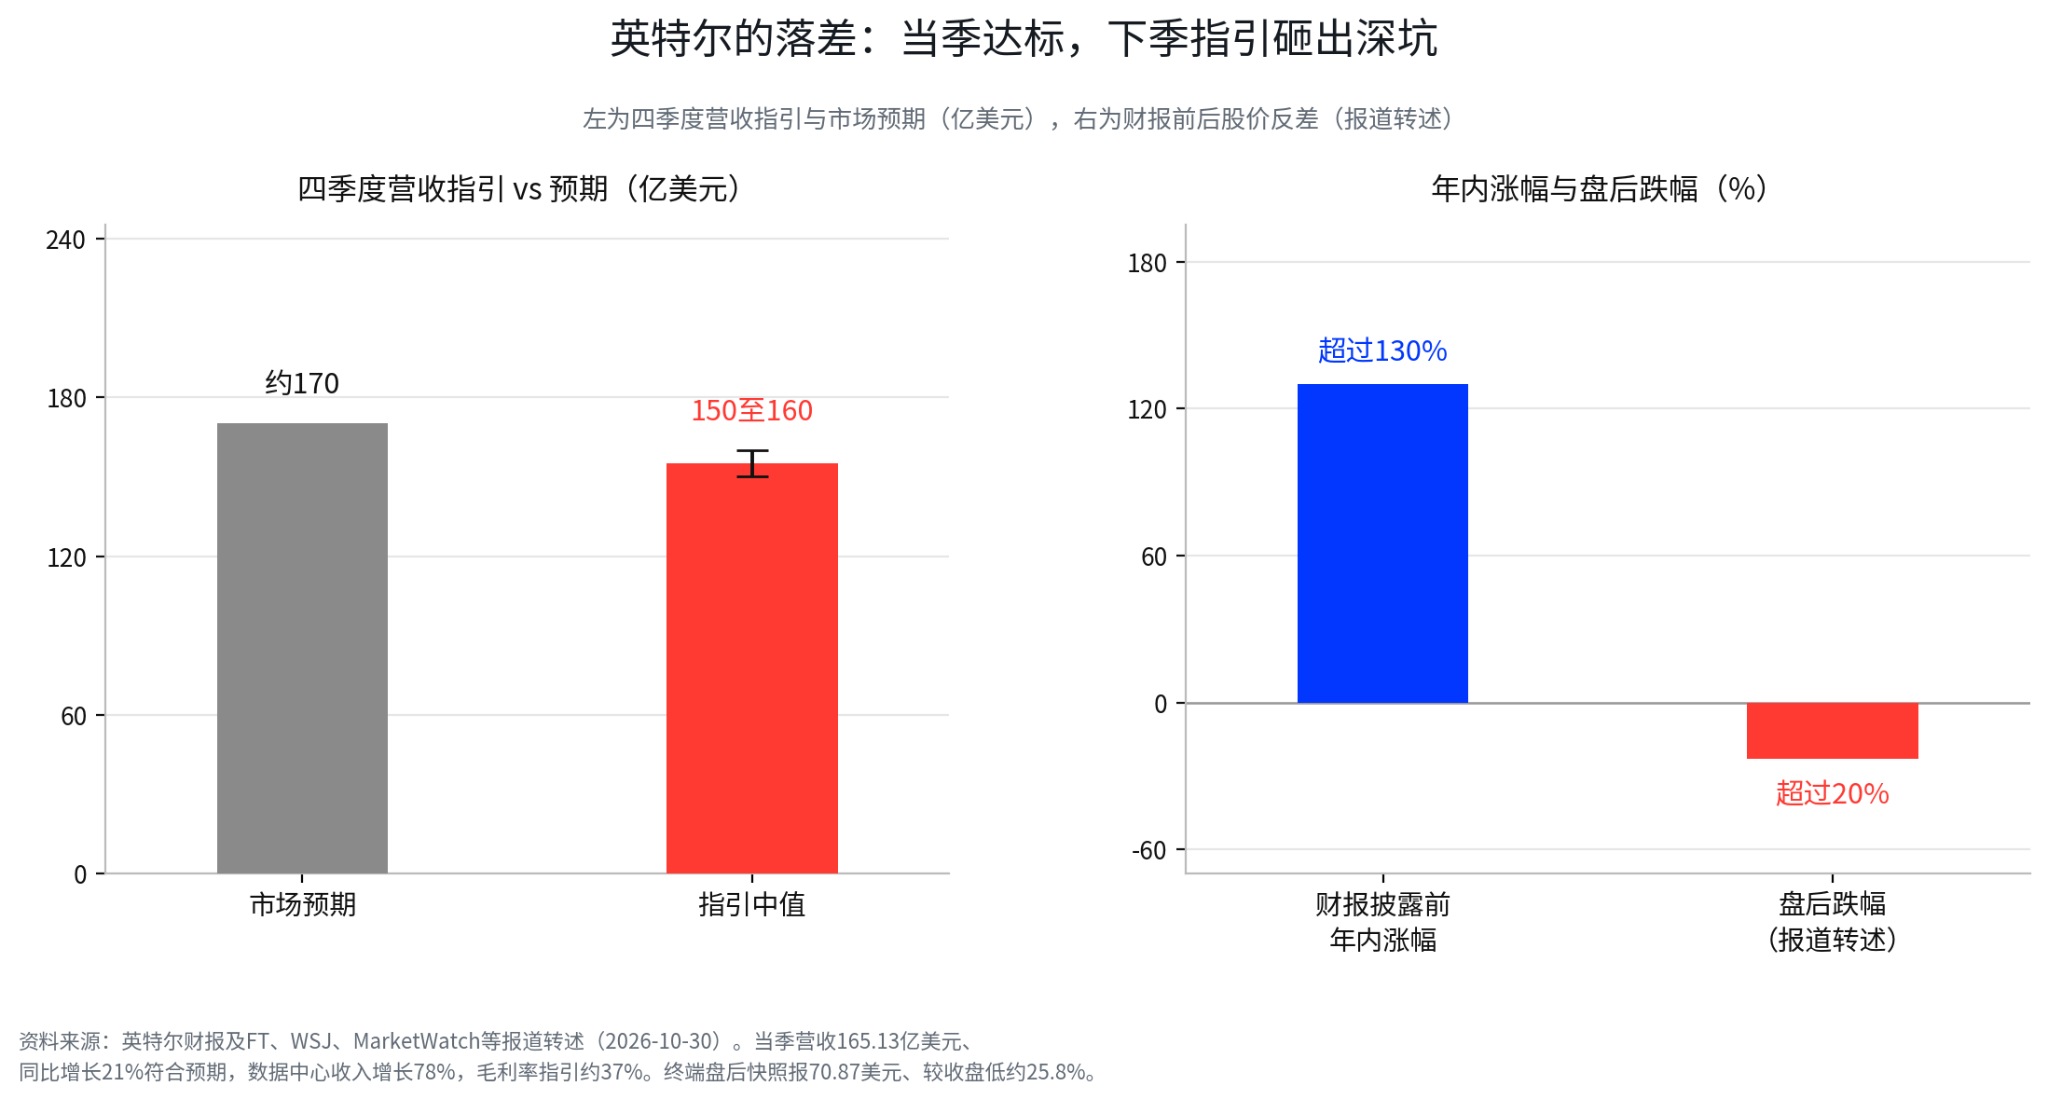
Both Intel and Amazon were weak after hours, but the pressures need to be viewed separately. Intel fell more than 20% after hours at one point, but its quarterly results were actually not bad: third-quarter revenue was $16.513 billion, up 21% year-over-year, and data center business revenue rose 78%, indicating that demand for AI inference server chips is materializing. What really pressured the stock was fourth-quarter guidance: revenue of $15 billion to $16 billion, below Wall Street expectations of about $17 billion, with gross margin guidance cut to 37%. Management's explanations included weak PC demand that may persist into the first half of 2027, rising memory chip prices driving up costs, and an accident at its Israel factory affecting fourth-quarter revenue by about $300 million.
More critical is that expectations were too high. Before the earnings report, Intel had already risen more than 130% year-to-date; meeting expectations for the quarter was not enough—any guidance below expectations could easily trigger profit-taking. The after-hours share price fell more than 20% at one point, with a terminal snapshot at $70.87, about 25.8% below the closing price. So this decline is more like a guidance shock combined with valuation adjustment under high expectations, and cannot be simply attributed to AI capital expenditure repricing. However, it also shows that the market's tolerance for AI supply chain assets is declining: AI concepts or forward demand alone are no longer enough to command a valuation premium; companies must deliver actual performance and earnings guidance.
Amazon fell more than 7% after hours at one point. Amazon faces the same capital return problem as Google, with pressure concentrated on three things: revenue, cash flow, and capital expenditures. Third-quarter total revenue was $201.9 billion, slightly below market expectations. AWS revenue was $46 billion, up 39.3% year-over-year, higher than 37% in the previous quarter, but still short of the 40%-plus that some institutions had hoped for; holiday season sales guidance was also weak, raising concerns about short-term revenue growth. More important than revenue is cash flow. Operating cash flow over the past 12 months was $168.3 billion, up 29% year-over-year, but free cash flow was a net outflow of $42.4 billion. The gap between the two comes almost entirely from the consumption of operating cash by capital investments such as data centers.
Amazon has not scaled back investment and is maintaining its 2026 capital expenditure plan of $220 billion, with CEO Jassy saying spending will increase significantly in 2027. For investors, AWS still has strong growth momentum, but achieving returns will require continued large-scale investment in the future. Revenue below expectations, weak holiday guidance, deeply negative free cash flow, and expectations of further capital expenditure expansion together constituted the main post-earnings pressure. The after-hours share price fell more than 7% at one point, with media reports citing declines of more than 12% at one point, and a terminal snapshot at $225.99, about 4.2% below the closing price.
Looking at Google and Amazon together, what the market is worried about has changed. There is no problem with AI demand; the problem is that infrastructure construction may be entering a phase where investment scale keeps growing while the payback period remains unclear. According to statistics from The New York Times and other media, Google, Amazon, Microsoft, and Meta will spend a combined total of more than $720 billion in capital expenditures this year, roughly three times the level two years ago; three of the four companies have already seen free cash flow turn negative, and Meta also recorded its first negative quarterly free cash flow since going public. Both upstream suppliers and cloud service providers are expanding investment, and the market will naturally ask: with such massive capital expenditures, how much return can ultimately be created for shareholders?
3. Eli Lilly Hits a Record High: The Market Begins to Reprice for Cash Flow Certainty
While tech giants were busy explaining capital expenditures and investment returns, Eli Lilly delivered a completely different earnings report. The company's third-quarter revenue was $24.397 billion, up 39% year-over-year, above market expectations of about $22.6 billion, with adjusted earnings per share of $7.48, also exceeding market expectations of $6.49. Core growth still came from GLP-1 drugs: Mounjaro global revenue reached $10.72 billion, up 65% year-over-year, and Zepbound revenue was $5.35 billion, up 49% year-over-year, with the two products together contributing about 66% of quarterly revenue. As sales continued to exceed expectations, the company raised its full-year revenue guidance from the previous $85 billion to $87 billion to $91 billion to $92 billion—the third upward revision this year (company earnings and media reports).
The difference between Eli Lilly and Google is not in growth rate, but in the way growth is realized. Google needs to invest tens of billions of dollars first to build data centers and purchase equipment, and then gradually recover costs through cloud services and AI products. Eli Lilly's core revenue comes directly from already-occurring drug sales and prescription demand. The company's third-quarter free cash flow was a net inflow of $8.219 billion, with volume growth of 53%; although factors such as medical insurance access reduced net prices by about 15%, volume growth was still enough to drive overall revenue growth of 39%. At a stage when the market is beginning to re-examine corporate returns on capital, a business model like Eli Lilly's that can directly convert product demand into revenue and cash flow naturally attracts more capital attention.
Of course, good cash flow performance does not mean Eli Lilly has no valuation risk. Its trailing price-to-earnings ratio was previously estimated at about 45 times, which is not cheap; medical insurance access may continue to压低 net prices, and competition in the weight-loss drug market may also affect future market share. For investors hoping to track Eli Lilly, the key things to watch next are whether prescription volume and sales growth can continue, whether the decline in net prices begins to outpace volume growth, and whether revenue guidance and free cash flow can continue to corroborate each other. Especially after the share price has already hit a record high, one should not chase short-term gains solely because of capital inflows into the healthcare sector; further support from volume-price data and earnings expectations is still needed.
4. Capital Has Not Left U.S. Stocks; It Is Re-selects Sources of Profit
Google and Eli Lilly, one falling and one rising, are not just about two stocks—similar changes could be seen at the sector level that day. The healthcare sector performed notably well that day, with Moderna up 4.01%, Merck up 3.83%, and Amgen up 1.97%. Most financial stocks closed higher, with JPMorgan up 1.26%. Energy stocks also edged up, with ExxonMobil up 0.70% and Chevron up 0.99% (market data interface). Brent crude and WTI remained near $114 and $102, respectively (as reported), but energy stocks did not show large gains matching oil prices, indicating that what capital favored that day was not just geopolitical premium, but also the operating cash flow that energy companies are already able to deliver.
Healthcare, financials, and energy make money in different ways, but they share one thing in common: it is relatively easy to see where revenue and cash flow come from. Pharmaceuticals rely on drug sales and prescription demand, banks rely on interest spreads, trading, and credit, and energy relies on oil prices, output, and cost control. They also have their own risks—banks fear deteriorating credit quality, energy fears falling oil prices, and pharmaceuticals fear drug pricing and competitive pressure. But compared with tech companies still massively expanding AI infrastructure, the profit realization path of these businesses is easier to estimate. At a stage when investors are re-emphasizing current cash flow, this "clarity" itself attracts capital.
Institutional capital data also provides supporting evidence. Goldman Sachs holdings tracking shows that over the past two weeks, hedge funds collectively increased their healthcare sector holdings by $1.69 billion while reducing semiconductors. EPFR data shows that U.S. healthcare-themed funds saw net inflows of $4.72 billion over the past two weeks, with the pace of inflows at a relatively high level this year. However, two weeks of inflows are not enough to prove that the market has made a long-term shift from tech to healthcare. A more reasonable interpretation is that institutions are increasing allocations to sectors with relatively visible earnings such as healthcare. Going forward, it remains to be seen whether healthcare funds can continue to attract capital and whether semiconductor reductions will further expand. Baird strategists share a similar view: volatility in the AI narrative does not mean the market's overall growth logic has been broken; capital may spread from a handful of giants whose valuations are supported by high capital expenditures to assets with more diversified sources of profit.
Therefore, the current market action should not be simply understood as a capital confrontation between "AI versus non-AI." AI demand remains strong—Google Cloud revenue growth of 103% and Amazon AWS growth of 39.3% both show that enterprise demand for cloud computing and AI compute has not disappeared. What has changed is that the market is beginning to distinguish between "the industry has demand" and "companies can make money." Compute suppliers being able to earn revenue from orders and product sales does not mean all cloud service providers can recoup the cost of building data centers in the short term. Those who can continue to command valuation premiums in the future are more likely to be companies that can prove their investments ultimately turn into profit and free cash flow, rather than necessarily the companies with the largest AI investment scale.
5. Three Upcoming Milestones Will Determine How the Market Continues to Screen AI Assets
For investors, what is more valuable now than guessing when Google will rebound is tracking the next three time points that can validate the market's judgment. The first is Nvidia's earnings report in mid-November, which will directly test whether AI compute demand remains strong. Data center revenue, orders and delivery conditions, and whether gross margins can remain stable are all indicators to watch. If revenue and orders continue to exceed expectations, it will show that AI infrastructure demand still has support, and earnings expectations across the compute supply chain will not be easily revised downward quickly. But if order growth slows markedly, or gross margins are affected by product mix and competitive pressure, the market may further lower expectations for AI hardware growth. Nvidia beating expectations does not mean the investment return problems of cloud giants are automatically solved—compute suppliers making money and cloud service providers recouping capital expenditures remain two different financial issues.
The second milestone is the next round of capital expenditure guidance from cloud giants, which may be more important than revenue growth alone. For Google, Amazon, Microsoft, and Meta, investors need to observe capital expenditures, cloud business revenue, operating margins, and free cash flow together. If cloud revenue keeps growing, capital expenditure growth gradually slows, and operating cash flow begins to better cover investment spending, it will indicate that AI infrastructure construction may be moving from the investment phase to the return phase, and tech stocks may regain valuation support. Conversely, if companies continue to raise capital expenditure plans while cloud business growth does not improve accordingly and the free cash flow gap further widens, then even if share prices rebound, it cannot be concluded that valuation pressure has been lifted.
The third milestone is the Federal Reserve's interest rate meeting on December 9, which will affect the relative valuation of cash flows across different maturities. When interest rates remain high, profits that can only be realized many years later are worth relatively less when converted to today's value; high-valuation growth stocks that depend on long-term returns are more vulnerable to pressure, while companies with relatively stable earnings and dividends may gain a relative advantage. At that time, it will be necessary to combine the rate decision, the dot plot, Powell's remarks, and changes in U.S. Treasury yields to judge whether the cost of capital will rise further. However, rate cuts are not necessarily bullish for tech stocks either; if rate cuts are caused by a rapid weakening of the economy, corporate revenue and earnings expectations may be revised downward simultaneously, and valuation improvement may not offset fundamental deterioration.
6. What Sectors and Indicators Is the Market Watching?
From a directional perspective, the current scope of observation can be divided into three groups. The first group is AI infrastructure and cloud computing leaders, where the focus is not simply on the magnitude of share price pullbacks, but on separately verifying compute demand and capital returns. For Nvidia and AMD, the main things to watch are orders, data center revenue, and gross margins; for cloud giants, it is necessary to track cloud business revenue growth, profit margins, capital expenditures, and free cash flow. The second group is healthcare assets, with a focus on GLP-1 product prescription volume, net prices, and full-year guidance; for other pharmaceutical companies, earnings sustainability needs to be judged in light of their respective product pipelines and sales performance. The third group is financial and energy assets; for JPMorgan (JPM), it is necessary to track net interest margin, credit losses, and trading revenue, while for traditional energy, the focus should be on oil prices, output, capital discipline, and free cash flow.
These directions are not suitable to be simply classified as the same kind of defensive allocation. Eli Lilly still has valuation and competition risks, banks need to face the credit cycle, and energy companies are affected by oil price fluctuations. A more reasonable approach is to build watchlists based on each company's earnings drivers and, in light of earnings reports and changes in capital flows, judge whether it is worth increasing allocation weights.