比特币调整信号确认,HYPE多空分歧加剧|特邀分析


- 核心观点:上周比特币在67,300美元附近触顶后确认进入b浪调整,当前核心关注点在于回抽65,700美元阻力位后的方向选择;HYPE正争夺60~63.5美元关键阻力带,其突破或承压将决定后续是开启修复行情还是延续探底。
- 关键要素:
- 比特币日线a浪反弹已于7月21日在66,955美元触顶,当前b浪调整中,后续c浪反弹需守住57,820美元支撑。
- 4小时级别显示,反弹进入段与离开段形成动能背驰,确认调整需求;短期关注币价在65,700美元的测试情况。
- 本周BTC核心支撑位于60,950~61,500美元区域,若跌破则下看57,820美元;关键阻力仍为65,700~67,300美元。
- HYPE自72.97美元调整至56.47美元,当前处于反弹段;若突破60~63.5美元阻力带,则可能开启修复行情。
- 若HYPE未能有效突破60~63.5美元,则可能构建下跌中枢后跌破56.47美元,向52~55美元区域寻求支撑。
- 上周比特币短线空单操作(66,319美元开仓,65,192美元平仓)盈利1.70%,基于价差与动能量化模型信号执行。
This week, the daily-level wave A rebound of Bitcoin may have peaked on July 21st, with the market now transitioning into the wave B correction phase. HYPE, on the other hand, is at a critical juncture, contending with the key resistance zone of $60–$63.5, and its path remains unclear. The following provides a multi-timeframe structural review and trading strategy for BTC and HYPE this week, as well as a market validation of last week's short-term trades, for reference.
Core Views on This Week's Trading:
• BTC Multi-timeframe Structure Analysis (Detailed in Part 1)
• BTC This Week's Market Forecast and Medium/Short-term Trading Strategy (Detailed in Part 2)
• HYPE Hourly Structure Analysis (Detailed in Part 3)
• HYPE This Week's Market Forecast and Short-term Trading Strategy (Detailed in Part 4)
Market Validation of Last Week's Trading Strategy and Core Views:
• BTC Market Forecast Validation: Last week's article clearly stated that there was a high probability the first leg (wave A) of the daily-level rebound for Bitcoin would end near $67,300. Our forecast was accurately validated by the market.
• BTC Short-term Trade Results: Bitcoin completed one short-term short trade last week (1x leverage), successfully realizing a return of approximately 1.70%. (Detailed in Part 5)
• HYPE Market Forecast Validation: Last week's article clearly indicated that if the price rebounded early in the week, it could be seen as a retest confirmation after breaking below the key support zone ($62–$63.5). Currently, market movement aligns highly with our judgment.
1. Bitcoin Multi-timeframe Structure Analysis
1. Bitcoin Daily-level Structure Analysis: (Based on market analysis after May 6th)
Figure 1 Bitcoin Daily K-line Chart
①, As shown in (Figure 1): Since the correction began from the high of $82,850 on May 6th, the daily chart has presented a four-segment corrective structure: (0-1), (1-2), (2-3), (3-4).
②, From a daily structure perspective: The first leg (wave A) of the rebound starting from the low of $57,820 on July 1st may have ended on July 21st, with the rebound height reaching $66,955 during this period.
③, If the wave A rebound has ended, the market is currently in wave B correction. After the wave B correction concludes (on the condition that its low doesn't break below $57,820), there could be a potential wave C rebound, which may aim to challenge the resistance zone near $67,300 again.
2. In-depth Analysis of Bitcoin Hourly-level Structure: (Based on the 4-hour timeframe)
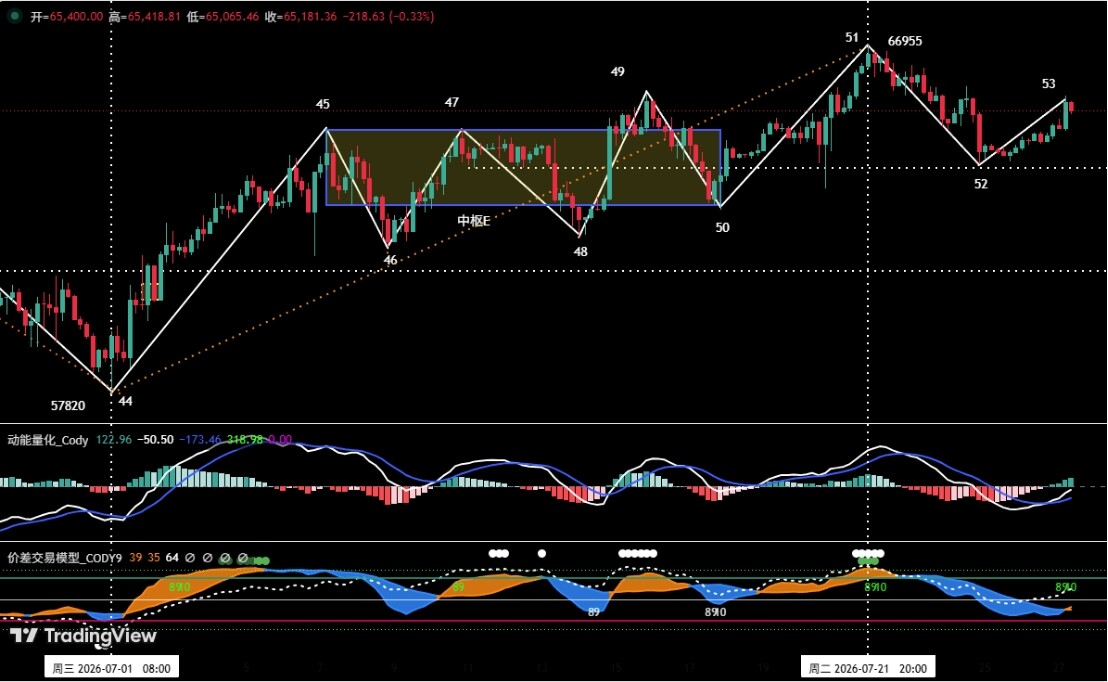
Figure 2 Bitcoin 4-hour K-line Chart
①, Within the 4-hour timeframe, the rebound starting from the low on July 1st (Endpoint 44, approx. $57,820) to July 21st (Endpoint 51, approx. $66,955) is clearly divided into seven segments, from (44-45) to (50-51). Among these, segments (45-46), (46-47), (47-48), (48-49), and (49-50) overlap, forming a "five-segment" center, E.
②, Based on structure analysis: Comparing the entry segment (44-45) and exit segment (50-51) of Center E, we can clearly judge that the rebound momentum of the exit segment is significantly weaker than the entry segment, forming a momentum divergence between the two. Therefore, the rebound starting from "Endpoint 44" may have concluded at "Endpoint 51", with a high probability of a subsequent correction.
③, The correction from "Endpoint 51" has already run two segments: (51-52) and (52-53). The current trend can be seen as a retest confirmation phase after the price broke below $65,700.
2. Bitcoin This Week's Market Forecast and Trading Strategy
1. BTC Market Forecast for This Week:
Core Views for This Week:
①, Monitor the test result around the retest of $65,700.
②, Watch for support strength when the price dips into the $60,950–$61,500 zone.
2. Key Resistance Levels:
• First Resistance Zone: $65,700–$67,300 (Previous key resistance area)
• Second Resistance Zone: $69,500–$71,000 (Previous key resistance area)
3. Key Support Levels:
• First Support: Near $63,700 (Previous key support level)
• Second Support: $60,950–$61,500 zone (Previous key support zone)
• Third Support: Near $57,820 (Previous key support level)
4. Trading Strategy for This Week (Excluding Unexpected News Impact)
①, Medium-term Strategy:
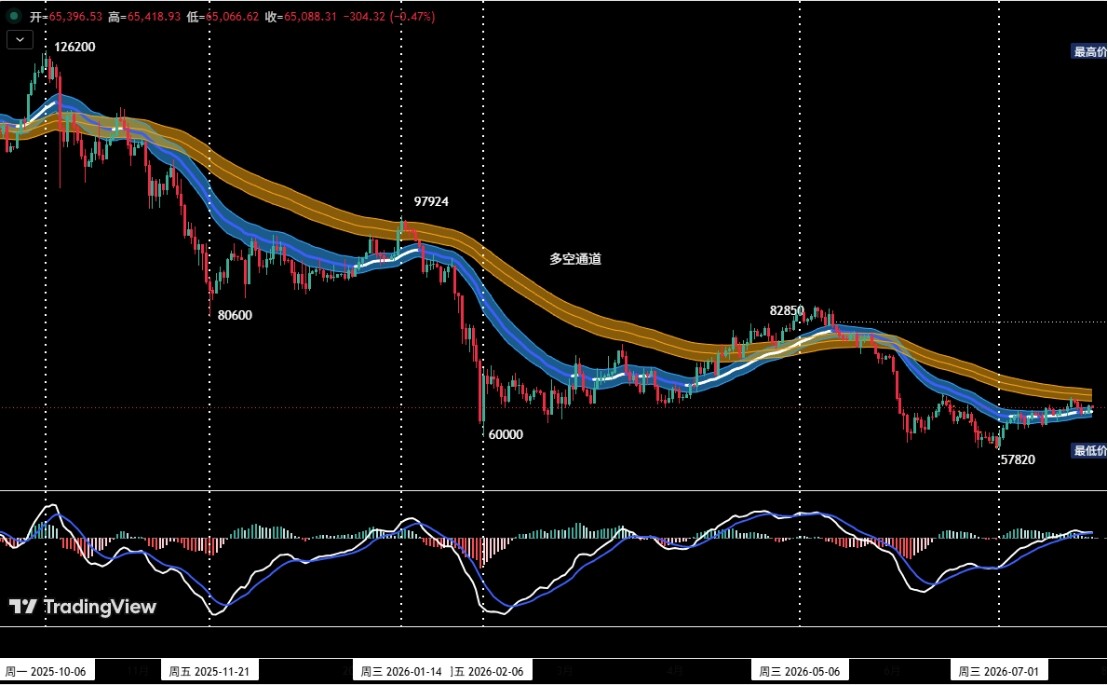
Figure 3 Bitcoin Daily K-line Chart: (Position Monitoring Model)
Position Monitoring Model: As shown in (Figure 3), the current price has effectively broken below the "Bull/Bear Channel," confirming a market structure shift to a bearish dominant pattern. According to the established trading plan: when the price rebounded near $67,000 and showed signs of stagnation, synchronized with a top signal from our proprietary quantitative model, we executed the strategy strictly, increasing the medium-term short position to around 40%.
②, Short-term Strategy: Use 30% position, set stop losses, and look for "spread" trading opportunities based on support and resistance levels. (Using 30-minute/60-minute charts as the trading timeframe).
③, For short-term operations, to dynamically respond to complex market developments, we have prepared two specific plans A and B in advance.
Plan A: Test Shorting in the Strong Resistance Zone.
• Entry: If the price rebounds to the $65,700–$67,300 zone and meets resistance, coupled with a top signal from the quantitative model, we can establish a short position of around 30%.
• Risk Control: Set initial stop-loss.
• Exit: When the correction reaches key support levels and aligns with signals from the quantitative model, we can gradually close the position to lock in profits.
Plan B: Light Long Position in the Strong Support Zone.
• Entry: If the price adjusts to above the previous low of $57,820 and shows signs of stabilization, coupled with a bottom signal from the quantitative model, we can establish a long position of around 30%.
• Risk Control: Set initial stop-loss.
• Exit: When the rebound reaches key resistance levels and aligns with model signals, we can gradually close the position to lock in profits.
3. HYPE Hourly Structure Analysis
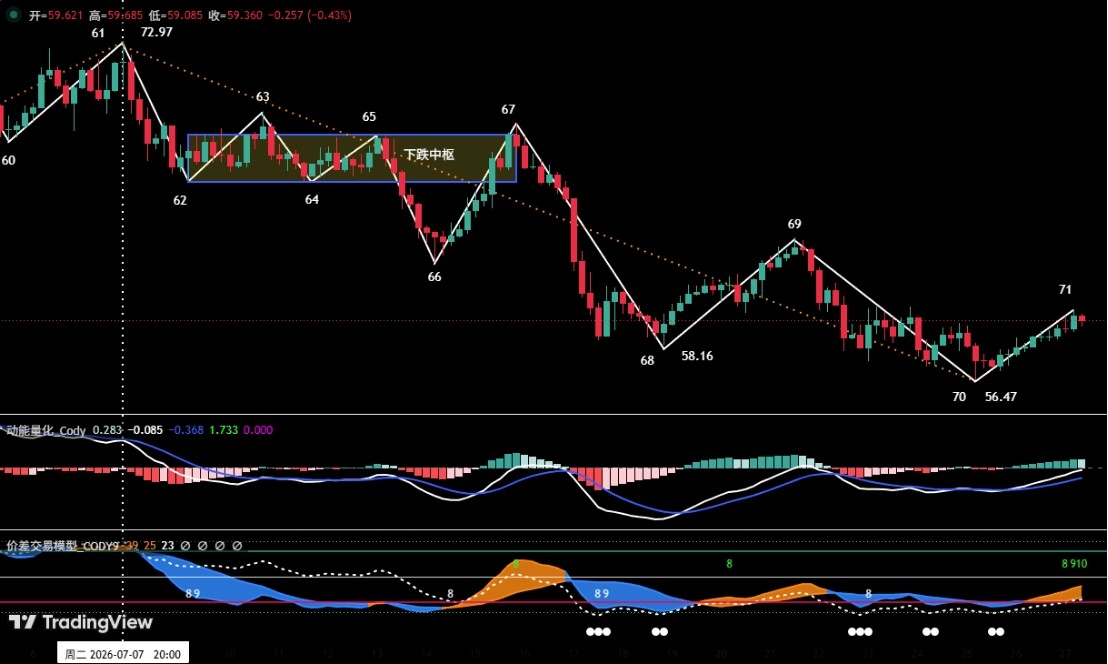
Figure 4 HYPE 4-hour K-line Chart
1, As shown in (Figure 4), HYPE has been correcting from the high of $72.97 on July 7th to the present (i.e., from Endpoint 61 to Endpoint 71). On the 4-hour chart, it can be subdivided into a ten-segment corrective structure. Among these, five segments—62-63, 63-64, 64-65, 65-66, and 66-67—overlap, forming a "five-segment" descending center.
2, The market is currently running the (70-71) rebound segment. Subsequently, two possible scenarios may emerge:
Path 1: $56.47 marks the end of the correction, initiating a recovery rally. The correction starting from July 7th ($72.97) ended on July 24th ($56.47), and the current rebound is a technical recovery phase against that decline.
Path 2: Continuing the downtrend after forming a "descending center." A new "descending center" is currently being built, after which the market will continue its previous downtrend, breaking below the previous low of $56.47 to seek further support.
3, In summary, close attention should be paid in the short term to the test results of the $60–$63.5 resistance zone and the defensive strength of support near $56.47. The outcome of the battle at these two price levels will be the key basis for determining which path the market will take.
4. HYPE This Week's Market Forecast and Short-term Trading Strategy
1. HYPE Market Forecast for This Week:
①, Key Resistance Levels:
• First Resistance Zone: $60–$63.5
• Second Resistance Zone: $68–$69.5
• Third Resistance: Near $72.97
②, Key Support Levels:
• First Support: Near $56.47;
• Second Support Zone: $52–$55;
Core Views for This Week: Closely monitor the test results of the $60–$63.5 resistance zone and the support strength near $56.47.
2. HYPE Short-term Trading Strategy for This Week: For short-term trading this week: If the price rebounds to the $60–$63.5 zone and shows clear correction signals, investors are advised to consider entering a light short position, strictly adhering to stop-loss discipline, keeping position size within 20%.
5. Bitcoin Short-term Trading Performance Review
Strictly following the trading plan and based on signals from our proprietary "Spread Trading Model" and "Momentum Quantitative Model," we completed one short-term short trade last week, achieving a total trading profit of approximately 1.70%.
1. Short-term Trading Record: (See Table 1) Bitcoin Short-term Trade Details Summary:
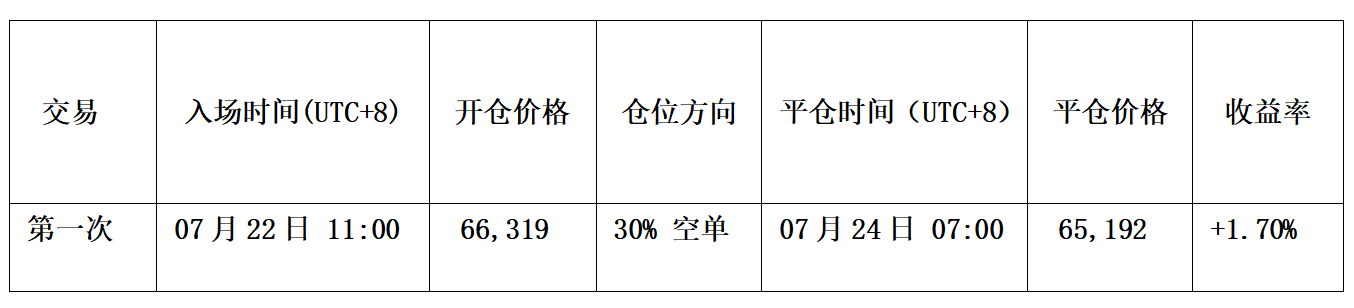
Table 1
2. Short-term Trade Review: (See Figure 5)
• Entry Strategy:
a, When the price rebounded near $67,000, it showed signs of stagnation, with the K-line forming a "top divergence" pattern;
b, The "Spread Trading Model" triggered a strong top warning signal (white dot + green dot), and subsequently, the signal band (blue) in the chart broke below the skyline (green), issuing a sell signal;
This was synchronized with an adjustment signal from the "Momentum Quantitative Model" resonance. Therefore, we established a 30% short position at $66,319.
• Exit Strategy:
a, When the price fell near $64,500 and showed signs of stabilization, the K-line formed a "bottom divergence" pattern;
b, The "Spread Trading Model" triggered consecutive bottom warning signals (red dots), and subsequently, the signal band (orange-yellow) in the chart broke above the horizon (magenta), forming a bottom resonance signal with the "Momentum Quantitative Model";
Therefore, we closed the entire position near $65,192.
• Summary: This trade successfully yielded a profit of approximately 1.70%.
3. Short-term Trade Diagram

Figure 5 BTC 60-minute K-line Chart: (Momentum Quantitative Model + Spread Trading Model)
6. Special Reminders:
- When opening a position: Immediately set an initial stop-loss.
- When profit reaches 1%: Move the stop-loss to the cost price (break-even point) to ensure principal safety.
- When profit reaches 2%: Move the stop-loss to the 1% profit level.
- Continuous Tracking: For every subsequent 1% profit increase, move the stop-loss up by 1% to dynamically protect and lock in profits.
Financial markets are volatile and subject to rapid change; all market analysis and trading strategies require dynamic adjustment. All views, analytical models, and trading strategies mentioned in this article are derived from personal technical analysis and are solely for use as personal trading logs. They do not constitute any investment advice or operational basis. Market risk exists, and investment requires caution; please do not make decisions based solely on this content.