






Gate Institutional Weekly: BTC Price Recovers From Lows, Gate US Stock Trading Volume Hits New Cyclical High


- Core View: Last week, risk appetite in the crypto market recovered, with both BTC and ETH posting gains. Net outflows from ETF funds slowed, and the ETH ETF saw a slight net inflow first. Market structure diverged, with the Solana ecosystem (PumpSwap) contributing the main incremental volume. Stablecoin supply remained weak, but institutional channels are favorable for USDC.
- Key Factors:
- The US June non-farm payroll data came in below expectations, cooling market concerns about Fed rate hikes and driving a broad rally in risk assets. BTC rose ~6.8% WoW, and ETH rose ~12.2% WoW.
- BTC spot ETFs saw net outflows of approximately $1.787 billion for the week, but recorded net inflows on a single day on July 2nd. ETH spot ETFs saw net outflows of approximately $13.65 million for the week, with funds beginning to tentatively return.
- DEX trading structures diverged: Uniswap volumes declined, while Solana ecosystem's PumpSwap showed high growth, making Solana a primary source of capital and protocol revenue growth.
- Overall stablecoin supply remained weak, but USDC benefitted from positive developments such as custody support from BNY Mellon, strengthening institutional channels. USDC borrowing rates on Aave rose, indicating recovering demand for high-quality USD liquidity.
- BTC Open Interest (OI) recovered from approximately $20.5 billion to $22 billion. Funding rates remained positive, indicating leveraged capital re-entering the market. The Options 25D Skew recovered from deeply negative levels, and DVOL fell back to 39-40, suggesting a cooling of volatility expectations.
- Gate platform's June spot trading volume grew 49.39% MoM. CrossEx Q2 trading volume hit a record high, with WoW growth of 26% in the first week of July. Institutional and platform trading activity continues to increase.
Summary
• Crypto market risk appetite improves, with BTC up ~6.8% and ETH up ~12.2% for the week. ETF flows remain net negative overall, but ETH ETFs have seen a small initial reversal, with institutional sentiment shifting from panic redemptions to tentative rebalancing.
• TradFi stock Perp trading volume share rises to ~60%-65%. Gate TradFi weekly trading volume remains high at ~$85 billion, with CFDs still contributing ~95% of volume. US stock trading volume grows for the fifth consecutive week, hitting a new phase high.
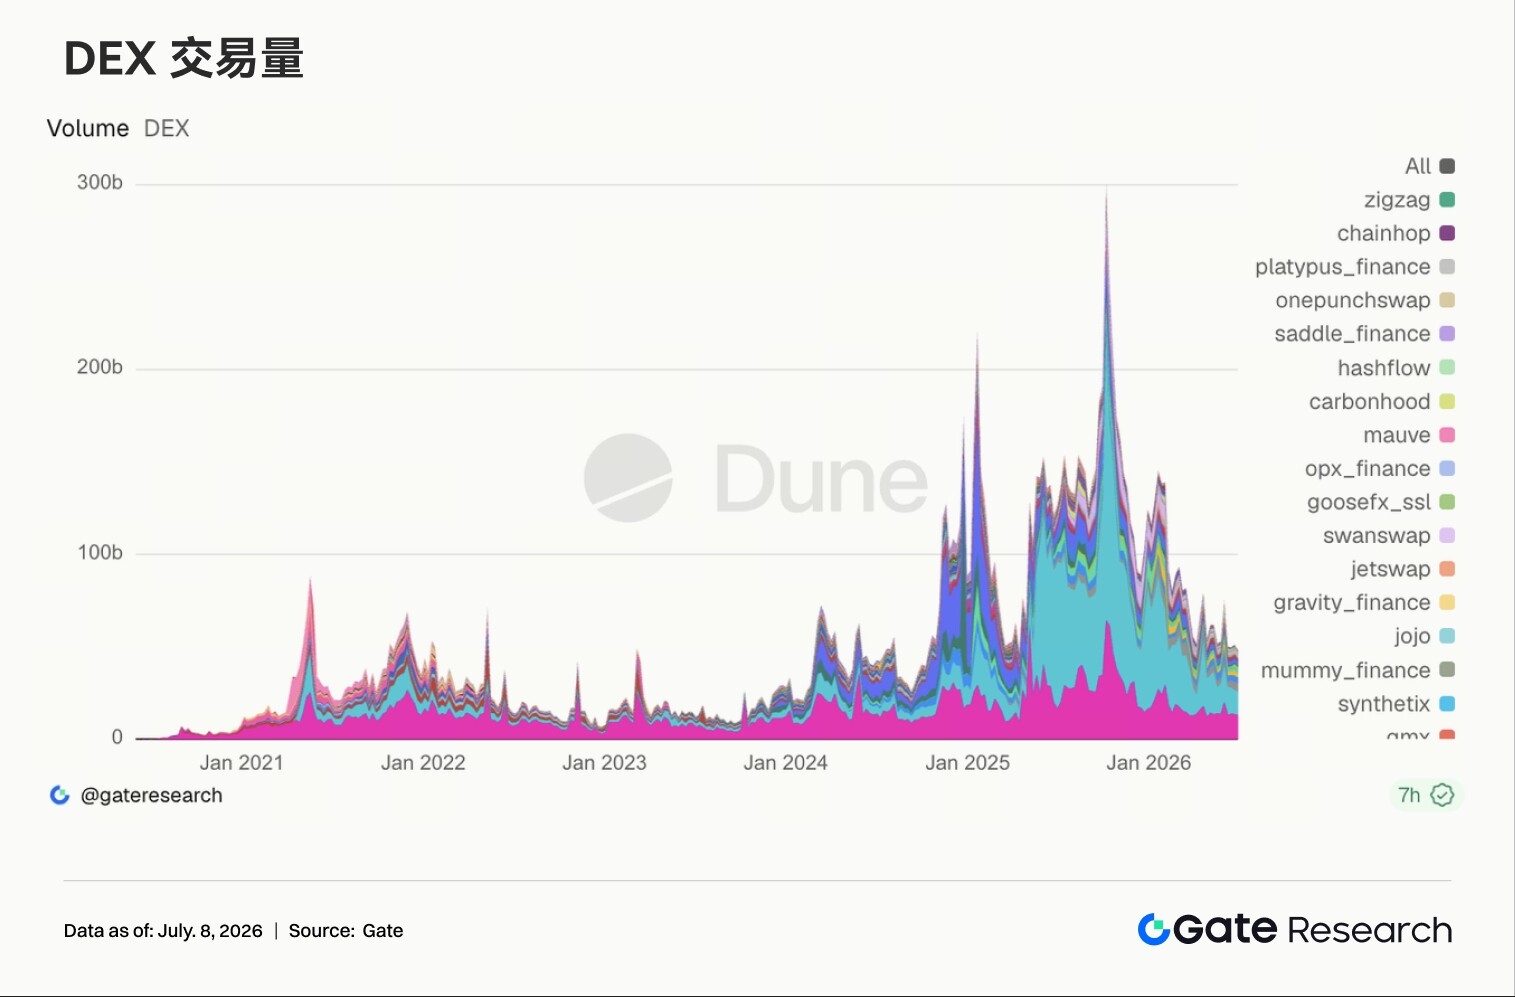
• DEX trading structure continues to diverge; Uniswap and PancakeSwap volumes decline, while PumpSwap maintains high growth, driving Solana issuance, trading, and wallet ecosystem to become a major incremental source of capital and protocol revenue.
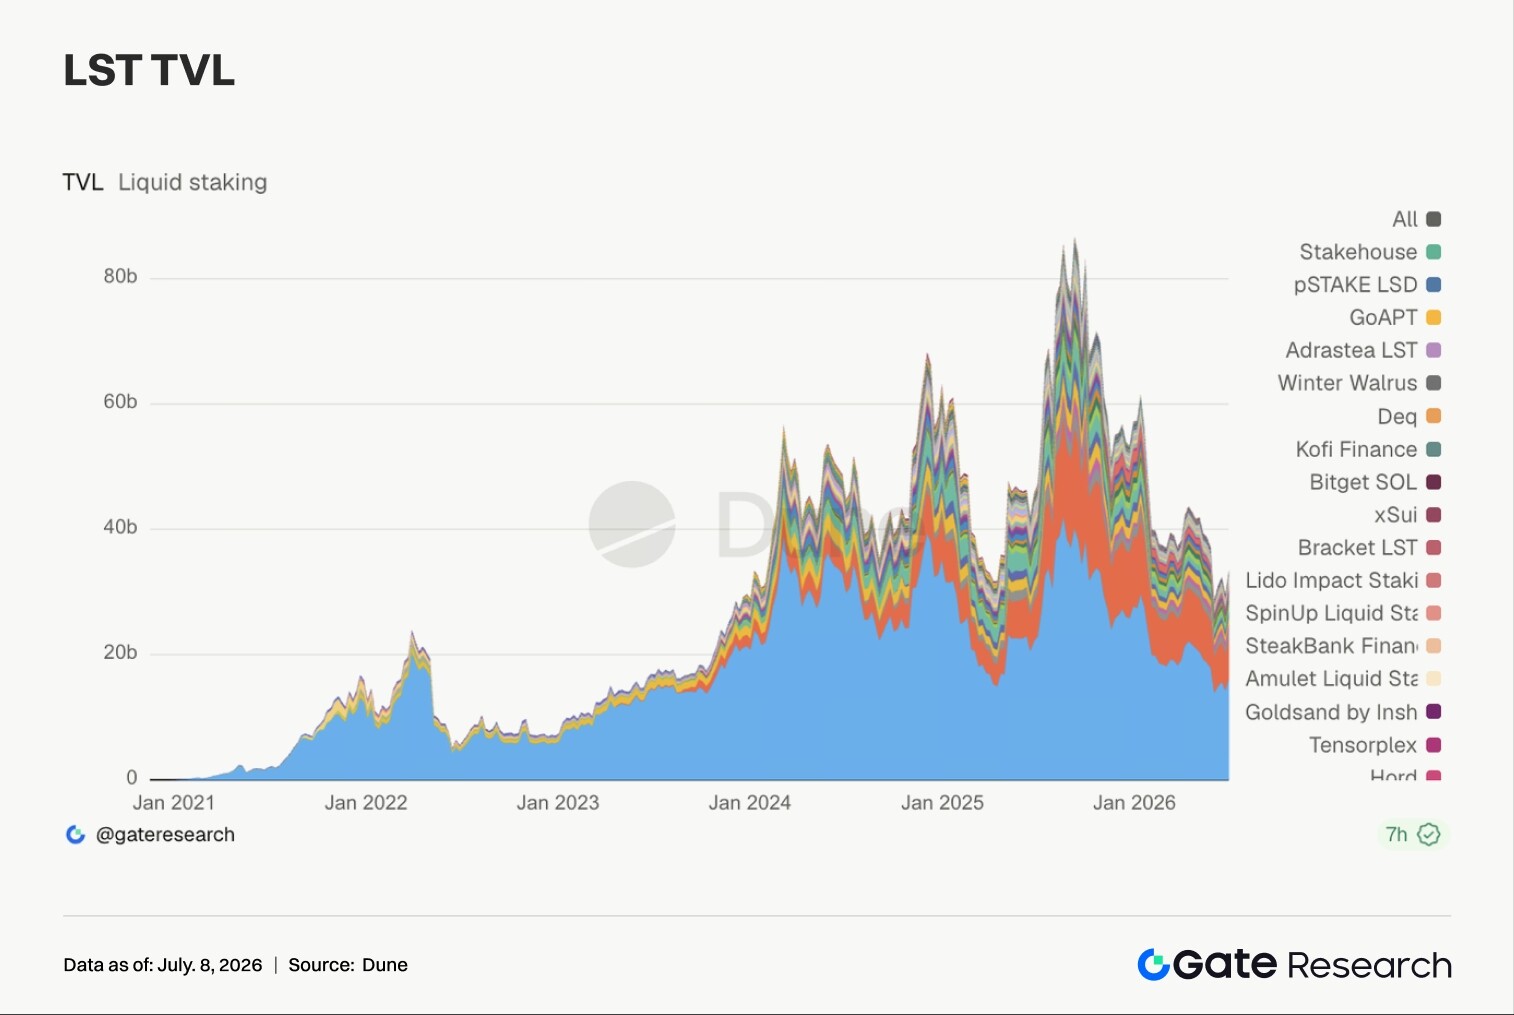
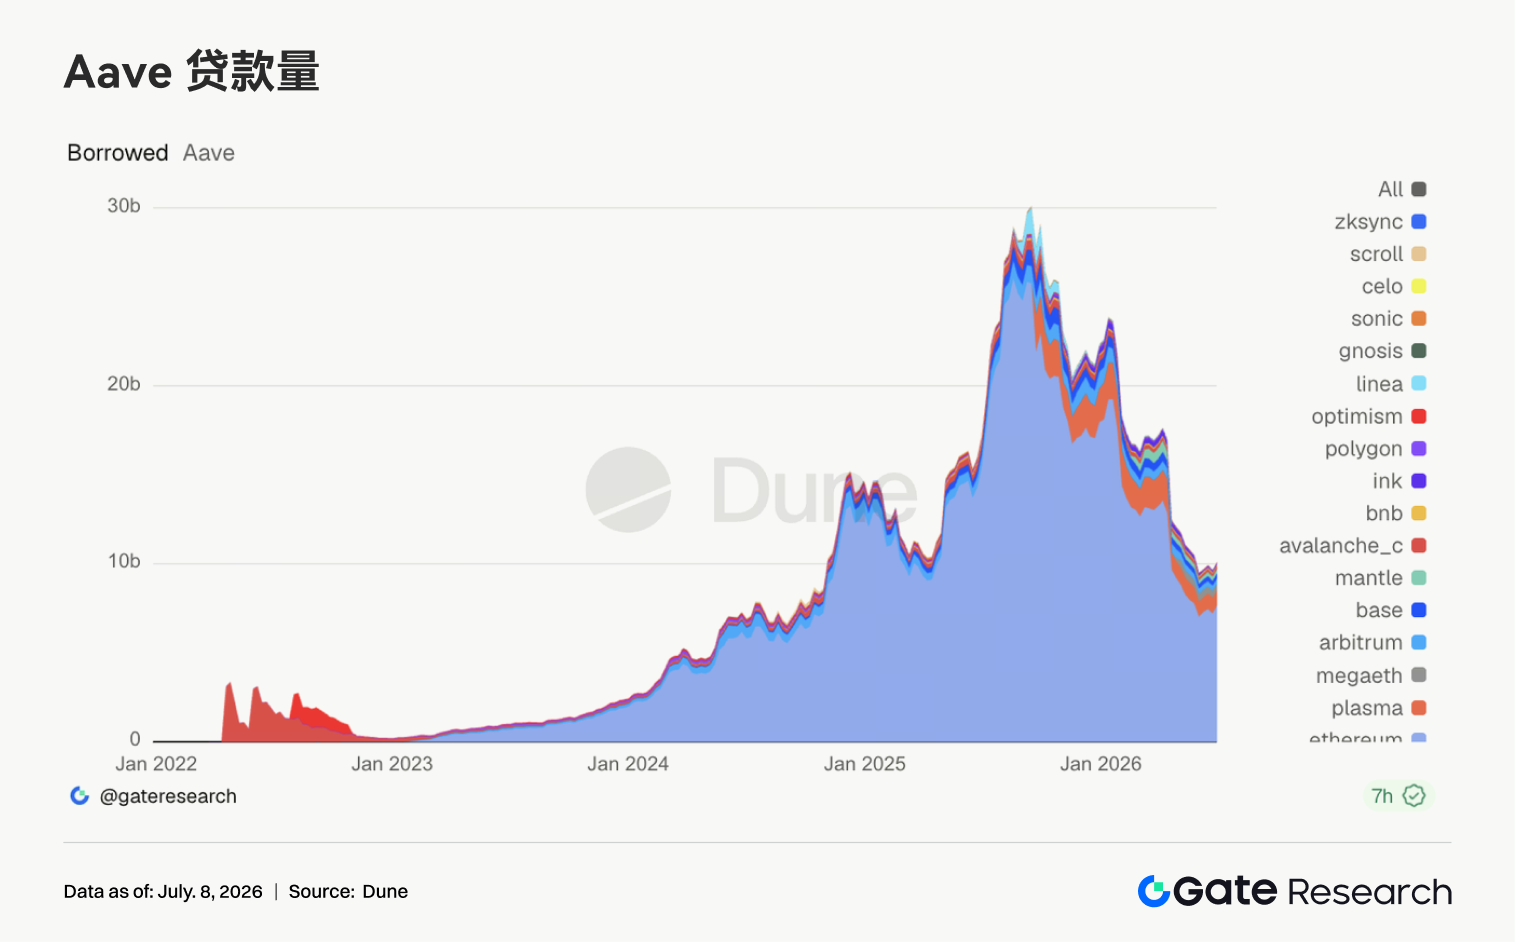
• The LST sector recovers simultaneously, with staked assets for ETH and SOL rebounding as risk appetite improves, while Aave's lending demand re-concentrates on the Ethereum main market.
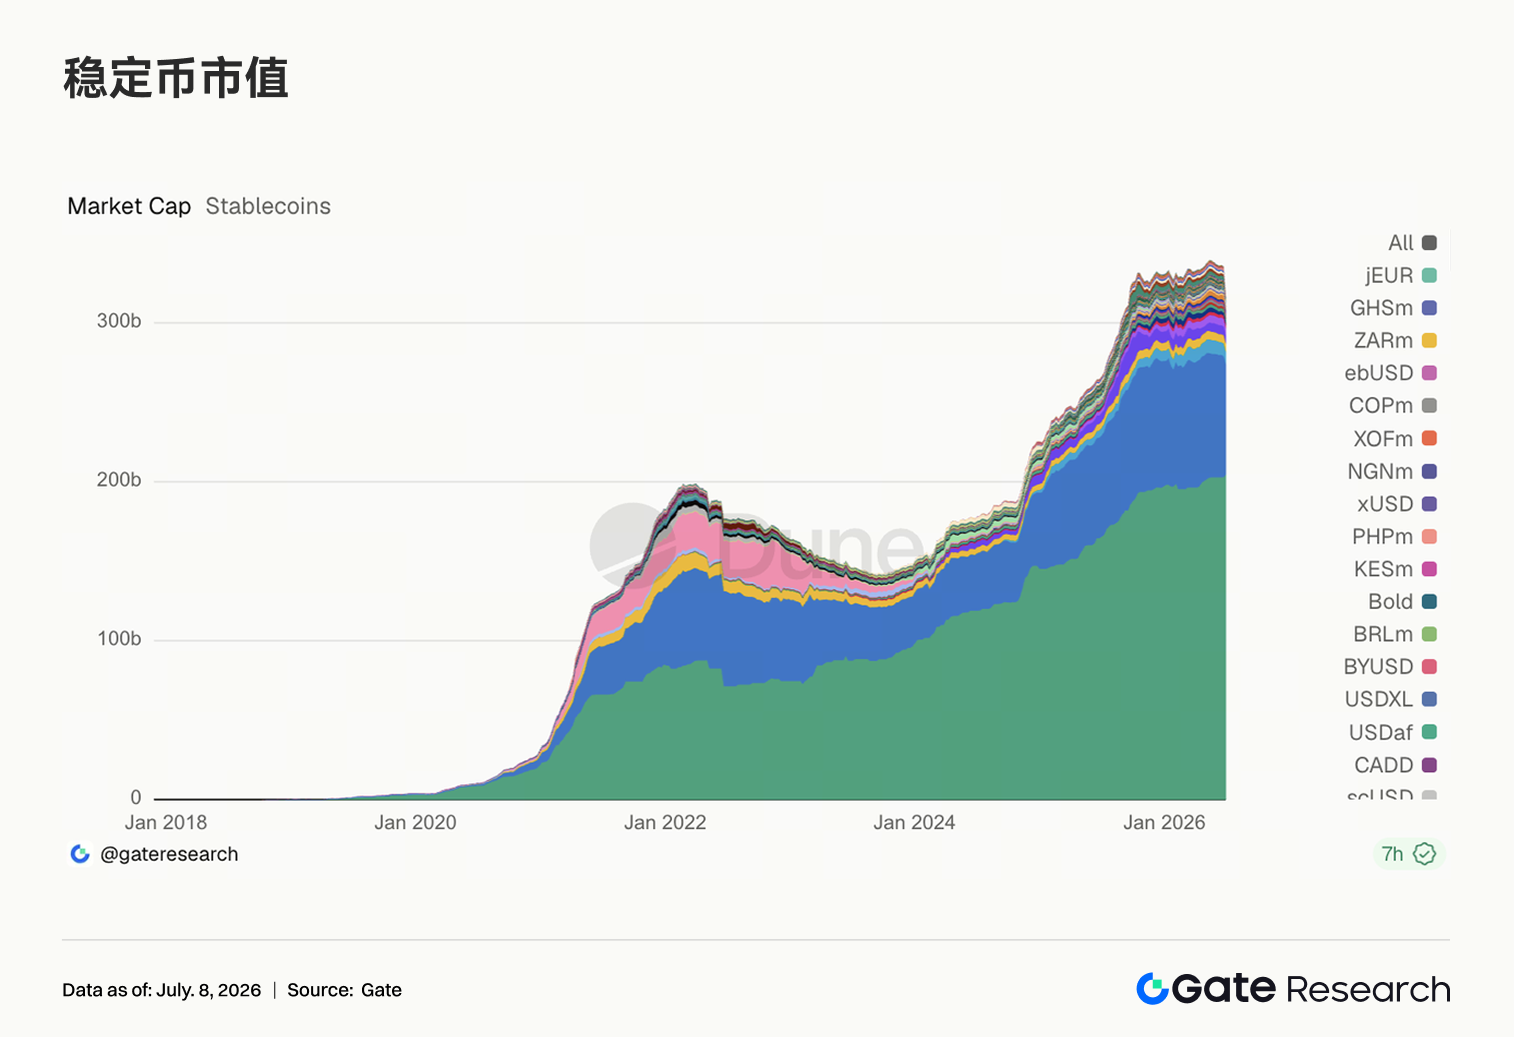
• Stablecoin supply remains generally weak, but USDC continues to strengthen institutional channels with support from institutions like BNY Mellon. The rise in Aave USDC borrowing rates indicates improving demand for high-quality USD liquidity; protocol revenue also shifts from on-chain derivatives to Solana traffic access points.
• BTC OI recovers from ~$20.5 billion to ~$22 billion, with funding rates remaining consistently positive, indicating leveraged capital re-entering the market. Options volume also recovers, with 25D Skew repairing from deep negative territory and DVOL falling from 46-48 to 39-40.
• Gate's June platform spot and futures trading volumes increased by 49.39% and 11.19% month-over-month, respectively. Gate Institutional spot and futures trading volumes increased by 17.71% and 10.70% month-over-month, respectively. CrossEx's trading volume in the first week of July grew 26% week-over-week.
1. Market Focus Analysis
Last week (June 29 to July 5, 2026), global market trends were jointly driven by a cooling US labor market, falling interest rate expectations, and improved risk appetite. The US non-farm payrolls for June increased by 57,000, below market expectations of ~115,000, with data for April and May collectively revised down by 74,000. The unemployment rate edged down from 4.3% to 4.2%, mainly due to a decline in labor force participation.
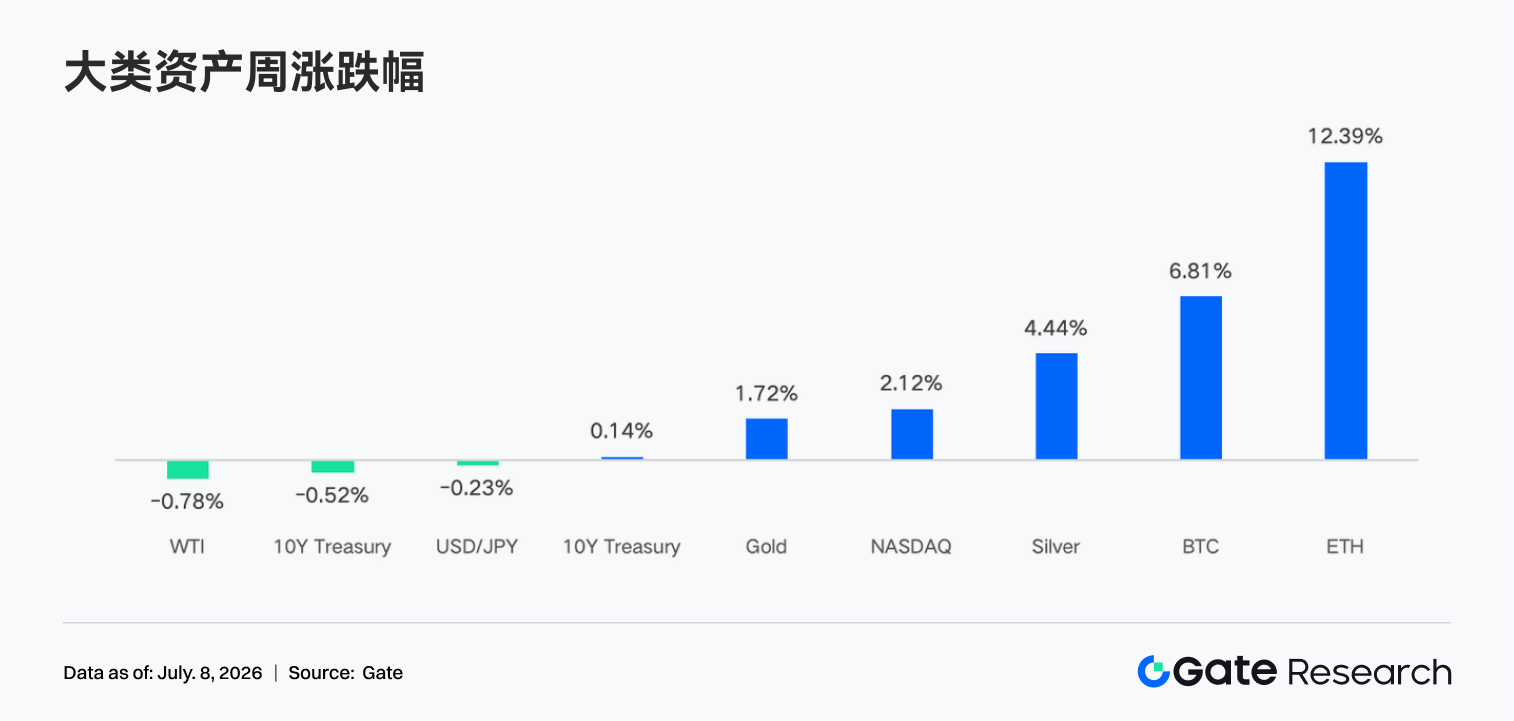
Following the data release, market concerns about further rate hikes by the Fed in July eased. The 10-year US Treasury yield settled around 4.4477% after a week of fluctuation, while the 2-year yield fell to about 4.13%, marginally easing rate pressures. US stocks rallied in a holiday-shortened trading week, with the Dow up ~2.0%, the S&P 500 up ~1.8%, and the Nasdaq up ~2.1%. However, rotational pressure appeared in AI and semiconductor sectors, suggesting that capital is not solely chasing high-valuation growth stocks but is repricing risk assets under the combination of "slowing economy but no more hawkish policy." In commodities, oil prices oscillated between Middle East risk premiums and OPEC+ production increase expectations, with WTI crude trading around $70. Gold remained elevated, reflecting that inflation and geopolitical risks have not fully dissipated. The crypto market benefited from falling US Treasury yields, easing USD liquidity pressures, and improved US stock risk appetite. Both BTC and ETH strengthened during the week, with ETH showing higher elasticity, indicating a rotation of capital from defensive BTC allocations to higher-beta assets.
2. Liquidity Analysis
2.1 ETF Net Outflows Remain Significant; BTC ETFs See ~$1.787 Billion Net Outflows for the Week
Regarding ETFs, BTC spot ETFs experienced significant net outflows last week. The weekly net outflow for US BTC spot ETFs was ~$1.787 billion, continuing the heavy redemption pressure seen in June. However, on July 2nd, there was a single-day net inflow of $221.72 million, ending a ~10 trading day streak of cumulative outflows totaling ~$2.73 billion. AUM data shows that on June 26th, the total net assets of BTC spot ETFs were ~$72.818 billion, rising to ~$74.369 billion by July 2nd, an increase of ~$1.551 billion, primarily driven by the BTC price rebound offsetting net redemptions. In terms of individual products, Fidelity's FBTC saw the largest inflow on July 2nd at ~$166 million, followed by ARKB at ~$91.84 million. The most notable outflow was from BlackRock's IBIT, with a single-day outflow of ~$40.43 million, remaining in a narrative of consecutive outflows.
Pressure on ETH spot ETFs was significantly less than on BTC. Combined public daily frequency data shows net outflows of ~$13.65 million from June 29th to July 2nd, with outflows of ~$30.04 million and ~$27.6 million on June 29th and 30th, respectively, turning to inflows of ~$14.89 million and ~$29.08 million on July 1st and 2nd. AUM rose from ~$8.594 billion on June 29th to ~$9.02 billion on July 2nd, an increase of ~$426 million, more attributable to the ETH price rebound and minor capital rebalancing. At the product level, ETFA was among the top in inflows on July 1st and 2nd, with ~$29.74 million in inflows on July 2nd. Products like ETHE/ETHB bore the primary redemption pressure during the week.
Overall, institutional sentiment is not a broad turn bullish but a shift from panic redemptions to probing rebalancing. BTC still needs IBIT to resume inflows to confirm the trend, while ETH shows small-scale capital starting to return at lower prices.
2.2 TradFi Liquidity
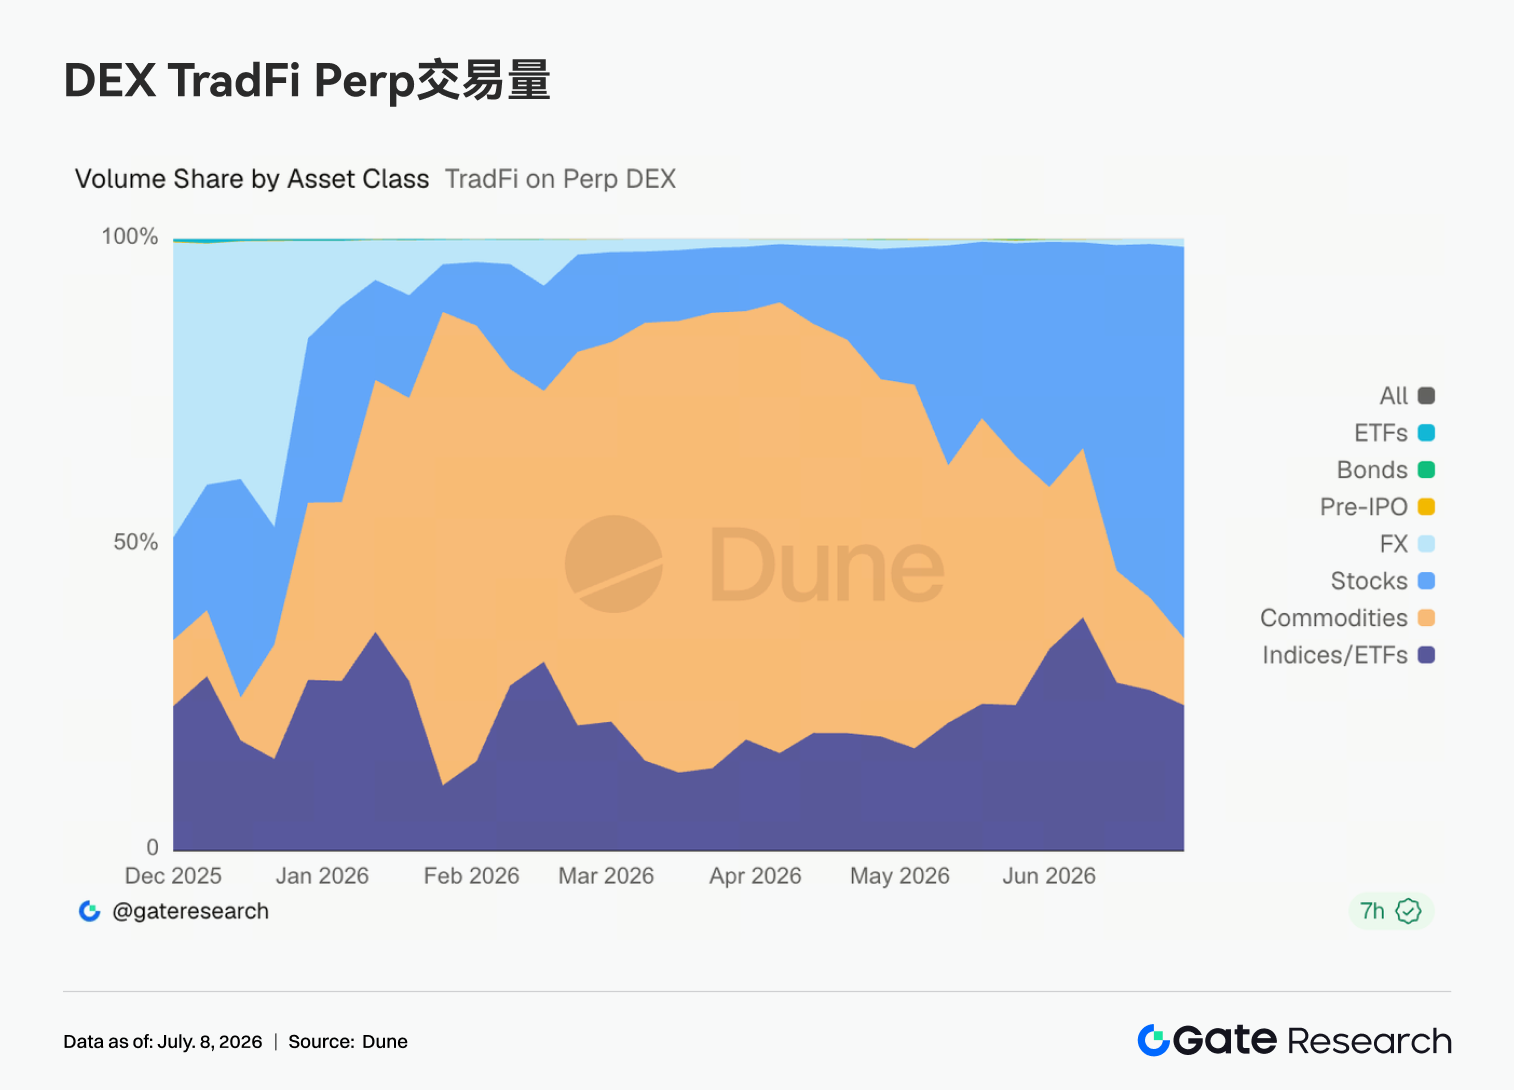
• TradFi Perp DEX: Over the past week, the trading structure of TradFi Perp DEXs continued to concentrate towards equity assets. The share of perpetual contracts for stocks rapidly increased to ~60%-65%, re-establishing market dominance. The previously dominant commodity share continued to fall to ~10%-15%, indicating a cooling in hedging trades like gold and crude oil. Meanwhile, the share of index/ETF contracts remained steady at around 20%. Trading volumes for other asset classes like FX, bonds, Pre-IPO, and ETFs remained low, with limited contribution to overall volume, as market capital continued to concentrate on highly liquid equity products.
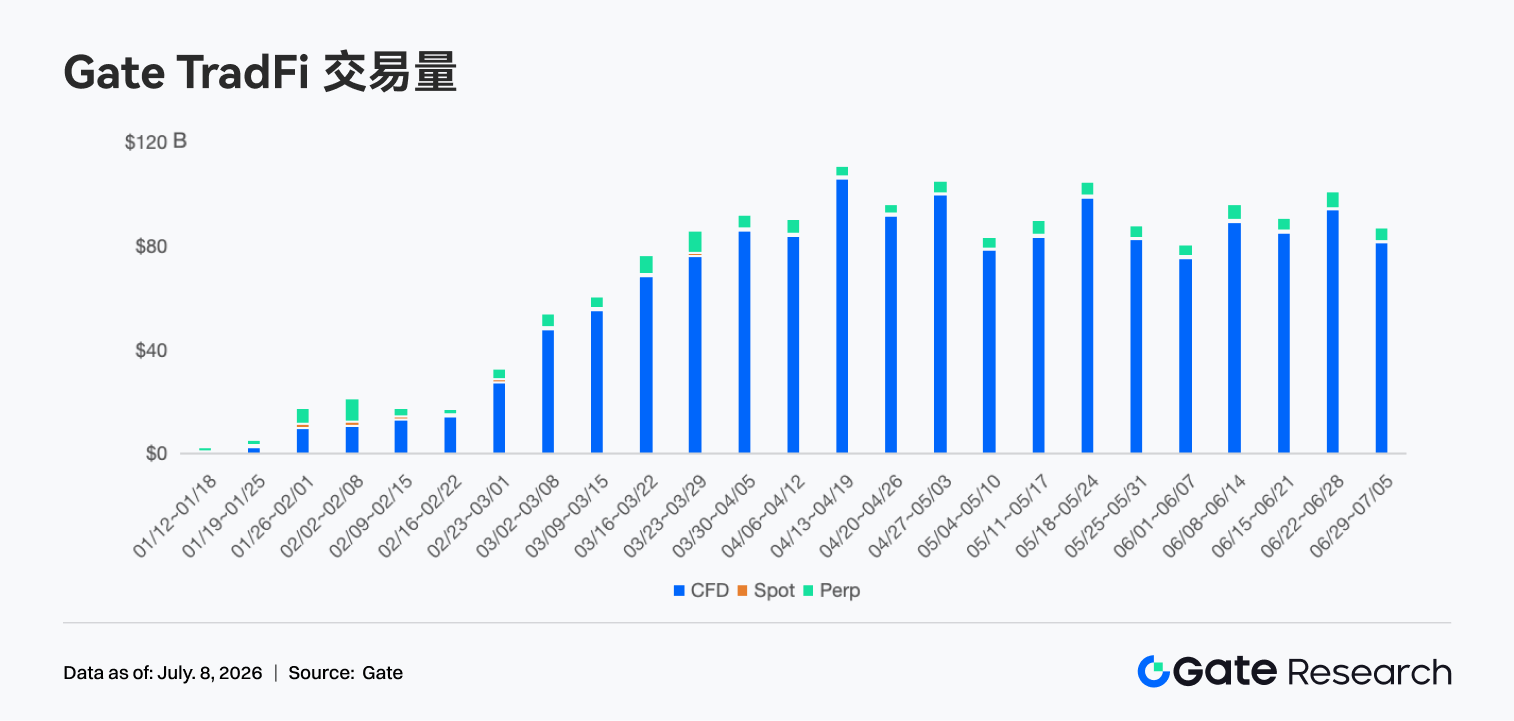
• Gate TradFi Volume: Over the past week, Gate TradFi's total trading volume was ~$85 billion, down ~13%-15% week-over-week. Last week's total volume was near $98 billion, a recent high. This week's decline to ~$85 billion remains above levels seen in late May and early June, indicating overall trading activity remains stable. CFDs remain the absolute core business. CFD volume was ~$81 billion, accounting for approximately 95% of the total volume. Although lower than the previous week, it still contributes the vast majority of trading volume and remains the primary growth driver for Gate TradFi's product suite. Perps showed resilience. Perp volume remained in the $400-500 million range, accounting for ~5% of the total, showing little change overall. This suggests that demand for derivatives trading remained stable against a backdrop of moderating market volatility.
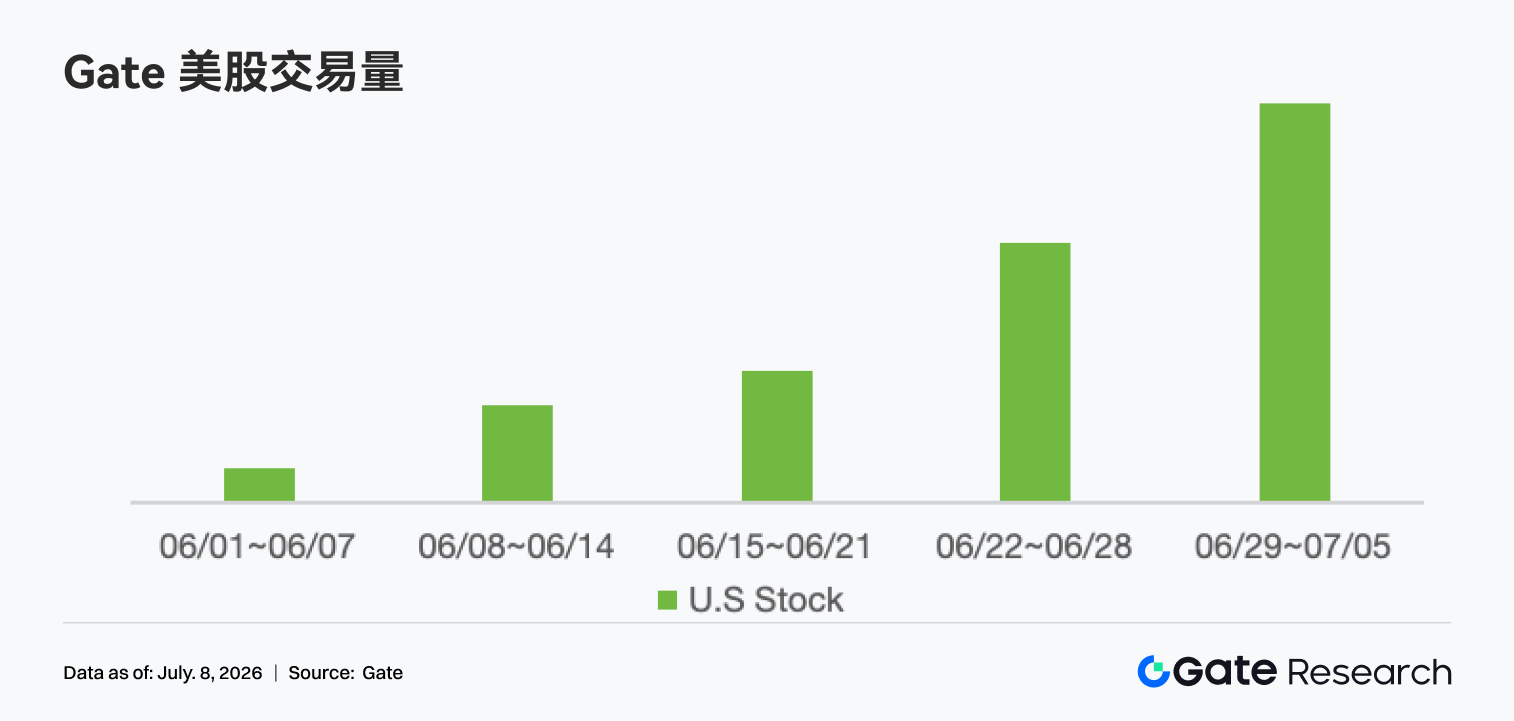
• Gate US Stock Trading Volume: Gate officially launched US stock trading services on June 2nd. Features include support from real underlying assets, direct trading using USDT, no overnight holding fees, and high liquidity. Over the past week, Gate's US stock trading volume continued its rapid growth, hitting a new phase high, a further increase from the previous week, extending the growth trend for five consecutive weeks since the start of June. With the sequential launch of features like regular US stock trading, pre/post-market trading, web terminal support, and 7x24 trading, user participation continues to rise. Concurrently, the weakening US employment data has boosted market risk appetite, increasing activity in US equities and further driving platform US stock volume. This reflects that Gate's global equity business is entering an accelerated expansion phase.
• TradFi Order Book Depth: We selected XAUT, the highest-volume TradFi asset, to analyze its order book depth (Delta). Over the past week, green Delta bars significantly outnumbered red bars, especially on July 1st, 3rd, and 6th, where multiple net increases in bid-side liquidity of $500,000 to $800,000 were observed. This indicates that market makers are continuously replenishing buy orders, providing strong market support. The XAUT price rose from ~$4,000 to the $4,160-$4,180 range, with bid-side depth increasing concurrently. This suggests the upswing was supported by genuine liquidity rather than short-term price pumps on thin depth. Although some negative Delta values of $200,000 to $500,000 appeared between July 2nd and 5th, these were short-lived and did not form a continuous liquidity withdrawal, having limited impact on price. Overall, the latest large buy-side order injection implies a strong liquidity support level has formed around $4,150. In the short term, if macro-level risk-off sentiment persists, XAUT's depth structure remains conducive to maintaining a strong price.
3. On-Chain Data Insights
3.1 Top DEX Spot Volumes Continue to Cool; PumpSwap Brings Solana Speculative Flow Back to the Forefront
The structural shift in DEX trading volume continued this week. Uniswap and PancakeSwap remained in the top two spots, but their volumes edged lower compared to the previous week, with no significant expansion in turnover for mainstream spot pools. PumpSwap, however, continued its upward trajectory, maintaining high volumes and user counts. Speculative flow on Solana is migrating towards platforms that integrate issuance and secondary trading. Meteora also saw some recovery, but performance on platforms like Raydium, Curve, and Aerodrome, which focus on more mature liquidity scenarios, was relatively flat, indicating no broad chain-agnostic rally.
3.2 Stablecoin Supply Remains Weak Overall, But USDC's Institutional Channel Continues to Open
Stablecoin supply remained tilted towards contraction this week. Most major assets like USDT, USDC, USDS, USD1, and USDe saw slight declines, with no large-scale new USD inflows appearing on-chain. A relatively bright spot was the expansion of PYUSD, while DAI remained relatively stable, reflecting minor capital reallocation between regulatory and yield narratives. BNY Mellon announced this week that it would support the custody, transfer, minting, and burning of USDC on its digital asset platform, which is a tangible positive for USDC's institutional channel. Concurrently, news of entities like BlackRock, Google, and Coinbase participating in supporting Open USD indicates the stablecoin competition is pivoting towards integration with payments, custody, clearing, and institutional wallets. However, opposition from community banks to stablecoin legislation continues to ferment, meaning regulatory hurdles have not disappeared.
3.3 LST Sector Recovers Notably from Last Week's Pullback; ETH and SOL Staked Assets Rebound in Sync
The LST sector saw a clear recovery this week. Ethereum-side protocols like Lido, Rocket Pool, and StakeWise recovered from their lows last week. The Solana side showed similarly strong elasticity, with Jito, Sanctum, and Jupiter Staked SOL all experiencing rebounds of varying degrees. As TVL is denominated in USD, this recovery is partly related to the price increases of ETH and SOL, but also indicates that the previous week's de-risking did not evolve into sustained redemption pressure. Following the KelpDAO/rsETH incident, institutional assessment of LSTs remains more focused on safety and path clarity, with the risk premium between standard LSTs and cross-chain wrapped assets already diverging. Overall, this week's LST performance was driven by both valuation recovery and improved risk appetite.
3.4 Aave Lending Volume Pulled Up by Ethereum Main Market Recovery; Multi-Chain Structure Still Diverging
Aave's lending balance saw a recovery this week, primarily driven by growth in the Ethereum main market. When risk appetite returns, funds still prioritize the core market with the deepest liquidation depth and highest collateral quality. Markets like Arbitrum, Base, Mantle, and Ink also saw minor improvements, but Plasma and MegaETH continued to decline, slowing the pace of earlier new market expansions. This structure aligns with the risk recovery logic of past weeks: Aave hasn't lost lending demand, but capital is more selective about chains, collateral types, and risk parameters.
3.5 Aave Core Asset Borrowing Rates Diverge Again; USDC Funding Pressure Clearly Rises
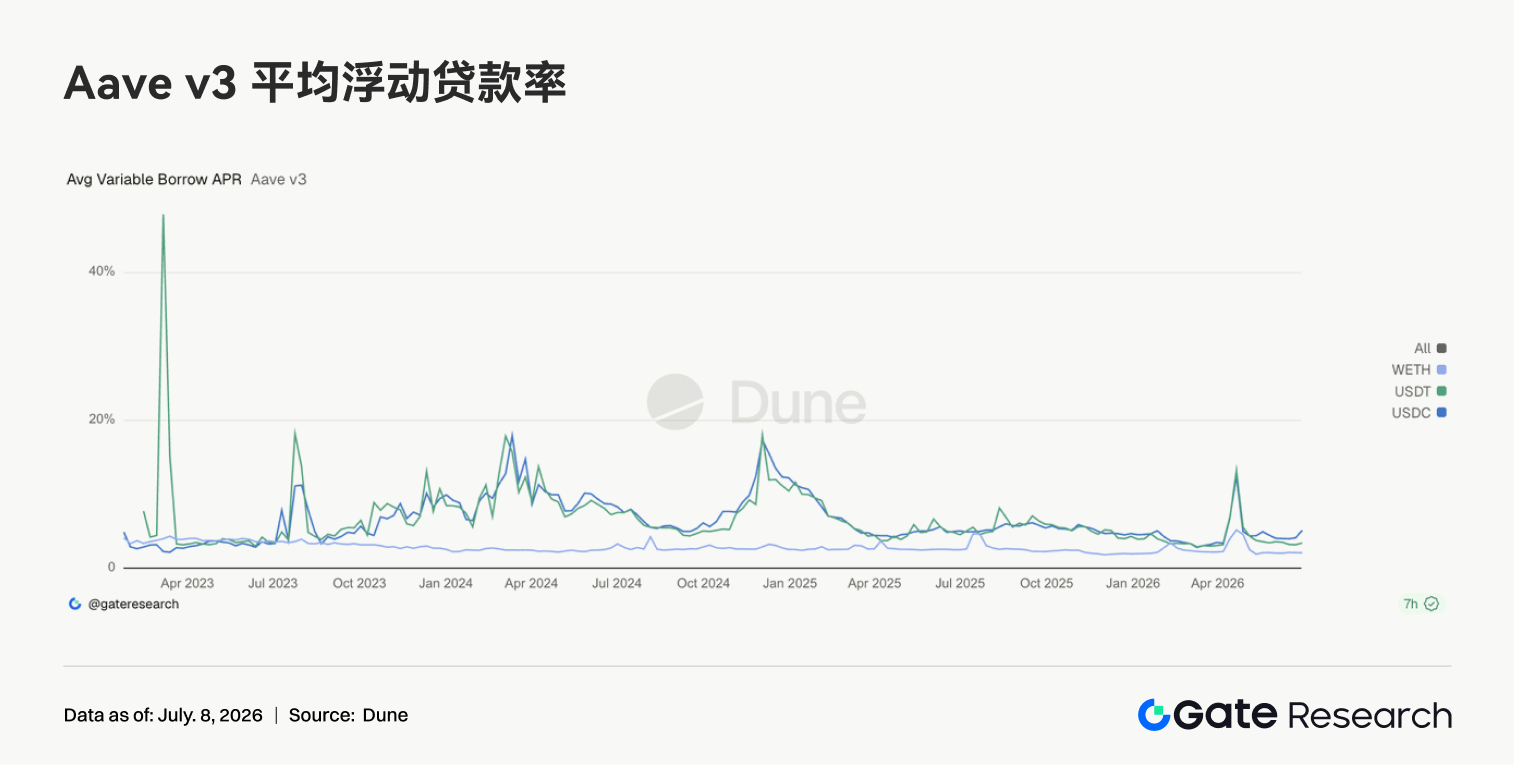
Interest rates for Aave's three core assets showed a new divergence pattern this week. The average borrowing cost for USDC rose significantly, USDT increased slightly, while WETH remained at low levels. USDC's highest rate within the week still saw brief spikes, indicating the core USD pool remains sensitive to utilization changes. In contrast, WETH rates did not rise in tandem, suggesting no crowding in ETH directional leverage. This combination typically corresponds to an increased institutional demand for stablecoin turnover, arbitrage, and collateral management. Discussions within the Aave community about increasing the USDC liquidity buffer have practical significance based on this week's data. The conclusion from the rate side is clear: market risk appetite has somewhat recovered, but the first thing to become more expensive is still high-quality USD liquidity.
3.6 Protocol Revenue Shifts from High-Beta Derivatives to Solana Traffic Gateways; Pump Ecosystem Shows Strongest Performance
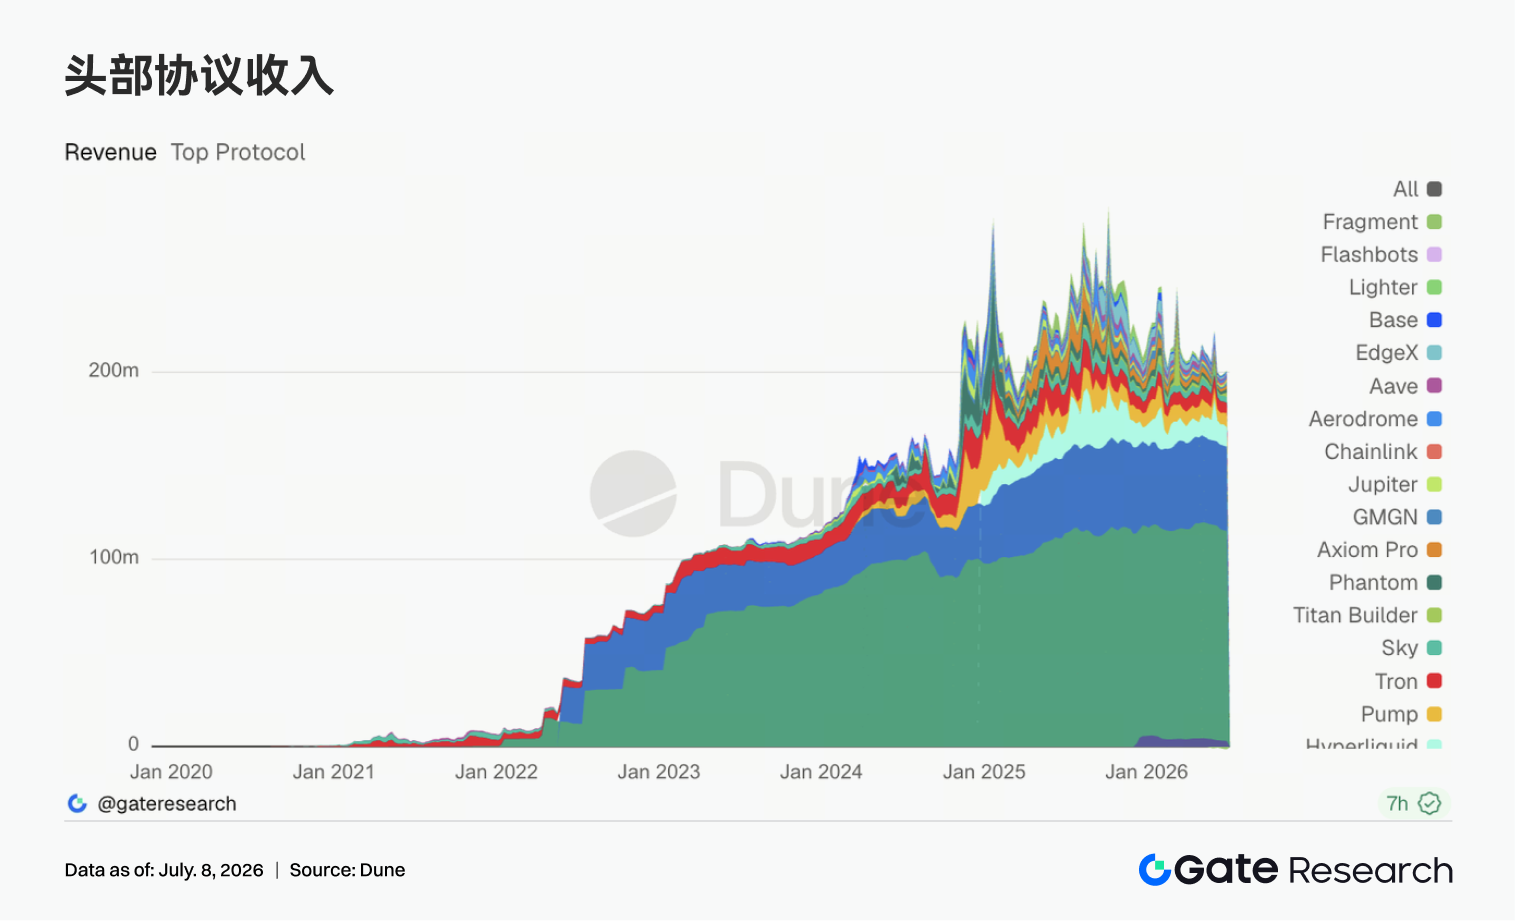
The structural shift in protocol revenue was evident this week. Tether and Circle remain the most stable cash flow bases, but the growth elasticity primarily came from Solana traffic gateways like Pump.fun, PumpSwap, Axiom, and Phantom. Hyperliquid Perps revenue declined compared to the previous week, as the earlier heat in on-chain perpetuals and index/pre-IPO trading moderated. However, it remains one of the highest-earning on-chain derivatives protocols. Titan Builder revenue continued to improve, reflecting that order flow and MEV-related infrastructure still have strong cyclical elasticity. Aave V3 revenue saw a slight decline, matching the divergence in lending rate structure but uneven total balance recovery. Combining this with DEX data, this week's revenue and trading data point to the same main theme: mainstream spot platforms stabilize the base, while the real marginal elasticity comes from Solana issuance, wallets, and high-frequency trading frontends. Stablecoin issuers provide the steady cash flow, while trading infrastructure and traffic gateways provide short-term elasticity.
4. Derivatives Tracking
4.1 BTC Price Recovers from Lows; OI Uptick Signals Leverage Capital Re-entry
BTC price fluctuated downward initially last week before recovering. Prices oscillated around $60,000 early in the week, briefly dipped to near $59,000 around June 30th before gradually recovering, and rebounded back to the $63,000-$64-000 range by July 3rd-5th. Overall, the price transitioned from a weak downtrend in the previous week to a low-level rebound, though it has not fully broken out of its range-bound structure.
On the OI front, a clear recovery occurred this week. OI was around $20.5 billion near June 29th, then gradually rose and returned to the ~$21.9-$22.0 billion level by July 3rd-5th. The price rebound combined with rising OI suggests leverage capital is re-entering the market, providing some support for this round of recovery. The funding rate remained positive throughout the week, mostly within


