Gate 기관 주간 보고서: DVOL 저점 반등, 암호화폐 ETF 자금 지속 유출


- 핵심 의견: 지난주 시장은 연준의 매파적 신호에 억눌려 위험 자산이 압박을 받았고, 암호화폐 시장도 동반 조정을 겪으며 BTC와 ETH가 모두 4% 이상 하락했습니다. 시장 전반은 거시적 불확실성 속에서 신중한 베팅 국면에 있으며, 온체인 거래는 완만하게 회복되었지만 거래량이 급증하지는 않았습니다. DeFi는 구조적 회복 단계에 접어들었고, 스테이블코인 발행 부문은 여전히 업계의 핵심 수익원입니다.
- 핵심 요소:
- 연준 6월 FOMC 회의는 매파적이었으며, 점도표에서 금리 인하 기대치를 제거하고 9명의 위원이 연내 금리 인상을 예상함에 따라 미국 국채 수익률과 달러가 강세를 보이며 암호화폐 시장에 압력을 가했습니다.
- 미국 비트코인 현물 ETF는 6월에 약 21억 달러의 순유출을 기록했지만, 블랙록의 IBIT는 지속적으로 자금을 유치하고 있으며, 연간 목표 수익률 15%-25%를 추구하는 신제품 iShares 프리미엄 수익 비트코인 ETF(BITA)를 출시했습니다.
- 온체인 DEX 거래량은 분화를 보여 Uniswap의 주간 거래량이 약 141억 1천만 달러를 기록하며 PancakeSwap을 역전했습니다. Solana 생태계 거래는 회복되었지만 전반적인 거래량 급증으로 이어지지는 않았습니다.
- 스테이블코인 시장 공급은 분화를 보이며 상위 자산의 데이터는 감소했지만, DAI, PYUSD 등 중간 및 중하위 자산은 탄력성을 보여주었습니다. 이는 자금이 주로 기존 물량 순환으로 운영되며 신규 달러 유입 신호는 없음을 시사합니다.
- DeFi 시장은 구조적 회복 단계에 접어들었습니다. Lido, Aave 등 프로토콜의 TVL과 대출 잔액이 반등했지만, 이는 주로 자산 가격 회복에 의해 주도되었으며, 자금은 성숙한 담보 및 안정적인 수익 프로토콜을 선호합니다.
- BTC 파생상품 시장은 레버리지 축소가 진행 중이며, 미결제약정(OI)은 약 210억 달러로 급격히 감소했지만, 자금 조달 비율은 여전히 플러스를 유지하고 있어 롱 포지션 심리가 냉각되었지만 공포로 반전되지는 않았음을 나타냅니다. 옵션 25D Skew는 약세를 보였고, DVOL은 저점에서 반등하여 단기 방어적 수요가 회복되었습니다.
Executive Summary
• Last week, global markets traded in response to the Federal Reserve's hawkish signals. Cooling rate cut expectations drove U.S. bond yields and the dollar higher, putting pressure on risk assets. The crypto market experienced a synchronized pullback, with BTC and ETH both falling over 4%.
• The overall trend of ETF capital outflows remained unchanged. Gate TradFi Perp trading stayed active, with coverage of U.S. equity assets continuing to expand. Short-term order book liquidity for XAUT weakened. The market remains in a cautious game under macroeconomic uncertainty.
• On-chain transaction activity saw a modest overall recovery but did not form a comprehensive volume increase. DEX trading volumes showed divergence, with Uniswap slightly overtaking PancakeSwap. The Solana ecosystem saw a recovery in trading activity. There was no significant new dollar inflow in stablecoin supply; capital movement remained primarily rotational among existing holdings, with mid-tier stablecoins showing some resilience.
• The DeFi market is entering a phase of structural repair. Improvements were seen in LST, Aave lending, and protocol revenues, but this was primarily driven by asset price recovery and core liquidity market repairs. Capital shows a preference for mature collateral, stable yields, and trading-focused protocols, with stablecoin issuance remaining the core revenue source for the industry.
• The BTC derivatives market continues its deleveraging process. OI has rapidly declined, but the funding rate remains positive, indicating cooling long sentiment without turning bearish. Meanwhile, options volume has cooled, Skew weakened, and DVOL rebounded, reflecting a resurgence in short-term defensive demand and renewed volatility expectations.
1. Market Focus Analysis
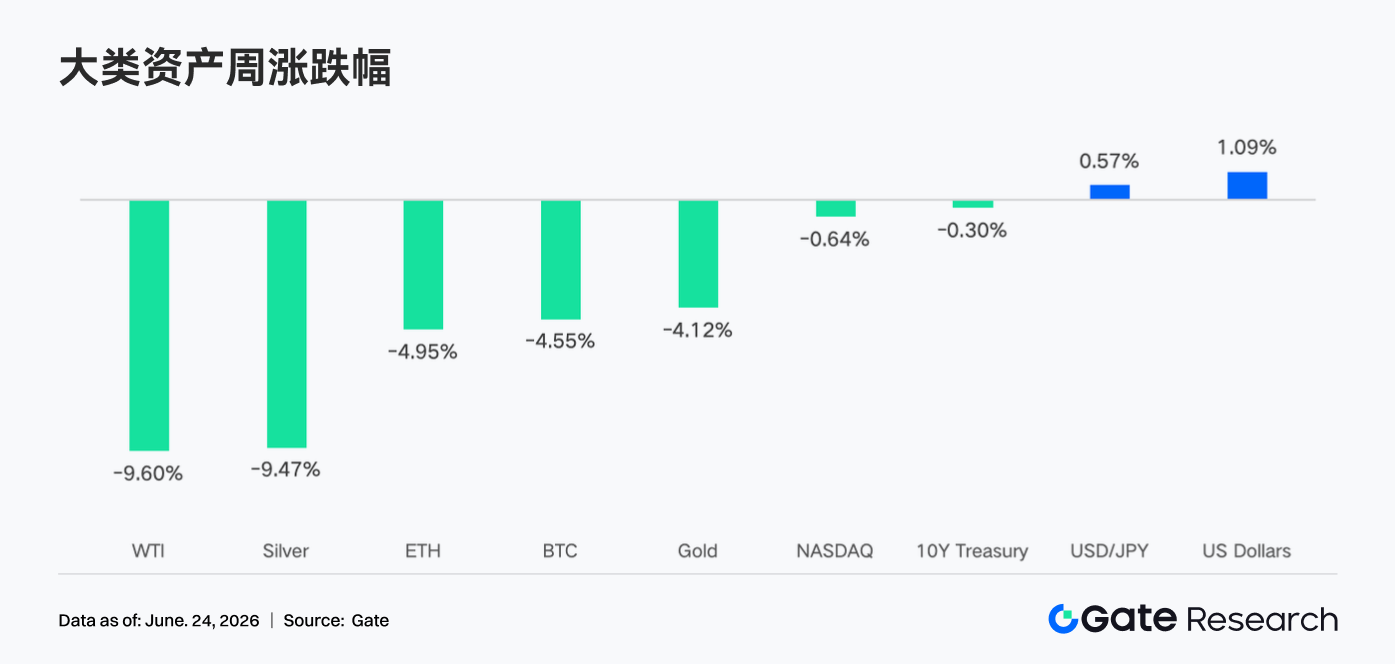
Last week (June 15-21, 2026), the core global macro event was the Fed's June FOMC meeting. Fed Chair Kevin Warsh, in his first post-meeting press conference, delivered comments interpreted by the market as hawkish. The federal funds rate target range was held steady at 3.50%–3.75%, but the latest dot plot completely removed rate cut expectations for 2026. Nine of the 18 officials even included the possibility of at least one rate hike within the year. Warsh also stated that forward guidance is no longer suitable for the current policy environment. Consequently, U.S. bond yields rose sharply, with the two-year yield hitting a new one-year high. Stocks experienced significant volatility on Fed day. Although the Nasdaq Composite Index gained 2.43% for the week, the S&P 500 rose 0.93%, and the Russell 2000 gained 1.21%, the intraday selloff on Wednesday post-Fed meeting was described by media as the "worst Fed day since the new chair took office." The U.S. Dollar Index strengthened on the hawkish expectations, pressuring commodities. Gold prices oscillated amid a tug-of-war between safe-haven demand and a strong dollar. Oil prices edged lower, dragged down by demand concerns. On the economic data front, the market is closely monitoring inflation and employment data for clues on whether the Fed will actually pivot to rate hikes this year. With no major nonfarm payroll or CPI data releases that week, market sentiment was driven by expectations. Geopolitically, the situation in the Middle East, along with ongoing U.S. domestic tax reform and debt ceiling negotiations, continues to keep the markets on edge, leading to cautious overall risk appetite.
In the crypto market, liquidity tightening concerns stemming from the hawkish Fed expectations had a clear impact on digital assets. BTC fell about 4% for the week, sliding from a Monday high of $67,300 to a Thursday low near $62,300, before slightly recovering to close the weekend around $63,300. ETH performed even worse, dropping about 5% for the week. After hitting a high near $1,850 on Monday, it fell with the broader market, closing Sunday around $1,700. Altcoins generally followed the majors lower, under broad pressure from the liquidity tightening. The total global crypto market cap oscillated in the range of $2.2 trillion to $2.29 trillion. The Fear & Greed Index moved further into the fear zone post-FOMC meeting, indicating cautious market sentiment.
2. Liquidity Analysis
2.1 The Overall Trend of Crypto ETF Outflows Has Yet to Reverse
Last week, U.S. Bitcoin spot ETFs saw a slight net inflow overall. However, the cumulative net outflow for Bitcoin spot ETFs in June still stands at a substantial ~$2.1 billion, indicating that this month's overarching trend of sustained capital outflows has not fundamentally reversed.
Looking at major products, BlackRock's IBIT continued to lead, with a net inflow of approximately $16.4 million on Tuesday alone, showcasing its top-tier capital-attracting ability. The combined AUM of all U.S. Bitcoin spot ETFs is roughly $82.5 billion, holding about 1.284 million BTC. IBIT dominates with an AUM of ~$66 billion, followed by Fidelity's FBTC at ~$14 billion. Additionally, on June 16, BlackRock listed a new product on the Nasdaq – the iShares Premium Income Bitcoin ETF (BITA). This product features monthly cash dividends, targeting an annualized yield of 15%–25%, and is aimed at income-focused institutional investors, adding a new category to the Bitcoin ETF product matrix.
Liquidity performance for Ethereum spot ETFs was slightly divergent last week, with some products showing signs of recovery. On June 16, Ethereum spot ETFs recorded a net inflow of about $9.6 million, marking the second consecutive day of positive flows – a signal of phased improvement. BlackRock's ETHA continued to be the primary capital absorber, with a net inflow of ~$17.3 million that day, single-handedly supporting the overall positive flow. Meanwhile, Bitwise's ETHW had a net outflow of ~$3.5 million, Fidelity's FETH a net outflow of ~$2.2 million, and Grayscale Mini ETH a net outflow of ~$2.0 million, highlighting the ongoing trend of capital concentration towards top-tier products.
Overall, institutional willingness to allocate via the ETF channel still exists. However, under the headwind of adverse macro interest rate expectations, the pace of short-term incremental capital entry has clearly slowed. The market is waiting for greater clarity on the Fed's policy path.
2.2 TradFi Liquidity
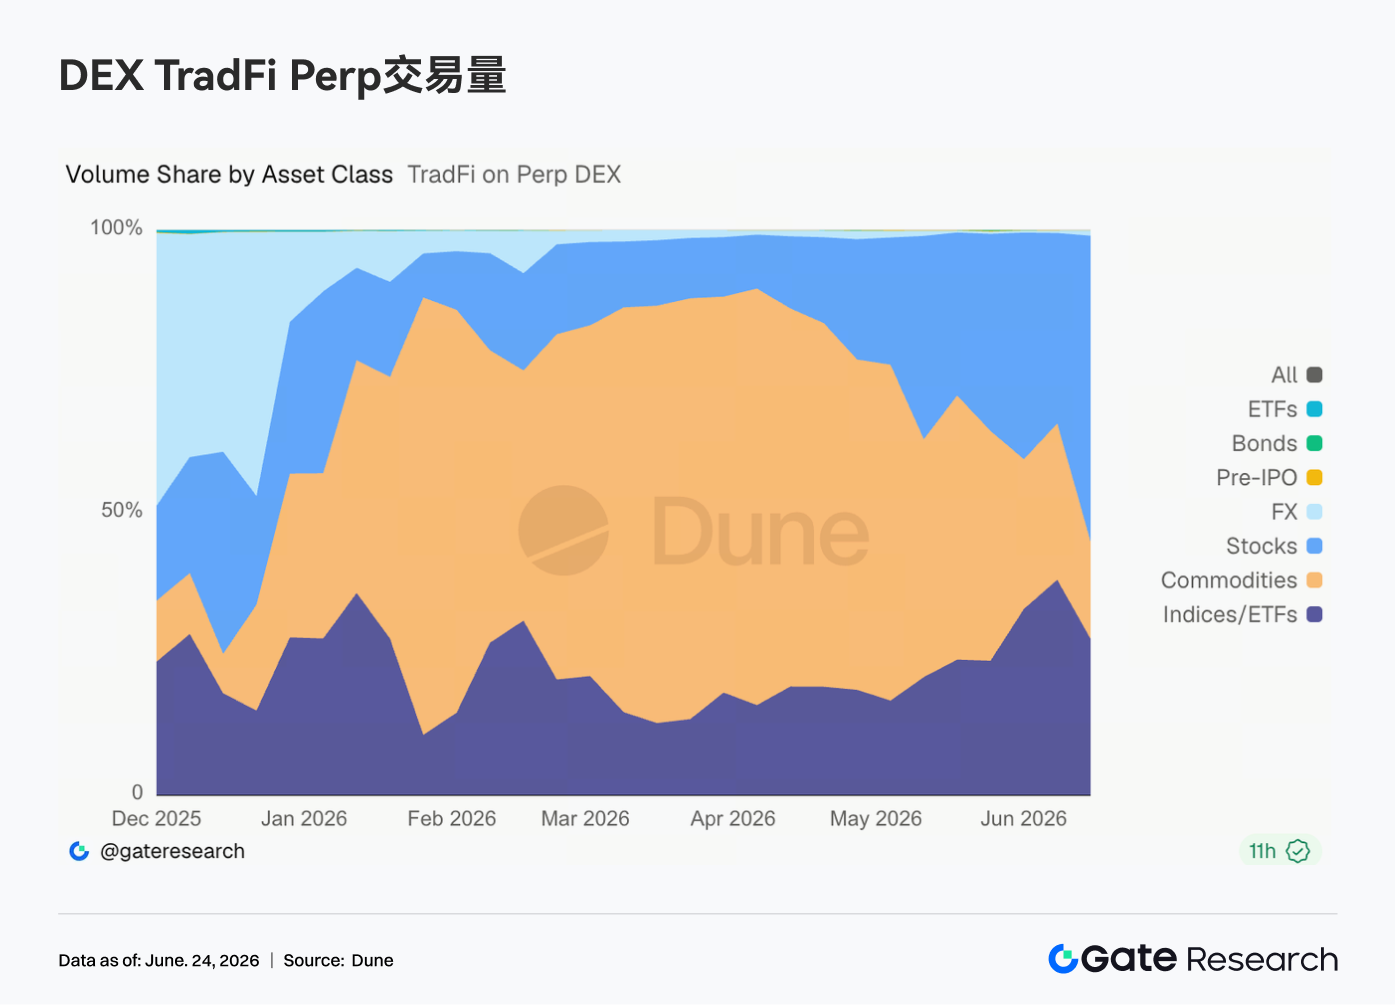
• TradFi Perp DEX: Over the past week, the trading structure of TradFi Perp DEXs saw significant changes. The share of commodity markets continued to decline, while trading shares for stocks and indices/ETFs increased notably. The commodity sector's share, which had been near 70% since mid-May, gradually dropped to about 25%–35%. Conversely, the stock sector share rebounded quickly to about 30%, and the index/ETF share rose to about 35%–40%, becoming the primary source of incremental volume recently. This shift is closely related to the recent market environment. On one hand, safe-haven trading from Middle East tensions pushed gold and other commodity prices higher before entering a consolidation phase, marginally cooling related trading activity. On the other hand, SpaceX's listing and the sustained activity in tech sectors like AI and chips attracted capital back into U.S. stocks and related index products. For TradFi Perp platforms, user demand is expanding from solely gold trading to a richer array of assets including stocks, ETFs, and Pre-IPO products.
• Gate TradFi Perp Trading Volume: Over the past week, Gate TradFi Perp trading volume remained at a relatively high level overall. Daily trading volume mainly concentrated in the $300 million to $800 million range, showing less fluctuation compared to earlier periods but maintaining stable activity. There were several instances of rapid intraday volume spikes, coming close to $800 million at its peak, indicating sustained demand for leveraged trading during periods of major macro events and asset price volatility. By asset class, metals continued to dominate. Stock-class assets saw noticeable volume increases on some days, with the blue area often expanding alongside overall volume increases, suggesting growing user participation in U.S. equity-related perpetual contracts. Overall, Gate TradFi Perp trading volume remained stable over the week, with market demand primarily driven by precious metal perpetuals, while participation in stock-class assets increased.
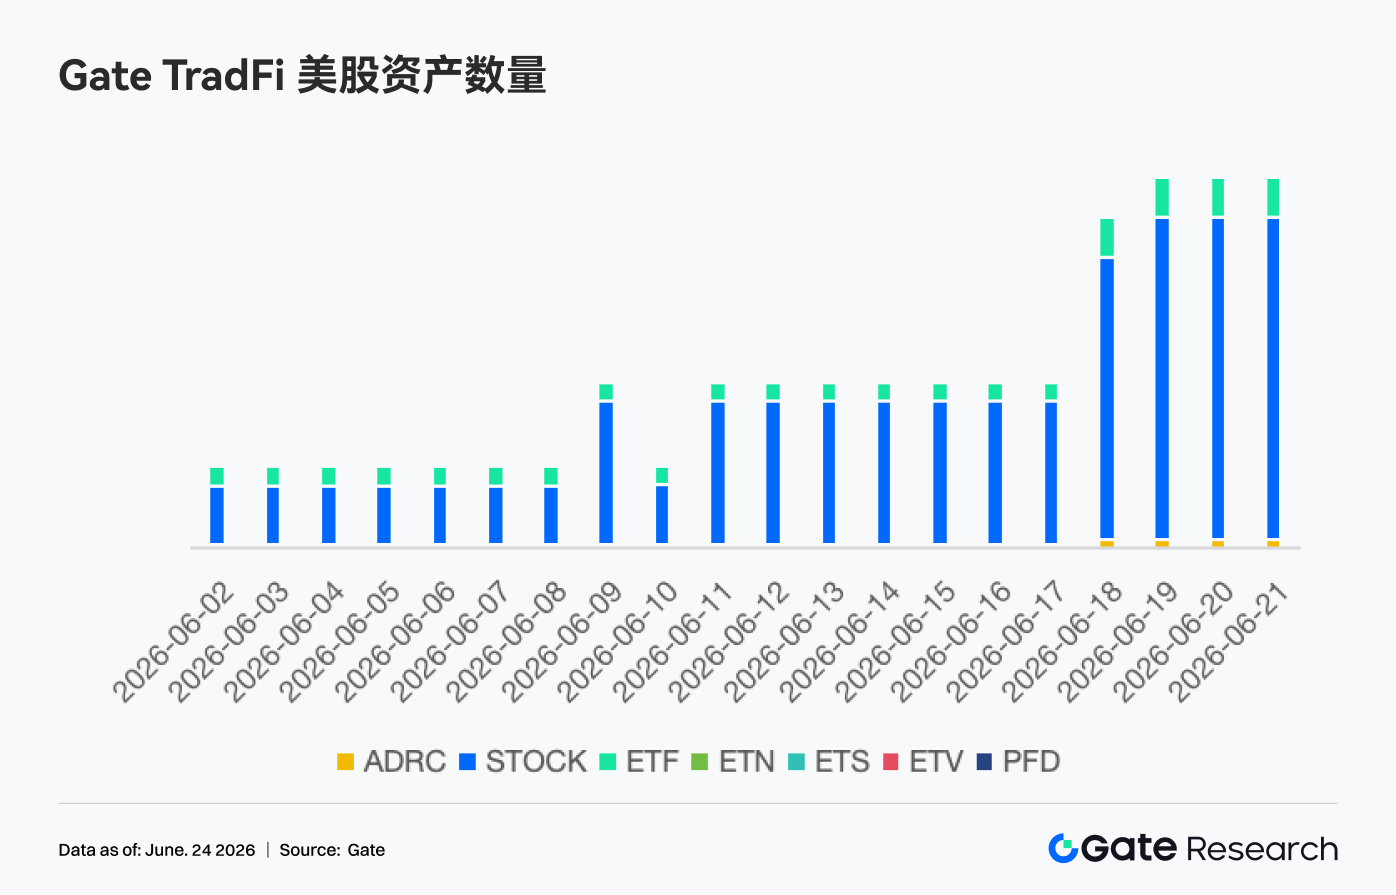
• Gate TradFi Number of U.S. Equity Assets: Gate officially launched its U.S. stock trading service on June 2. Leveraging advantages such as real underlying asset backing, direct USDT trading capability, no overnight holding fees, and high liquidity, the service has garnered sustained market attention since its launch, with trading volume growing steadily. Currently, Gate supports 7 major asset classes: ADRC, Stocks, ETFs, ETNs, ETSs, ETVs, and PFDs, and is continuously expanding its product coverage. In terms of asset count, the total number of tradable instruments has doubled since launch. Stock category growth has been the most significant, with its share of total assets rising from ~70% at launch to 85%, further enriching user investment choices. Looking ahead, Gate will continue to promote access to more markets, integrate global liquidity, and build cross-market trading capabilities, further diversifying asset coverage and strengthening its strategic position as a global asset trading and market access platform.
• TradFi Order Book Depth: We selected XAUT, the highest volume TradFi asset, to analyze its order book depth (Delta). Over the past week, XAUT order book liquidity showed clear divergence. In the first half of the week, buy-side liquidity dominated several times, pushing Delta sharply positive to a peak near $2.5 million. This drove the XAUT price from the ~$4,050 range up to ~$4,300, indicating strong market absorption. However, after June 18, as the price pulled back from highs, sell-side liquidity gradually strengthened, turning Delta persistently negative and suggesting increasing overhead supply pressure. Since June 22, negative Delta has widened significantly, with short-term aggressive sell orders prevailing, pulling the XAUT price back to around $4,120. Overall, the gold token still has buy-side support, but the short-term liquidity structure is tilted towards defense, with the market awaiting further resolution of macro uncertainty.
3. On-Chain Data Insights
3.1 DEX Volume Fails to Increase in Tandem, Uniswap Slightly Overtakes PancakeSwap
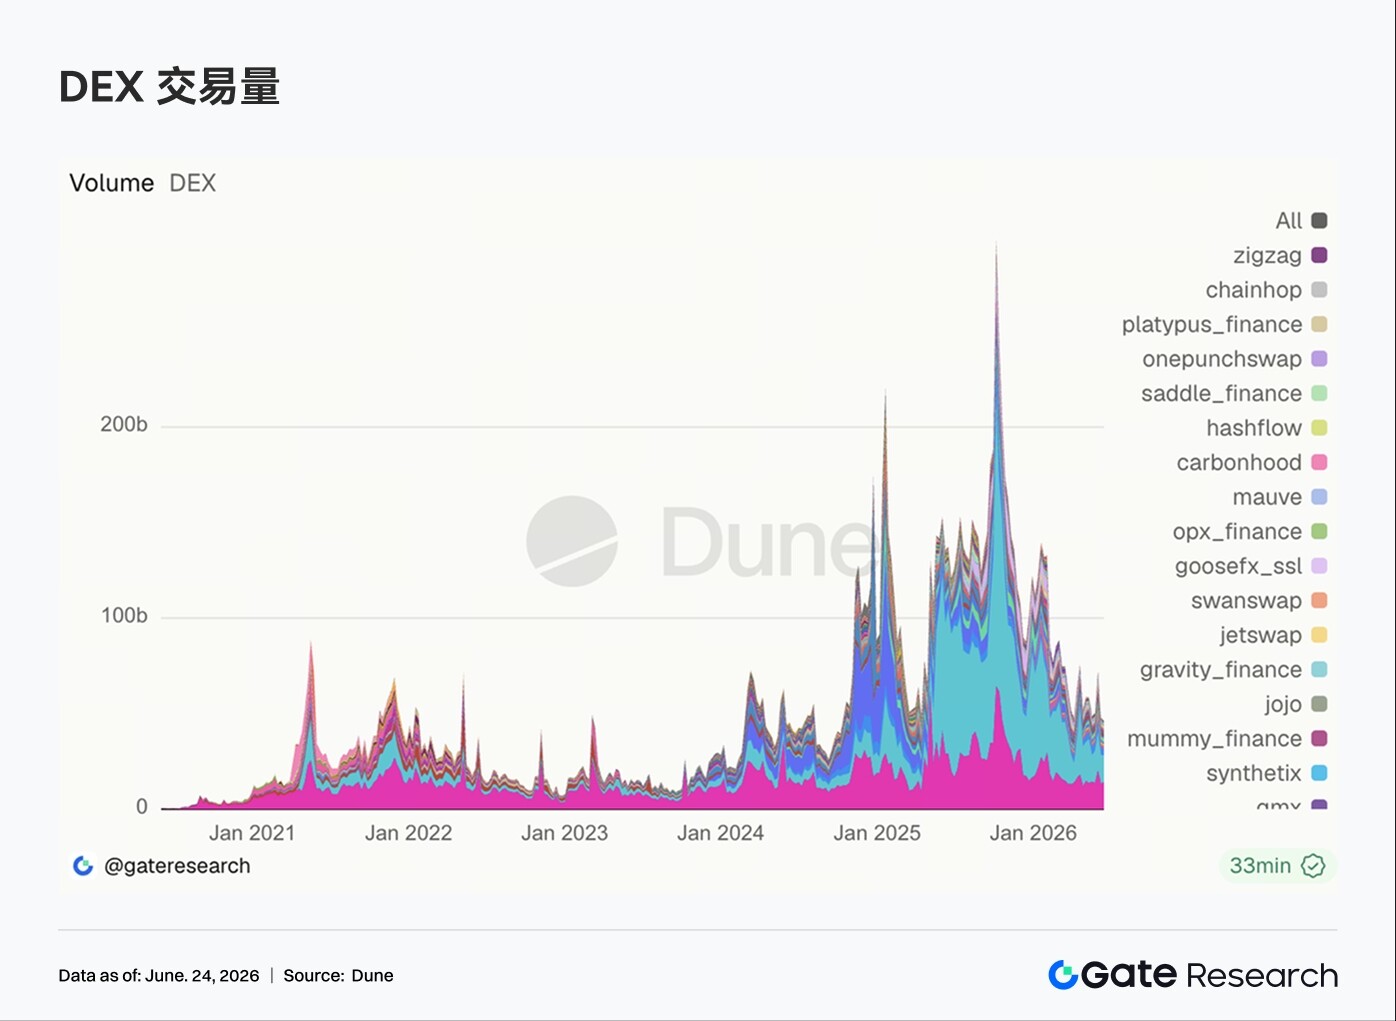
Last week, DEX trading volumes showed divergence, with the market rebound not translating into a broad-based volume increase. Uniswap recorded a weekly volume of ~$14.11 billion, slightly overtaking PancakeSwap's ~$13.98 billion. PancakeSwap declined from the previous week, while Uniswap continued its recovery. Aerodrome and Curve cooled from their prior week highs, suggesting demand for swapping on Ethereum and Base did not expand persistently. The Solana side performed stronger, with Raydium and Meteora seeing increased volume, while Whirlpool was roughly flat. PumpSwap volume rose to ~$458 million, with trader count staying above 1.26 million, but transaction count was slightly lower than the previous week. The growth last week came more from an increase in average transaction size, with limited expansion in pure retail high-frequency activity.
3.2 Stablecoin Supply Divergence, Mid-Tier Asset Performance Better Reflects On-Chain Dollar Structure Changes
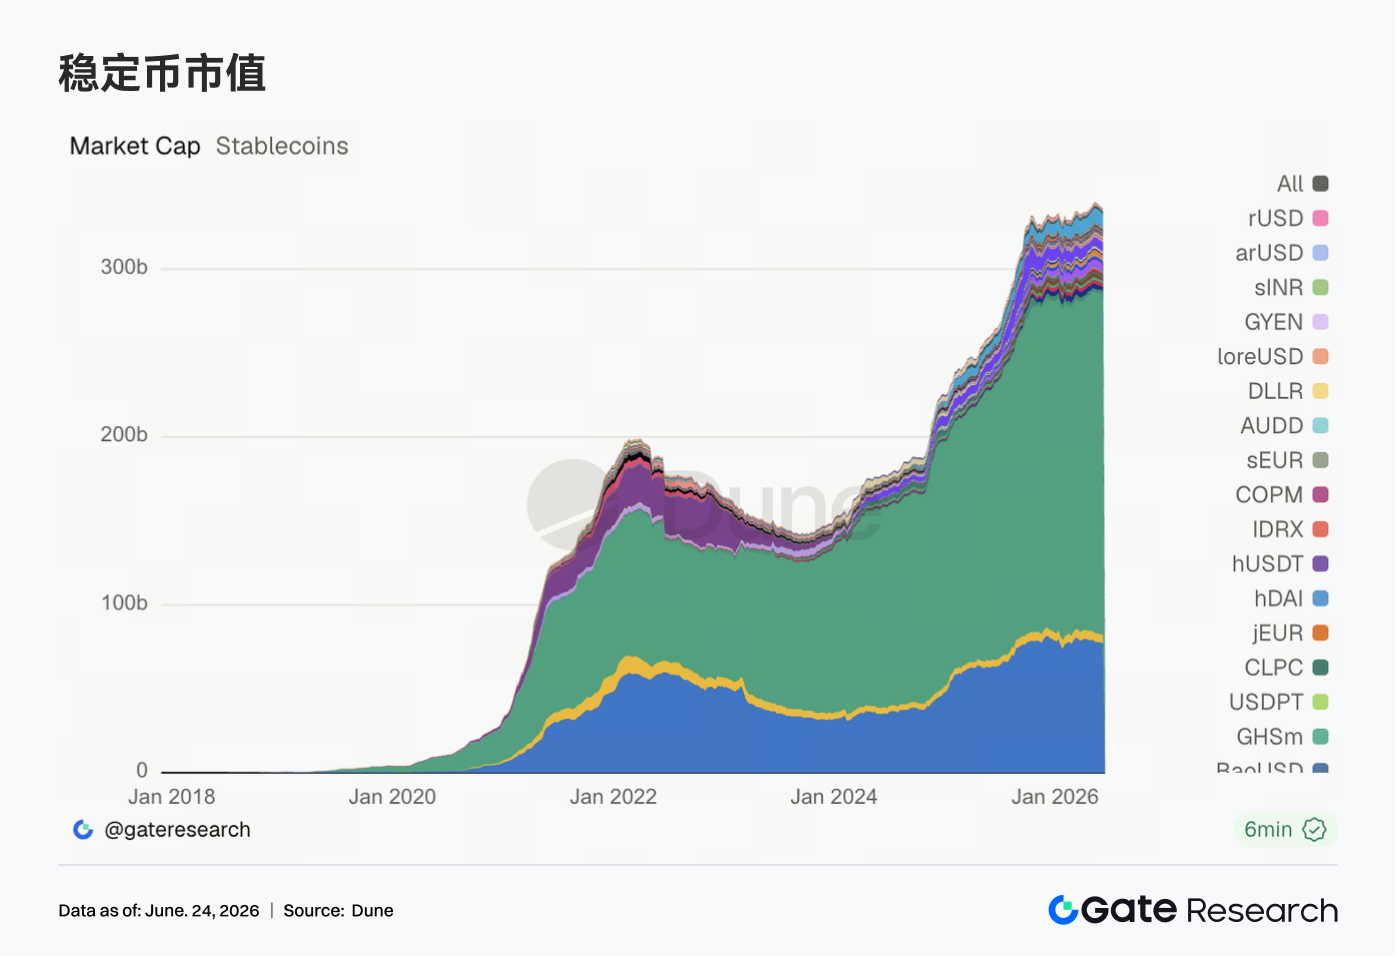
Last week, the stablecoin market showed clear divergence, with data for top assets like USDT and USDC declining. Notably, DAI remained stable around ~$4.96 billion, PYUSD slightly rose to ~$2.09 billion, and GHO held steady at ~$600 million, indicating some resilience among mid-tier stablecoins. USDe and USDS also saw declines, suggesting a slowdown in the expansion rate of yield-bearing and protocol-based stablecoins. Overall, the stablecoin market last week provided no definitive signal of new dollar inflows. On-chain capital remained primarily rotational among existing holdings, with institutional allocation preferring assets with proven liquidity, reserve transparency, and cross-chain usability.
3.3 LST Valuation Recovery Spreads, Higher Elasticity on SOL and HYPE Sides
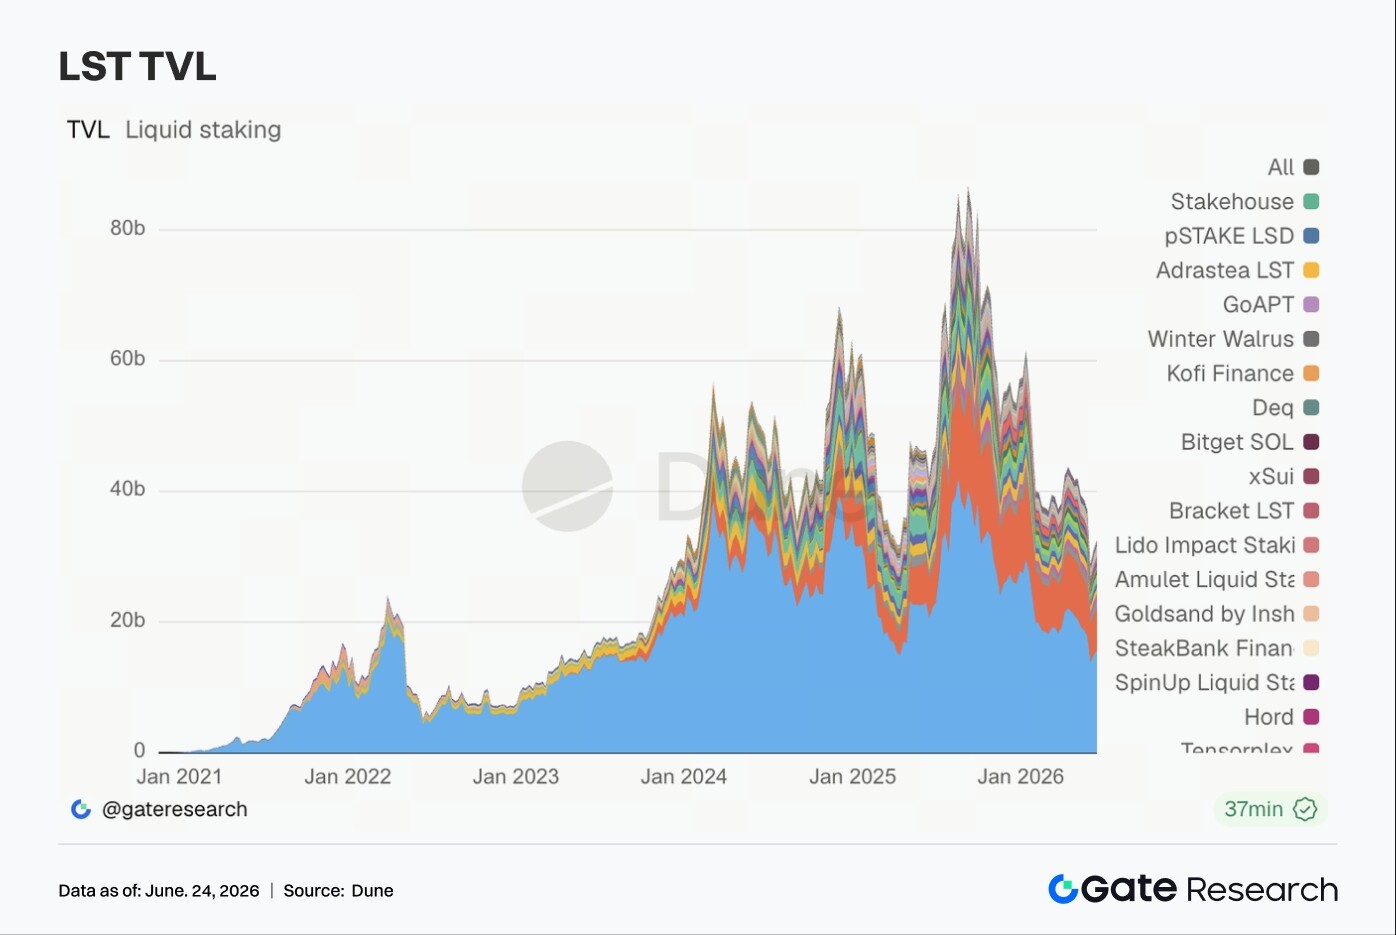
Last week, the LST sector recovered broadly, with major ETH staking protocols continuing their modest repair. Lido's TVL rose to ~$15.71 billion, Rocket Pool and StakeWise both recorded ~3% to 5% growth, suggesting the ETH staking capital bleed has not worsened for now. The SOL side showed higher elasticity, with Jito and Jupiter Staked SOL recovering notably, and Sanctum Validator LSTs also continuing to expand. Kinetiq kHYPE performed the most prominently, with TVL growing ~15% WoW. However, since TVL is denominated in USD, the increase last week is likely largely attributable to the price recovery of ETH, SOL, and HYPE, and cannot be directly equated to net staking token inflows. It currently appears more like valuation recovery and position replenishment.
3.4 Aave Lending Volume Moderately Recovers, Ethereum Provides Floor but Multi-Chain No Longer Unilaterally Weak
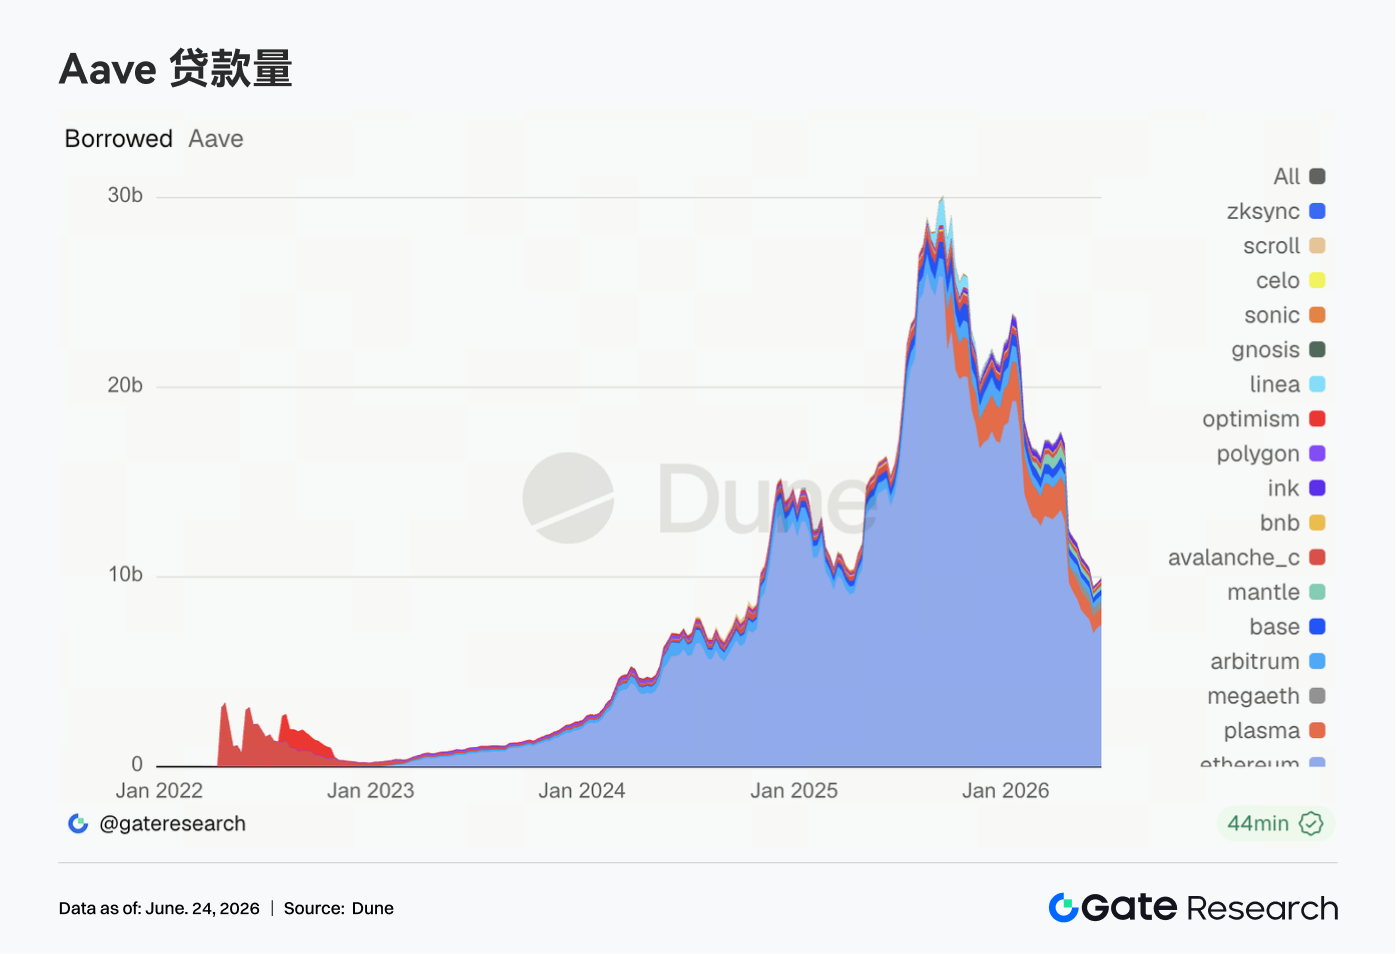
Aave's lending balance continued its recovery last week. The Ethereum market remained the core support, with borrow volume rising to ~$7.48 billion, up ~2% WoW. Multi-chain markets are no longer unilaterally weakening. Plasma, Mantle, Avalanche, and Ink all saw notable recoveries, while Arbitrum and Base also improved slightly. MegaETH and BNB Chain, however, declined. Capital is preferentially returning to markets with deeper collateral pools, liquidation liquidity, and more mature risk parameters. However, lending demand on some emerging chains has already begun to recover. Overall, Aave has transitioned from a post-incident defensive phase to a phase of selective repair, though expansion remains concentrated in markets with more reliable liquidity.
3.5 Aave Lending Rates Stabilize at Low Levels, Tail Risk for USDC Eases Further
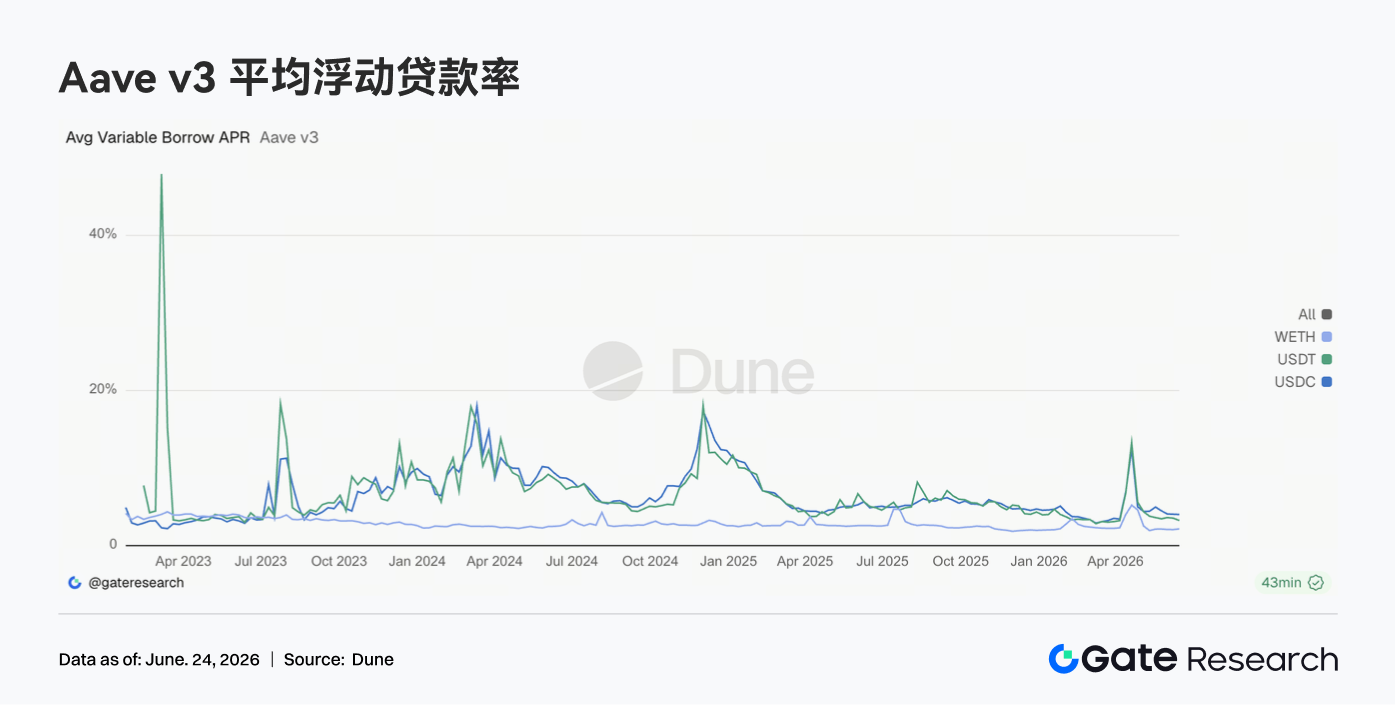
Last week, borrowing rates for major assets on Aave remained stable at low levels. The average USDC borrow rate was ~4.02%, roughly flat WoW, but the intraday high rate fell from ~10.84% to 9.36%, indicating continued easing of short-term capital tightness caused by extreme utilization. The average USDT rate fell to ~3.24%, while the average WETH rate inched up to ~2.16%, still in a low range. The recovery in borrowing balances has not triggered a rapid rise in funding costs, suggesting that leveraged demand remains restrained. The current rate environment is suitable for capital rotation, carry trades, and market-neutral strategies, but has not yet shown signs of borrowers competing for liquidity.
3.6 Protocol Revenue Declines but Structure Unchanged, Stablecoin Issuance Remains Revenue Base
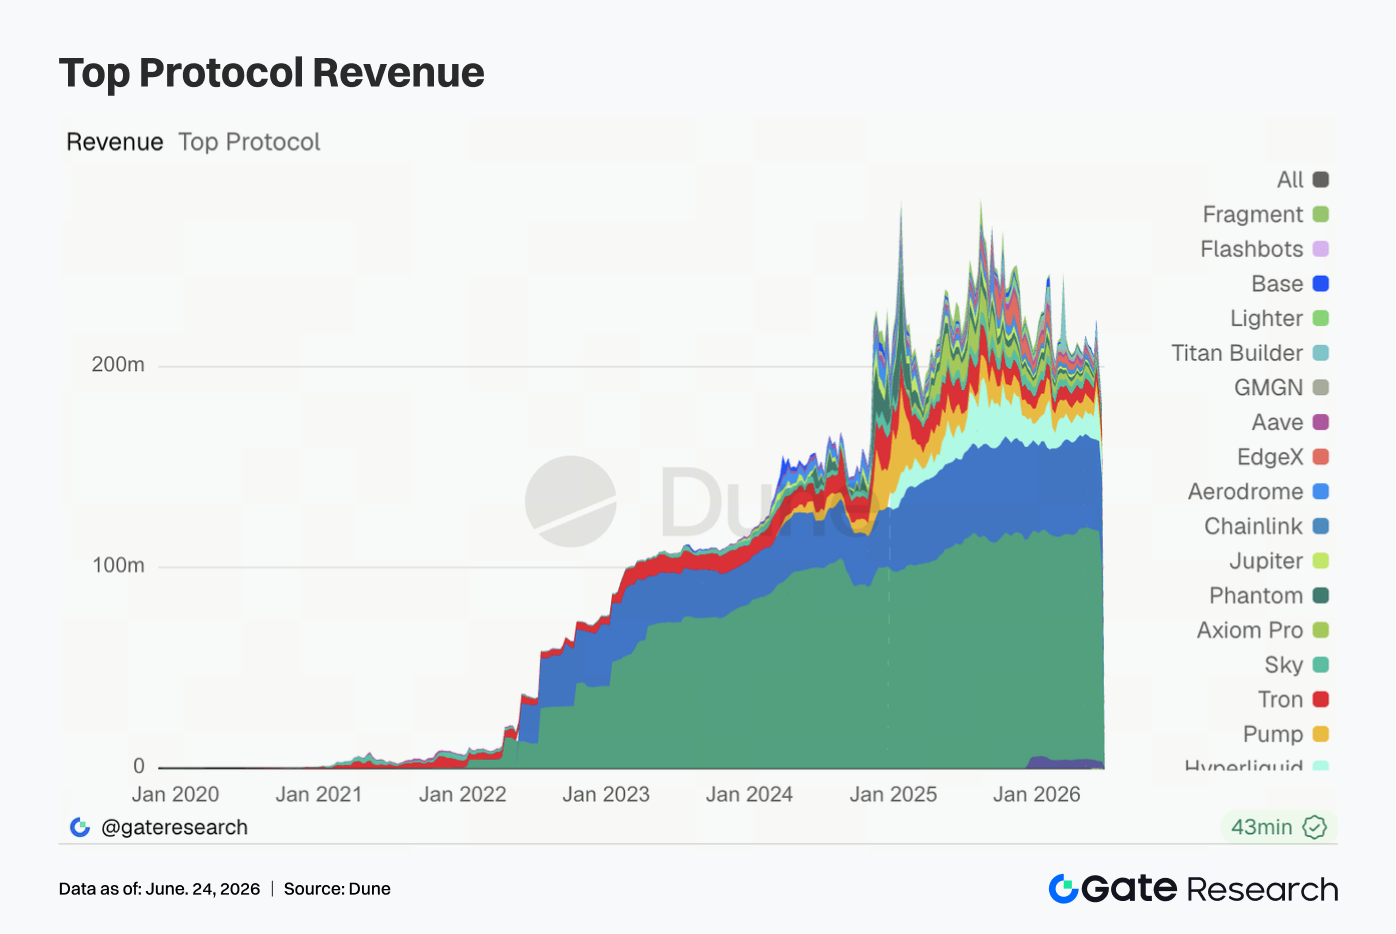
Last week, overall protocol revenue was relatively weak. Tether's revenue fell to ~$96.76 million, down ~15.5% WoW, but still significantly ahead of other protocols. Circle's revenue was ~$45.19 million, remaining stable. Hyperliquid's revenue was ~$11.57 million, a slight decline WoW, yet it remains a core revenue source among on-chain trading protocols. Revenue fell for Pump, Tron, Titan Builder, and Base, while Axiom Pro, Jupiter, Aerodrome, and Aave improved against the trend. The revenue structure did not change fundamentally: stablecoin issuance continues to provide the industry's revenue base, derivatives and trading applications contribute cyclical elasticity, and lending protocols maintain stable but limited revenue repair in the low-rate environment.
4. Derivatives Tracking
4.1 BTC Funding Rate Holds Positive but OI Falls Rapidly, Leveraged Positions Continue to Be Liquidated
Last week, the BTC price oscillated at low levels overall. It traded around $65k-$66k at the start of the week, then fell to the $62k-$63k range around June 17. Despite some phased recovery afterwards, it remained around $64k over the weekend, failing to reclaim the $66k level significantly.
Regarding OI, there was a notable decline last week. OI was still above $23 billion near June 15, then rapidly fell to around $21 billion, and maintained low-level