






Gate 기관 주간 보고서: 워시 Fed 의장 취임, Aave 대출 수요 계속 마이그레이션


- 核心观点:上周加密市场在宏观事件(美伊谈判、联储换帅)与ETF持续净流出背景下表现谨慎,BTC与ETH经历深度回调后修复。链上资金结构发生转变,TradFi交易重心从商品向股票回流,跨链安全风险凸显,衍生品市场呈现低杠杆、低波动的弱势震荡格局。
- 关键要素:
- 宏观压力与ETF流出:美伊谈判反复、美债收益率升至4.56%及联储换帅压制风险偏好。BTC、ETH ETF周净流出分别达12.56亿美元和2.16亿美元,市场情绪悲观。
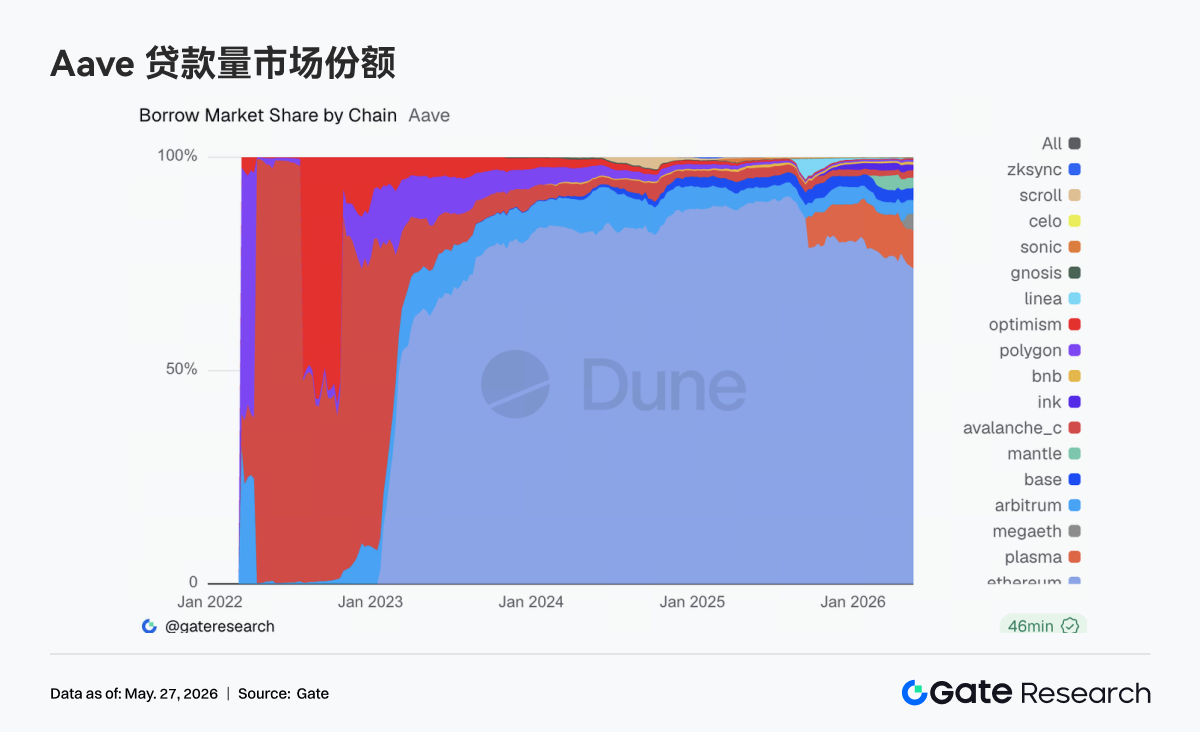
- 链上资金迁移:DEX交易向Uniswap、PancakeSwap等头部协议集中;Aave借贷需求从Ethereum V3向Plasma、MegaETH等新市场迁移。
- TradFi DEX分化:黄金与原油交易仍为主导但热度降温,股票与AI相关资产交易活跃度回升,显示资金从宏观避险重新回流风险资产。
- 跨链安全损失:跨链基础设施过去一个月累计损失近4亿美元,攻击面从桥合约扩展至验证网络、TSS与链下RPC,市场重新评估相关风险。
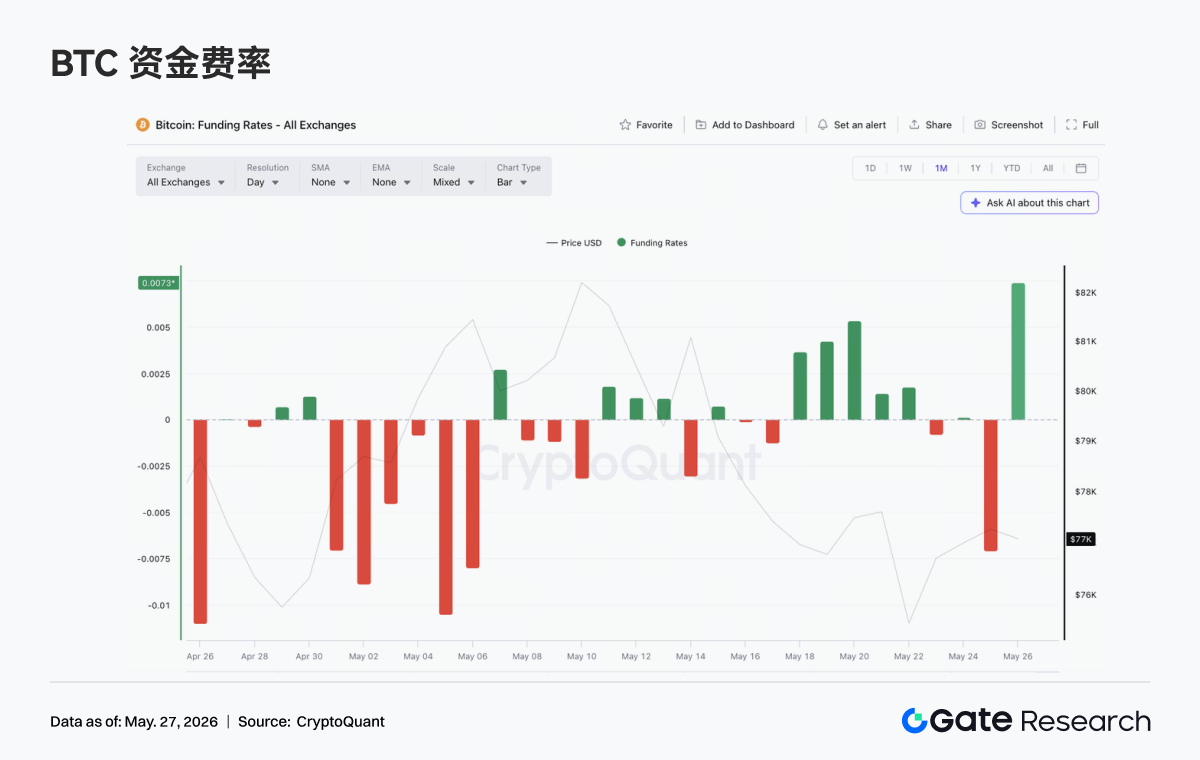
- 衍生品弱势结构:BTC资金费率短暂转正但价格偏弱,未平仓量(OI)低位震荡;期权波动率(DVOL)下行至36附近,同时Skew修复但仍为负值,表明市场无恐慌但下行保护需求未消。
Summary
• Last week, the market was driven by US-Iran diplomatic negotiations, a surge in US Treasury yields, and the change in Fed leadership, leading to a significant increase in volatility across global risk assets.
• BTC and ETH experienced a deep pullback followed by a recovery amid continued net outflows from ETFs, but overall market sentiment remained cautious.
• On-chain capital continued to migrate to execution layers like Arbitrum and Base, while capital flows towards main chain staking, prediction markets, and macro trading themes notably cooled down.
• Trading in TradFi Perp DEX remained primarily centered on gold and crude oil, but activity in stock and AI-related assets began to pick up, indicating capital flowing back into risk assets.
• Cross-chain infrastructure has suffered cumulative losses of nearly $400 million over the past month, with attack vectors expanding from bridge contracts to validation networks, TSS, and off-chain RPC, prompting a market reassessment of cross-chain security.
• The derivatives market exhibited a structure of "low leverage, low volatility, weak price." While Skew has somewhat recovered, demand for downside protection has not completely dissipated.
• Institutional contract and spot market share remained stable, with BTC/USDT and ETH/USDT market shares rising 5% month-on-month. CrossEx added spot trading from a major exchange by the end of May.
1. Market Focus Interpretation
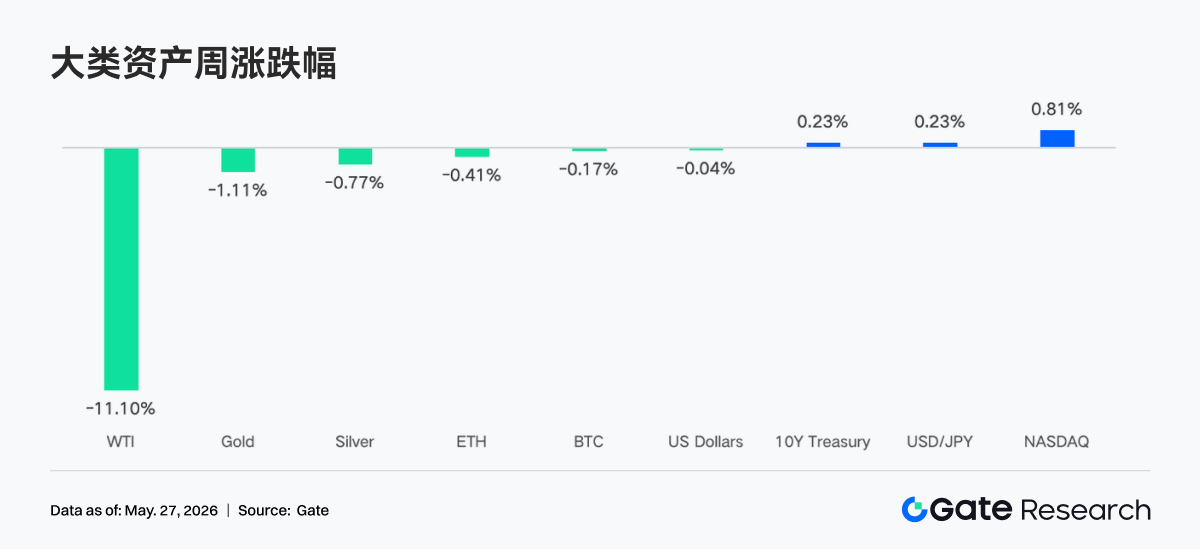
The biggest theme last week was US-Iran diplomatic negotiations. Trump claimed they were in the "final stage," but Secretary of State Rubio stated on Friday that "no agreement has been reached." Geopolitical uncertainty continued to drive various asset prices. Suppressed by optimism surrounding peace talks, WTI briefly fell to $98.88/barrel. Fed Chair Powell's term ended, and Kevin Warsh was officially sworn in as the new Fed Chair on May 23. Although he hinted at an openness to rate cuts, the market's short-term expectations for rate cuts have significantly cooled. The yield on the 10-year US Treasury note surged to around 4.56%. US stocks rose for the eighth consecutive week, but divergence was evident. Nvidia reported Q1 revenue of $81.6 billion, an 85% increase year-over-year, significantly exceeding expectations, indicating strong demand for AI infrastructure. However, the stock price reaction was muted and failed to rally substantially. SpaceX officially filed for an IPO, aiming to raise $75 billion with a potential valuation of up to $1.75 trillion.
Overall market sentiment in the cryptocurrency space last week was tilted towards pessimism and caution. Continued net outflows from Bitcoin and Ethereum ETFs reflected investor concerns about macroeconomic uncertainty, cryptocurrency price volatility, and the regulatory outlook. Particularly, the large-scale net outflows from Bitcoin ETFs for two consecutive weeks exacerbated market fear.
2. Liquidity Analysis
2.1 BTC and ETH ETFs Continue to Show Significant Capital Outflows
Last week, the BTC ETF market continued to experience significant capital outflows. May 18 recorded a net outflow of $648.60 million, the largest single-day outflow of the week. The total net outflow for the week was $1,256.30 million, expanding further compared to the previous week's $995.50 million net outflow, indicating persistently pessimistic market sentiment and continued reduction of Bitcoin exposure by institutional investors.
The Ethereum ETF market also faced capital pressure with sustained net outflows. A net outflow of $86.40 million on May 18 was the largest single-day outflow of the week. The total weekly net outflow amounted to $216.00 million. Compared to the previous week's net outflow of $255.20 million, the outflow scale narrowed, but it remains in a state of capital exodus overall, suggesting cautious sentiment towards Ethereum ETFs.
• BTC ETF Highest Net Flow Product:
○ MSBT (Morgan Stanley): Weekly net inflow of $1.10 million
• ETH ETF Highest Net Flow Products:
○ ETHB (BlackRock): Weekly net inflow of $5.50 million
○ ETHW (Bitwise): Weekly net inflow of $2.90 million
• Overall AUM: As of May 22, AUM for BTC ETFs stood at $98.87 billion. AUM for ETH ETFs stood at $13.45 billion. The BTC ETF market experienced outflows exceeding $1.2 billion, leading to a decrease in total AUM, though it remains at elevated levels.
• Institutional Movement: Institutional fund flows showed clear divergence this week. For Bitcoin ETFs, most products continued to face outflow pressure, with BlackRock's IBIT net outflows exceeding $1 billion, indicating selling by large institutions. However, Morgan Stanley's MSBT bucked the trend with a slight net inflow, suggesting some institutions might be engaging in tactical allocation or risk hedging. For Ethereum ETFs, BlackRock's ETHB and Bitwise's ETHW saw small net inflows, possibly related to market expectations for Ethereum's future development or potential positive catalysts, though overall market outflows dominated.
2.2 TradFi Liquidity
• TradFi Perp DEX: Over the past week, trading activity for TradFi assets on Perp DEX remained high overall, but the structure showed clear divergence. Commodity assets still dominated, particularly crude oil and gold-related trades contributing the bulk of volume. However, as US-Iran negotiations eased and oil prices fell, commodity trading volume has cooled from recent highs. Meanwhile, the share of stock and index trading increased, reflecting market capital beginning to flow back from macro and geopolitical trades towards US equities and AI-related themes. ETF and forex trading remained relatively stable, indicating that on-chain TradFi trading demand is shifting from single-event-driven dynamics towards a more balanced multi-asset allocation structure.
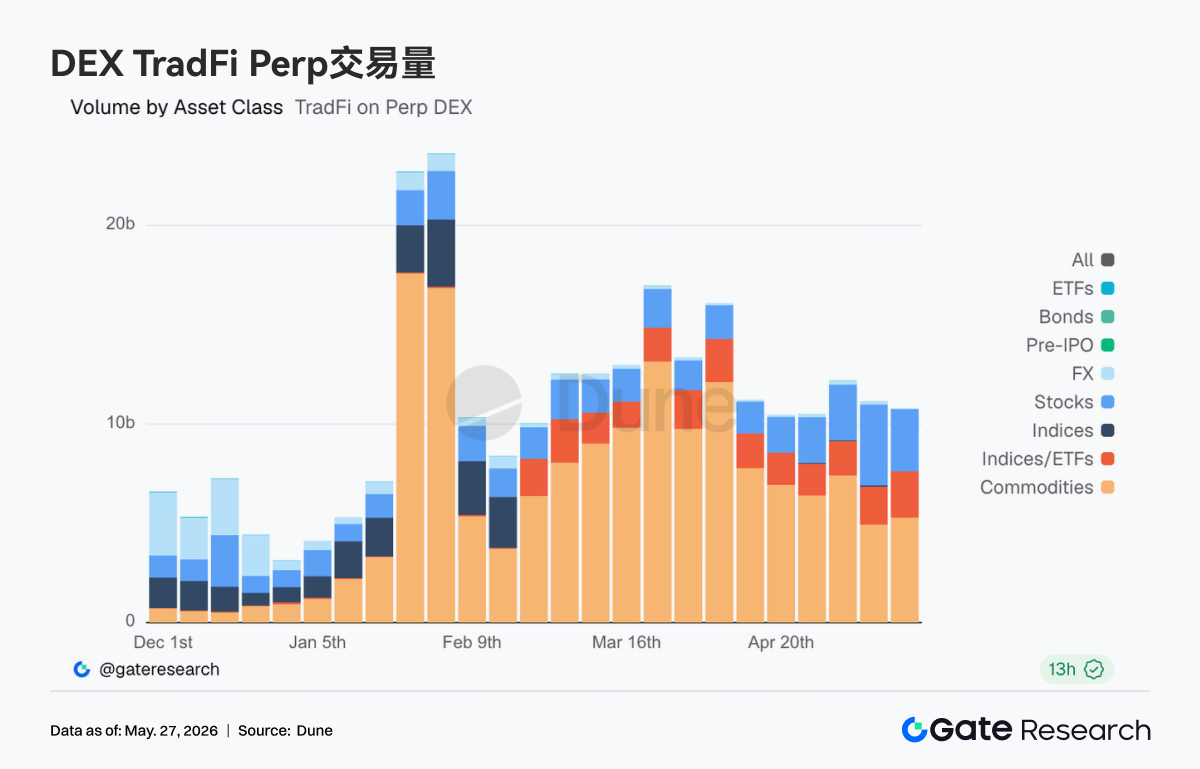
• Gate TradFi Perp: Over the past week, Gate TradFi Perp trading volume remained active overall but has notably cooled from its March peak. Looking at the structure, precious metals still dominate, with gold-related trades continuing to generate the majority of volume, reflecting strong risk-off demand amidst rapidly rising global bond yields and fluctuating geopolitical conditions. However, entering this week, single-day trading volume has significantly declined from previous cyclical peaks, indicating that the high-frequency trading heat surrounding gold, crude oil, and macro events is fading. Concurrently, the share of stock trading has rebounded, especially increased activity in AI and tech-related assets, suggesting some capital is rotating back into risk assets from macro risk-off trades. Index, forex, and commodity trading remained stable at low levels, indicating that while on-chain TradFi trading is still centered on gold, the market structure is gradually shifting from "event-driven" to a more balanced multi-asset allocation.
• TradFi Order Book Depth: We selected XAUT, which has the highest TradFi trading volume, to analyze its order book depth (Delta). Last week, the liquidity structure of the XAUT order book underwent a "bearish first, bullish later" transition. Early on May 13, there was extreme negative Delta, bottoming near -$2.2 million, with market liquidity clearly skewed bearish. This coincided with XAUT rapidly falling from around $4.70K to near $4.60K, indicating strong selling pressure and liquidity order removal early on. From May 15 to 17, Delta turned significantly positive, consistently maintaining between +$500K and +$1.3 million. This represents buy orders beginning to accumulate, with clear bid support appearing in the order book. However, prices did not strongly rebound in tandem, suggesting this was more "absorptive liquidity" rather than active buying pressure. Notably, a clear recovery was seen on May 24-25, with green Delta bars rapidly expanding again while prices rebounded back above $4.55K. However, active buy order volume was not yet sufficient to push XAUT into a strong trending up move.
3. On-Chain Data Insights
3.1 DEX Trading Maintains High Resilience, Volume Concentrates Towards Mainstream Liquidity Centers
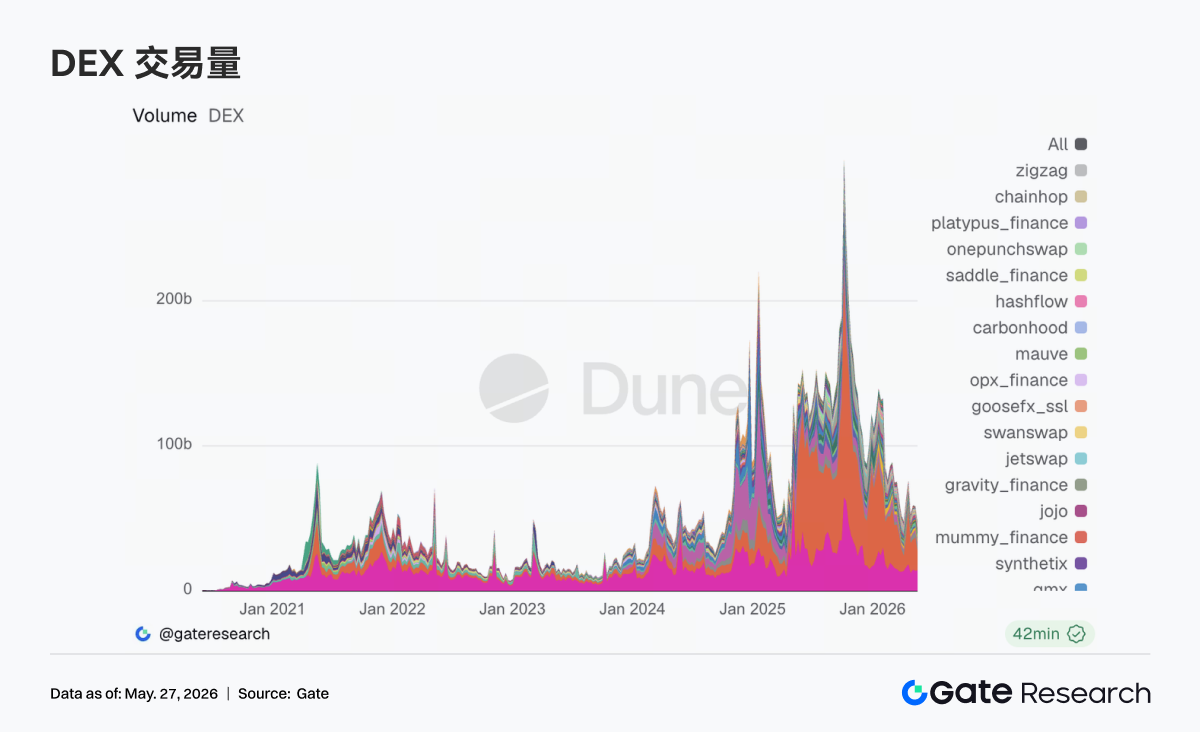
On-chain trading maintained strong resilience this week despite the overall cooling of risk assets. After May 18, Bitcoin briefly fell to two-week lows, but DEX trading volume did not stall concurrently. Instead, capital further concentrated towards mainstream protocols with deeper liquidity and more stable execution efficiency. Uniswap and PancakeSwap continued to occupy core market share, with Base ecosystem's Aerodrome seeing further increased activity. On-chain trading demand has not retreated; rather, it shows a preference for mature routing and low-slippage platforms in a volatile environment. On the Solana side, Raydium and Meteora remained at high levels, but marginal growth significantly slowed compared to previous weeks, with heat in Meme and high-volatility capital pools beginning to cool. On the regulatory front, after the Senate Banking Committee advanced the crypto market bill in mid-May, the market's valuation for compliant trading infrastructure has increased, further concentrating on-chain liquidity towards leading protocols.
3.2 Stablecoin Market Enters Structural Repricing Phase, Settlement Capability and Institutional Suitability Become Core Variables
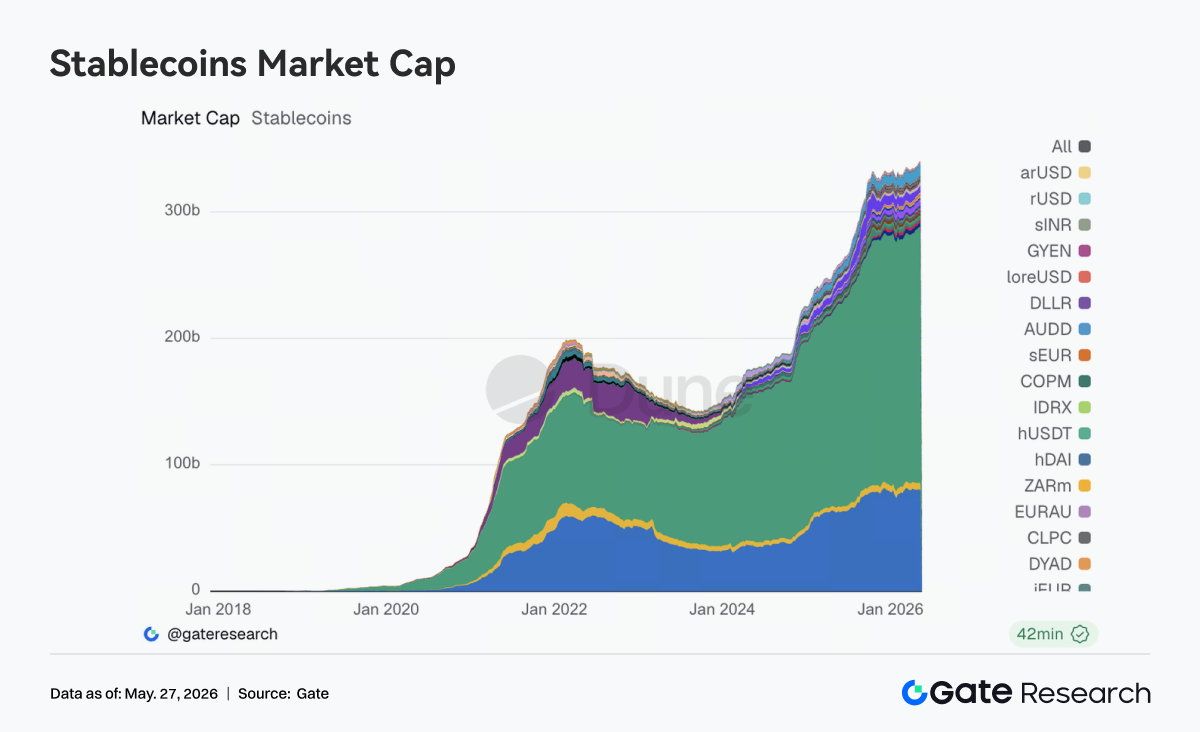
This week, the stablecoin sector did not see rapid aggregate expansion, but internal structural adjustments deepened. USDT and USDC maintained their dominant positions, but the focus of new capital inflows has shifted from pure scale growth towards payment, clearing, cross-chain distribution, and institutional suitability. Assets like USDS, USDe, and PYUSD still have some absorption capacity, but the market's distinction between "yield-bearing stablecoins" and "general-purpose USD settlement assets" has become clearer. Circle continued this week to strengthen USDC's positioning in cross-chain settlements, high-frequency trading, and institutional distribution scenarios, with the market refocusing on stablecoin assets that can directly integrate with mainstream financial systems. Simultaneously, regulatory discussions on stablecoin yield mechanisms and regulatory boundaries continue to progress. The valuation logic for the stablecoin market is gradually shifting from scale-first to a compliance-standardization-ability-first approach. Overall, sentiment in the stablecoin sector was stable this week, but the direction is quite clear.
3.3 ETH LST Assets Under Pressure, SOL Ecosystem Assets Relatively Stable
The liquid staking sector entered a more evident phase of structural divergence. Core ETH-based assets like Lido saw some pullbacks, with some large capital reallocating positions and duration configurations after the initial recovery. In contrast, SOL-side assets showed more resilience, with Sanctum, Jito, and Jupiter Staked SOL maintaining overall stability, and no significant outflow pressure was apparent in the sector. The core variable affecting LST risk appetite this week remained cross-chain security and asset standardization. Mid-May, Lido provided further explanation for choosing Chainlink CCIP for wstETH's cross-chain expansion, prompting the market to refocus on bridging security and standardized asset frameworks. Following the Kelp and cross-chain bridge incidents, the market has begun to better differentiate the risk levels between natively standardized LSTs and cross-chain-wrapped secondary-packaged assets.
3.4 Aave Lending Demand Continues Migrating, New Markets Improve Absorption Capacity
Aave's main change this week centered on the structural adjustment of lending demand. Total borrowing across the platform decreased slightly week-over-week. Ethereum V3 maintained its core status, but its marginal driving effect weakened compared to the previous period. Concurrently, the lending absorption capacity of Plasma and MegaETH continued to increase, with MegaETH showing particularly strong performance. Capital residence time and activity levels notably improved, gradually transitioning from narrative-driven to genuine liquidity absorption. On the governance front, on May 20, Aave proceeded with rotating Emergency Guardian signers, elevating the priority of emergency response and cross-chain risk control. Earlier governance actions concerning WETH unfreezing and LTV restoration also indicated that the protocol has gradually shifted from the risk management phase following the rsETH/Kelp chain incident towards a normalization and rebuilding phase. Based on the current structure, capital is flowing back into the Aave ecosystem, but with a stronger preference for on-chain scenarios offering new incentives and growth potential in new markets.
3.5 Aave Interest Rate Structure Normalizes, US Dollar Liquidity Premium Remains Evident
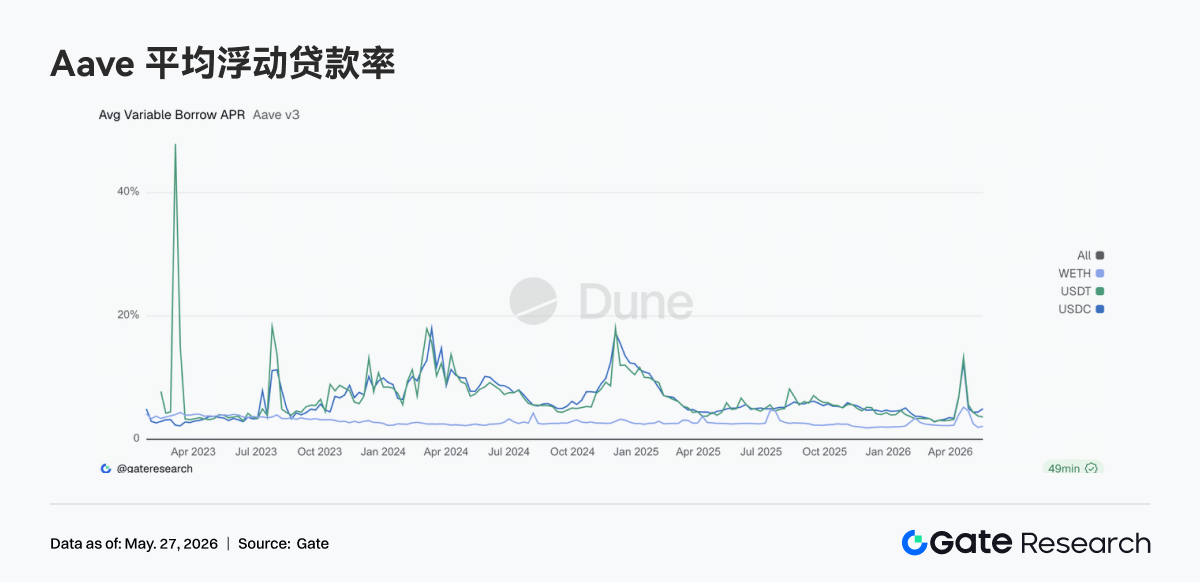
Aave's stablecoin borrowing costs have clearly moved away from the high-pressure state during the late April incident. USDT and USDC funding rates have fallen back into normal operational ranges, while WETH borrowing costs have declined further. The core change in the market is that capital usage has returned to a normal structure. Demand for stablecoin financing is primarily focused on arbitrage, neutral strategies, and liquidity turnover, while there has been no new one-sided borrowing rush on the WETH side. However, USDC utilization remains relatively high, indicating that USD liquidity is still the capital category with the highest premium in the market. Nonetheless, the overall financing environment has significantly eased the tense sentiment seen during the recent risk event. Combined with the further strengthening of emergency mechanisms and the Guardian framework on the governance side this week, the current change in Aave rates represents a normalization repricing process following the release of risk.
3.6 Protocol Revenue Reverts to Dominance of Stablecoins and Infrastructure
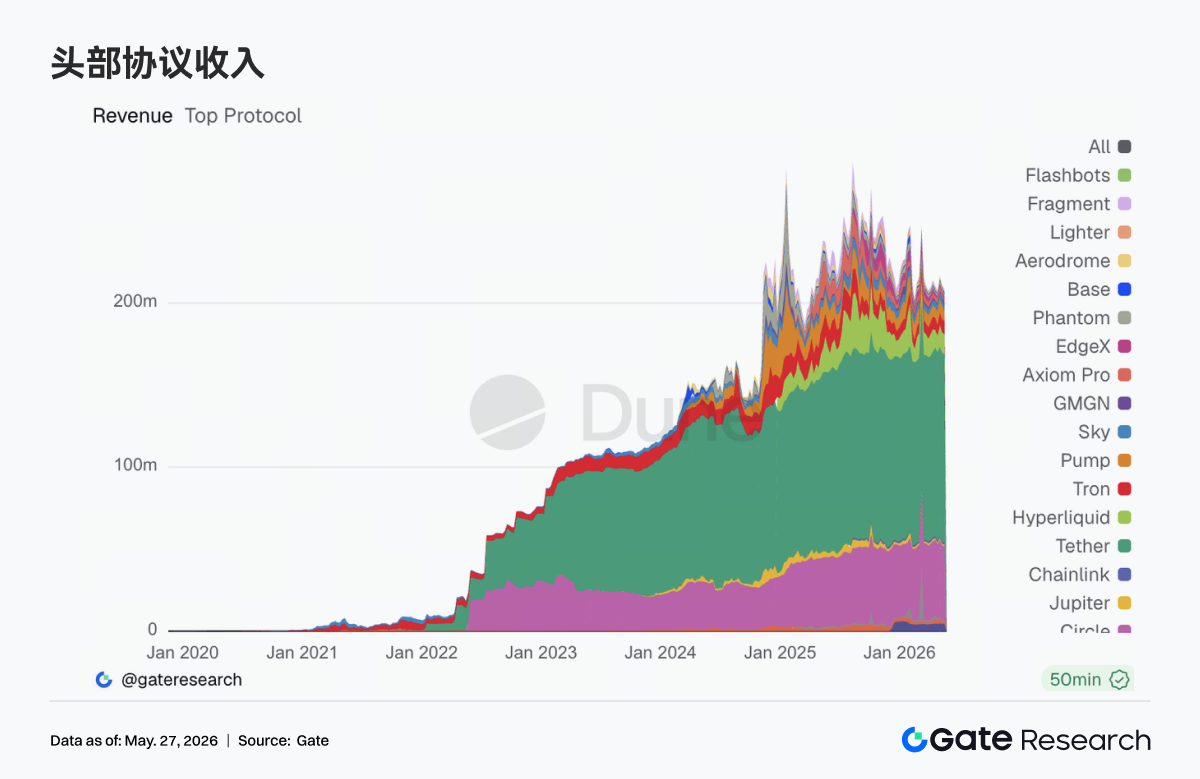
The structure of protocol revenue has stabilized significantly compared to previous weeks. Tether and Circle continue to show the most stable revenue performance, with the stablecoin issuance end remaining the core sector with the highest on-chain cash flow quality. Among trading protocols, Hyperliquid's revenue continued to hold at high levels, but its growth rate has clearly slowed. Revenue from protocols driven by high-frequency traffic and trade entry points like Pump, Phantom, and Axiom also began to cool. In contrast, underlying matching and infrastructure components like edgeX and Titan Builder showed stronger resilience. Recently, Hyperliquid continues to pursue expansion directions in validators, RWA perpetuals, and event markets, while Circle simultaneously strengthened USDC support for Hyperliquid. The market's long-term demand for efficient on-chain trading systems has not diminished. However, this week's revenue structure shows that user activity expansion is no longer spilling over indefinitely, and capital is refocusing on the underlying settlement, matching, and clearing layers capable of sustaining cash flow generation. Overall, the logic for protocol revenue is gradually returning to being driven by cash flow quality.
4. Derivatives Tracking
4.1 BTC Funding Rate Remains Positive but Price Weak, Leveraged Longs Under Pressure
From May 18 to May 24, 2026, the BTC price maintained a weak range-bound trend, trading around 77K at the start of the week. Although there were intermittent bounces, it failed to reclaim the 78K-79K range effectively. Prices briefly dipped sharply around May 22 and remained at relatively low levels over the weekend. Diverging from the price action, the funding rate remained positive multiple times from May 18 to May 22, especially with the positive rate continuously rising from May 18 to May 20. This indicates that despite the weak price backdrop, some long positions maintained their leverage exposure.
This combination of "weak price + positive funding rate" suggests the market still held expectations for bottom fishing or a rebound trade early in the week. However, as BTC failed to recover upwards, long positions in the positive rate environment suffered from persistent holding costs. Subsequently, the funding rate gradually declined, indicating a cooling of long sentiment.
In terms of OI, it oscillated within the 25B-26B range throughout the week, notably lower than the recent highs around 29B. During the rapid price decline on May 22, OI briefly increased to near 26B, suggesting that new directional positions were added during the decline. However, OI subsequently fell again, indicating that leveraged funds did not form a sustained buildup. Overall, the derivatives market was in a state of low-leverage consolidation this week, with the price decline reflecting more of a reduction in risk appetite rather than a large-scale leveraged liquidation event.
4.2 Options Volume Declines Then Rises, Increased Share of Daily Options Indicates Higher Short-Term Trading Demand
BTC options volume followed a pattern of declining first, then rising, and subsequently falling again. Volume was high early on May 18, approaching 29K, then fell to the 16K-19K range from May 19 to May 20 as the market digested macro events and price movements early in the week, leading to a temporary cooling of trading activity. Entering May 21 and 22, volume increased again, reaching approximately 26K on May 22, marking the second distinct peak of the week. This coincided with the sharp decline in BTC price, indicating that demand for hedging and short-term volatility trading increased simultaneously during the sell-off.
Structurally, monthly options remained the primary source of volume, especially on May 18 and around May 20, suggesting the market still favored medium-term positioning and risk management. However, more notable this week was the significant increase in the share of daily options. From May 21 to 23, the proportion of daily options (yellow bars) expanded markedly, especially on May 22, where they contributed a significant portion of volume. This indicates that during price declines and heightened short-term volatility, the market tends to favor short-term instruments for event trading or rapid hedging.


