
Ethereum 2026 Q1 Review: On-Chain Activity Hits New Highs, Tokenized Assets Lead the Industry
- Core Thesis: In Q1 2026, Ethereum's on-chain usage scale (monthly active users, transaction volume, throughput) reached new all-time highs. However, the scale of USD-denominated assets and fees contracted simultaneously, presenting a diverging trend of "rising volume, falling price." This stems from reduced transaction costs driven by proactive scaling (such as the Fusaka upgrade and Blob parameter optimizations). Concurrently, institutions accelerated their deployment in tokenized assets, solidifying Ethereum's core position as the global financial settlement layer.
- Key Elements:
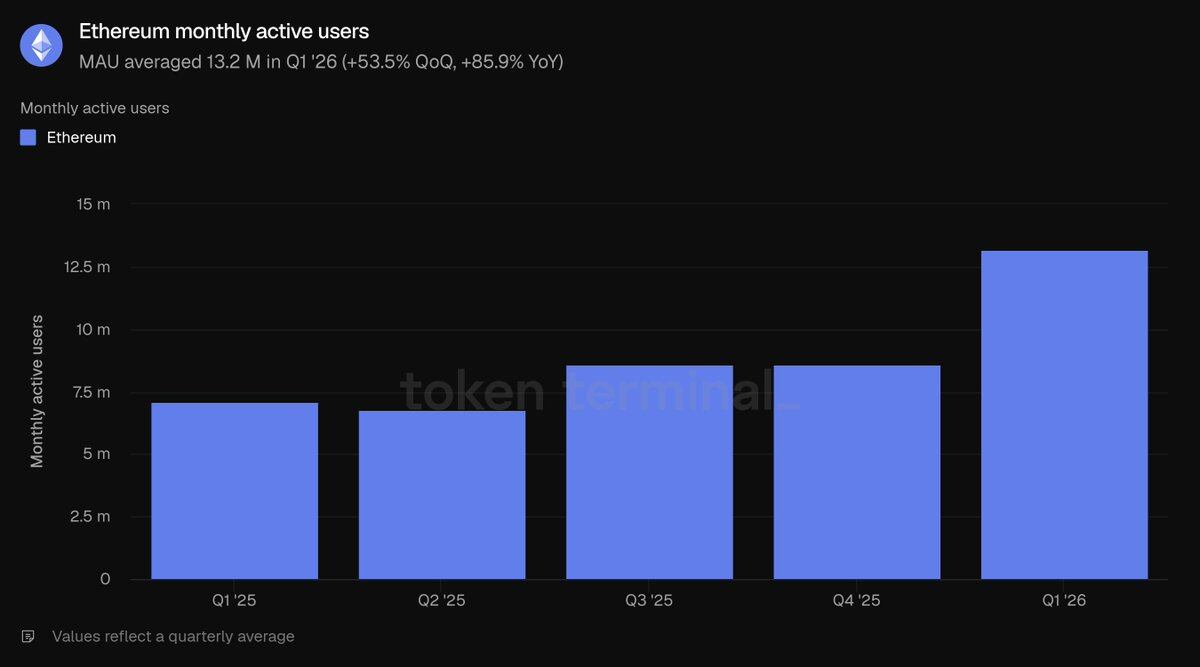
- On-chain usage scale hits new highs: 13.2 million monthly active users (+53.5% QoQ), 200.4 million transactions (+38% QoQ), TPS of 25.78 (+41.2% QoQ), all setting records.
- Asset scale and revenue decline: Total Value Locked (TVL) at $316.2 billion (-11% QoQ), ETH fully diluted market cap at $290 billion (-30.3% QoQ), total ecosystem fees at $2 billion (-16.9% QoQ), mainnet fees at $39.9 million (-47.9% QoQ).
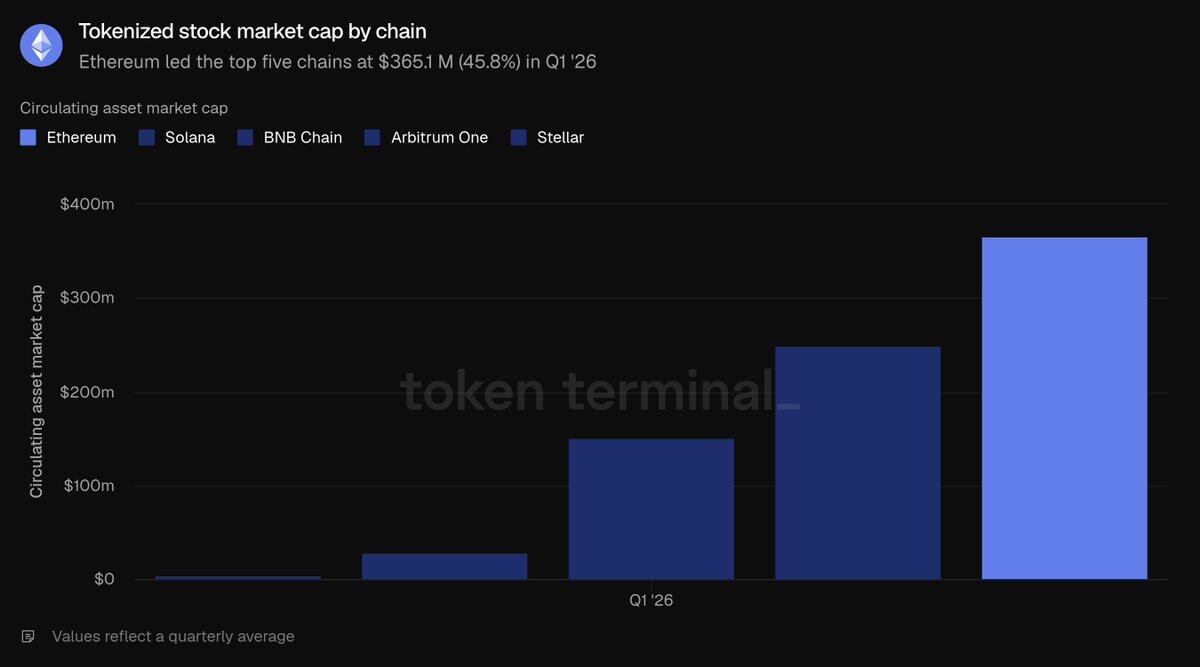
- Differentiation in tokenized asset categories: Stablecoins $178.9 billion (-2.3% QoQ), Tokenized Funds $19.4 billion (+4.9% QoQ), Commodities $4.7 billion (+60% QoQ), Equities $365.1 million (+16.5% QoQ). Ethereum dominates all sub-sectors among the top five public chains.
- Scaling strategy drives cost reduction: Blob scaling increased block capacity, leading to a 38% rise in total transactions while fees shrank by nearly half, reflecting Jevons paradox; the team anticipates long-term demand growth will offset short-term revenue losses.
- Accelerated institutional deployment: BlackRock, JPMorgan, Fidelity, and others launch on-chain funds; a consortium of 12 European banks prepares a compliant Euro stablecoin, promoting Ethereum as the preferred settlement network for institutions.
- Staking and holder metrics remain robust: ETH staking ratio rises to 0.31, number of holding addresses reaches 292.8 million (+8.1% QoQ), indicating that user long-term confidence remained unshaken during the market downturn.
- Ecosystem structure and advantages: Ethereum accounts for 71% of TVL, 79.2% of lending, 61.8% of stablecoins, 73% of tokenized funds, and 84% of commodities among the top five public chains. Liquidity, composability, and institutional use cases create a formidable moat.
Original Author: Token Terminal
Original Compilation: Saoirse, Foresight News
Ethereum serves as the core underlying settlement network for on-chain assets, relying on ETH for transaction fees and staking to maintain network security. Traditional finance suffers from slow settlements, numerous intermediaries, and high counterparty risks, while tokenized assets and stablecoins offer on-chain solutions. With relevant regulations maturing between 2025 and 2026, the conditions are ripe for institutions to officially deploy on-chain businesses.
Various stablecoins, tokenized funds, commodities, and on-chain stocks are issued and settled on Ethereum. Layer 2 networks divert transactions before ultimately returning to Layer 1 for final confirmation, allowing ETH to continuously accrue value. By market capitalization, Ethereum remains the world's largest platform for tokenized assets, operated jointly by the Ethereum Foundation and the developer community. Teams like Etherealize specifically engage with traditional financial institutions to drive institutional capital inflow. The Ethereum ecosystem showed a divergent trend in Q1 2026, which is analyzed in detail below using Token Terminal's comprehensive data.
The market in Q1 2026 presented a starkly contrasting picture: on-chain usage reached an all-time high – monthly active users, total transactions, and throughput all broke records. However, dollar-denominated asset sizes and fee metrics simultaneously contracted, with fully diluted market cap, total value locked, trading volume, and both types of fees all declining quarter-over-quarter. Key events this quarter profoundly shaped this unique market scenario:
In January, the second round of the Fusaka upgrade cycle, the Blob Parameter Only fork (BPO#2), was implemented, significantly enhancing data storage capacity.
In February, the ERC-8004 standard went live on the mainnet, becoming the universal standard for AI agent identity and credit ratings.
The Ethereum Foundation established three core protocol goals for 2026: scaling, optimizing user experience, and strengthening Layer 1 underlying security.
In March, the Institutional Ethereum Forum was held, with significantly increased participation enthusiasm from traditional financial institutions.
Q1 2026 Core Metrics Overview
Ecosystem Total Value Locked: $316.2 billion (QoQ -11.0%, YoY +22.8%)
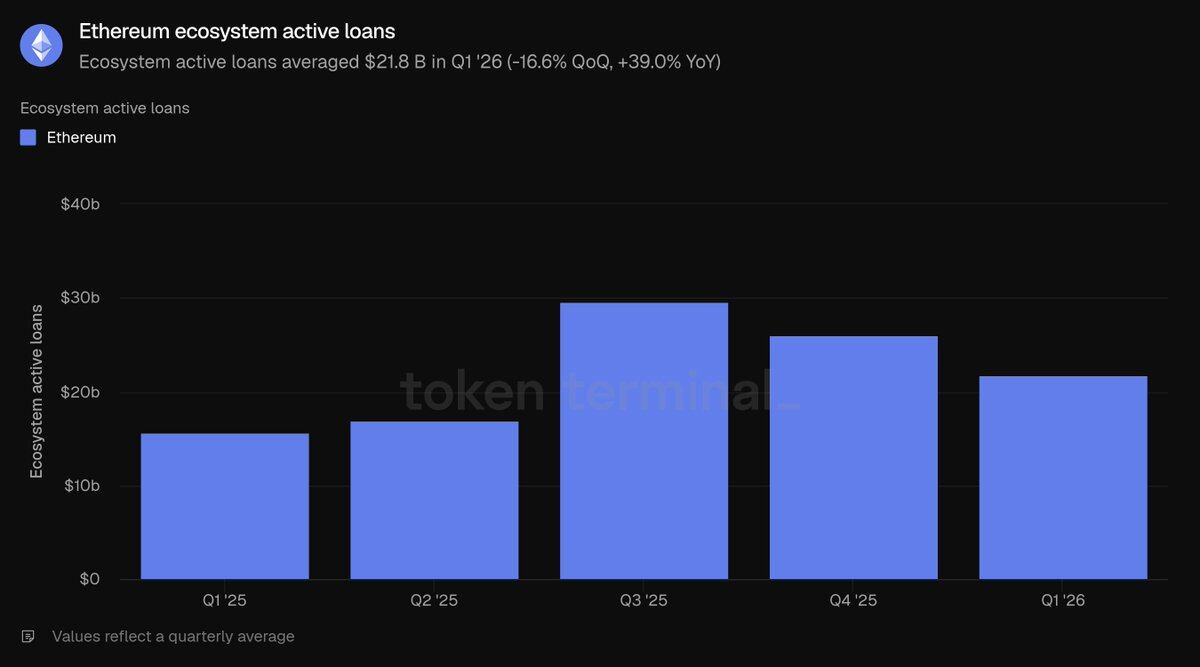
Ecosystem Outstanding Active Loans: $21.8 billion (QoQ -16.6%, YoY +39.0%)
Ecosystem Decentralized Exchange Total Volume: $134.5 billion (QoQ -24.0%, YoY -31.2%)
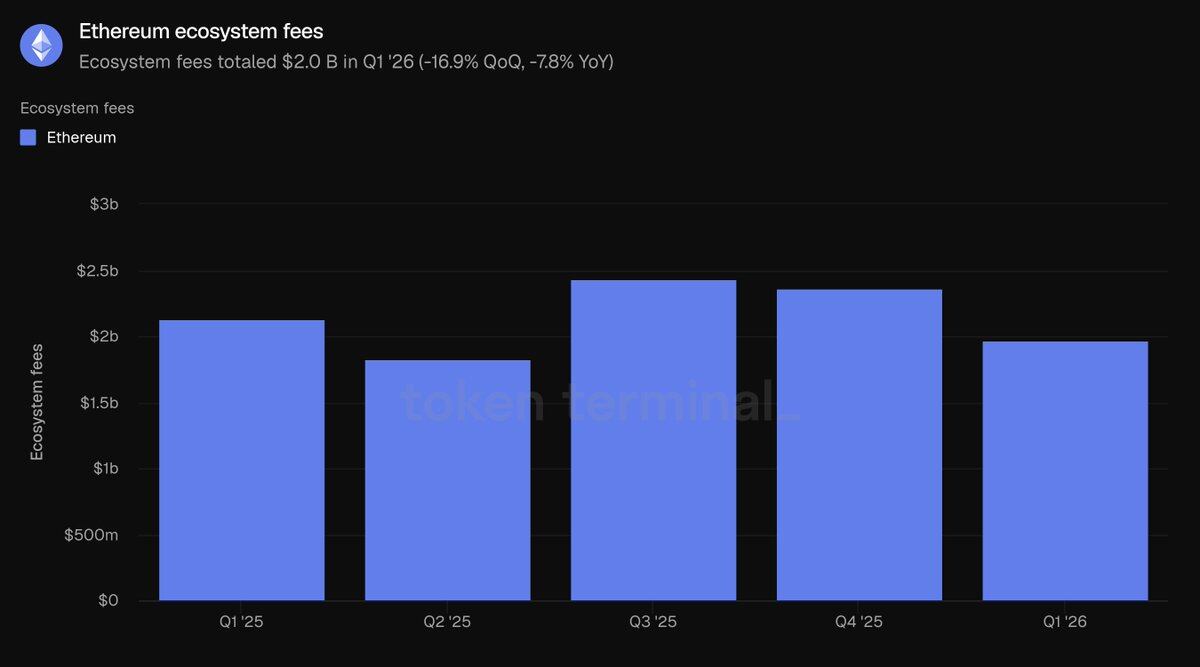
Total Ecosystem Application Fee Revenue: $2 billion (QoQ -16.9%, YoY -7.8%)
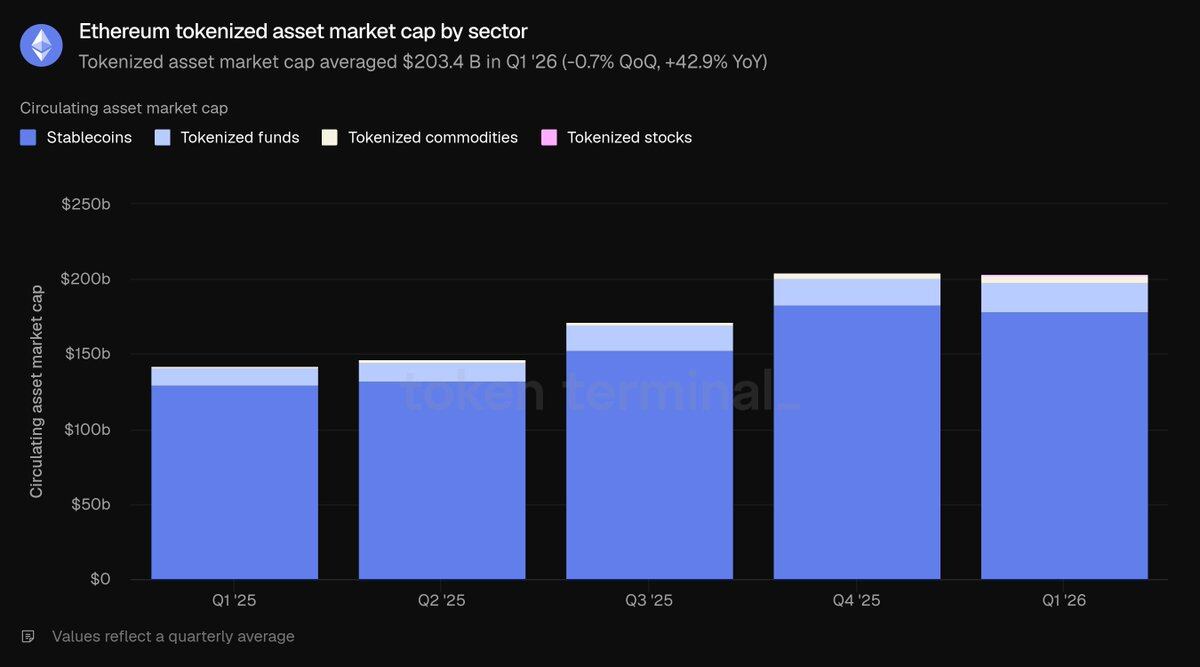
Total Market Cap of On-Chain Tokenized Assets: $203.4 billion (QoQ -0.7%, YoY +42.9%)
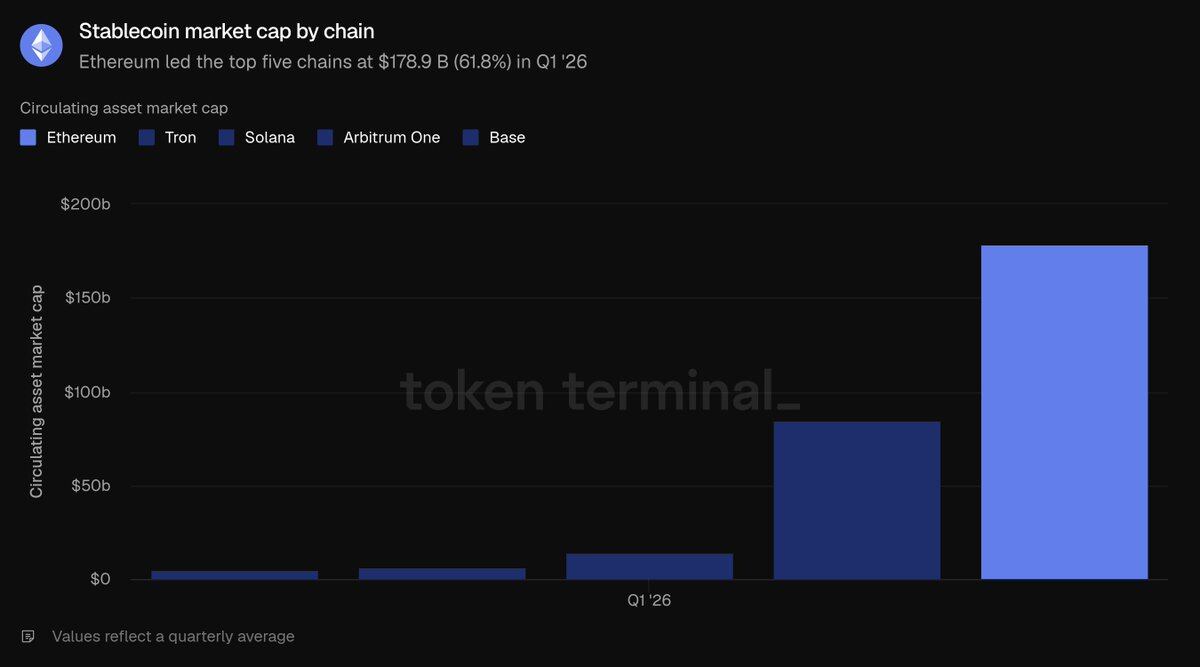
Stablecoins: $178.9 billion (QoQ -2.3%, YoY +37.6%)
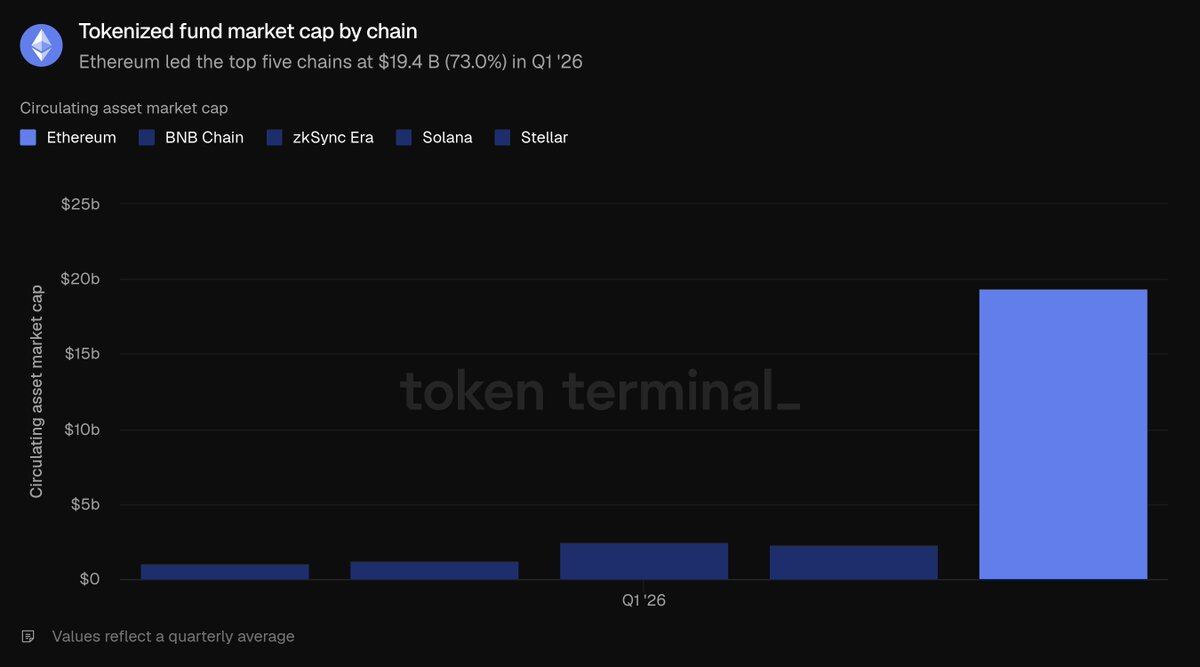
Tokenized Funds: $19.4 billion (QoQ +4.9%, YoY +73.1%)
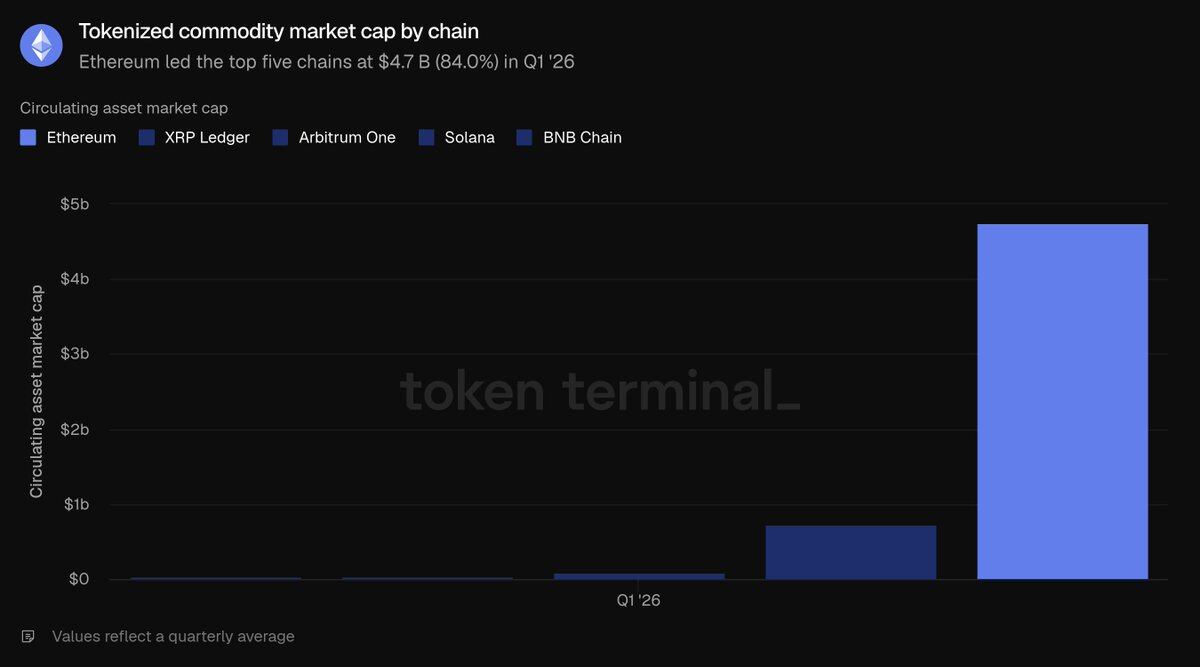
Tokenized Commodities: $4.7 billion (QoQ +60.0%, YoY +325.9%)
Tokenized Stocks: $365.1 million (QoQ +16.5%)
Monthly Active User Addresses: 13.2 million (QoQ +53.5%, YoY +85.9%)
Total Layer 1 Transaction Count: 200.4 million (QoQ +38.0%, YoY +81.5%)
Average Transactions Per Second: 25.78 (QoQ +41.2%, YoY +81.7%)
Total Layer 1 Mainnet Transaction Fee Revenue: $39.9 million (QoQ -47.9%, YoY -81.9%)
ETH Fully Diluted Market Cap: $290 billion (QoQ -30.3%, YoY -9.9%)
ETH Staking Ratio: 0.31 (QoQ and YoY both increased by 0.03)
Total ETH Holding Addresses: 292.8 million (QoQ +8.1%, YoY +24.9%)
Note: The scope of this report includes only the Ethereum Layer 1 mainnet. Layer 2 networks are treated as independent blockchains, and their related data is not included in Ethereum's statistics.
Overall Ecosystem Development
Total Value Locked (TVL) refers to the total dollar value of assets deposited in various on-chain applications. It is a leading indicator for revenue-generating activities like lending, trading, and staking. This statistic tracks the on-chain capital deposited across the entire Ethereum ecosystem that users can withdraw at any time. In Q1 2026, the average TVL of the Ethereum ecosystem reached $316.2 billion, down 11.0% QoQ but up 22.8% YoY. The QoQ contraction was due to the overall price correction in crypto assets, while the significant YoY growth demonstrates substantial ecosystem expansion compared to the same period last year.
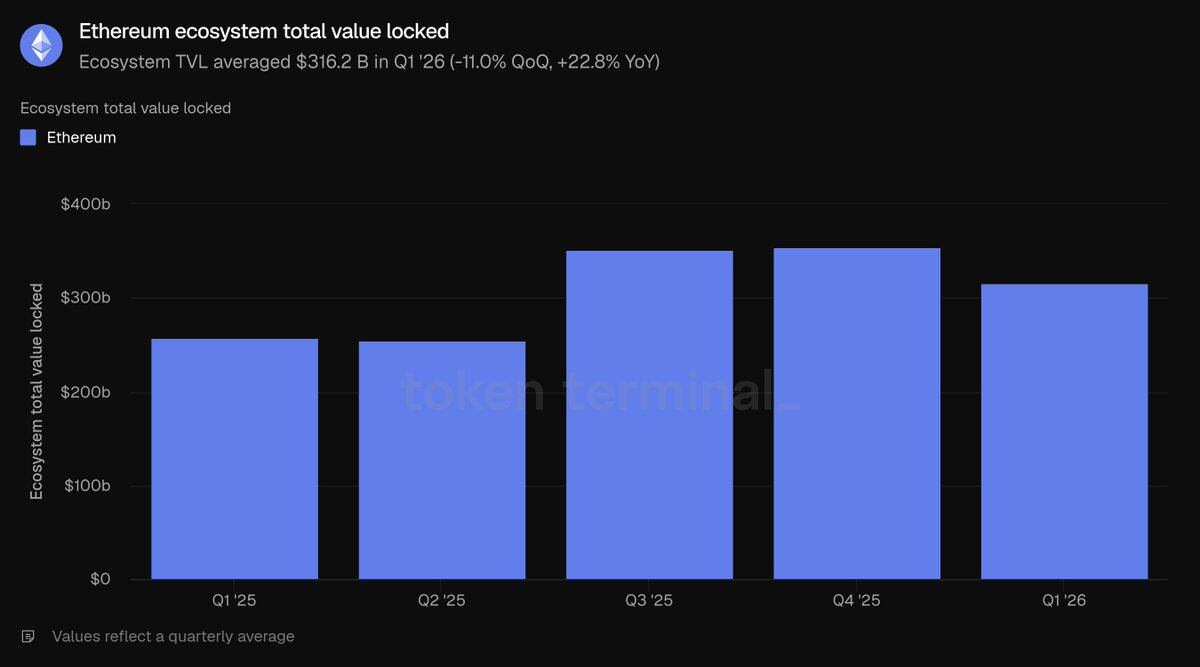
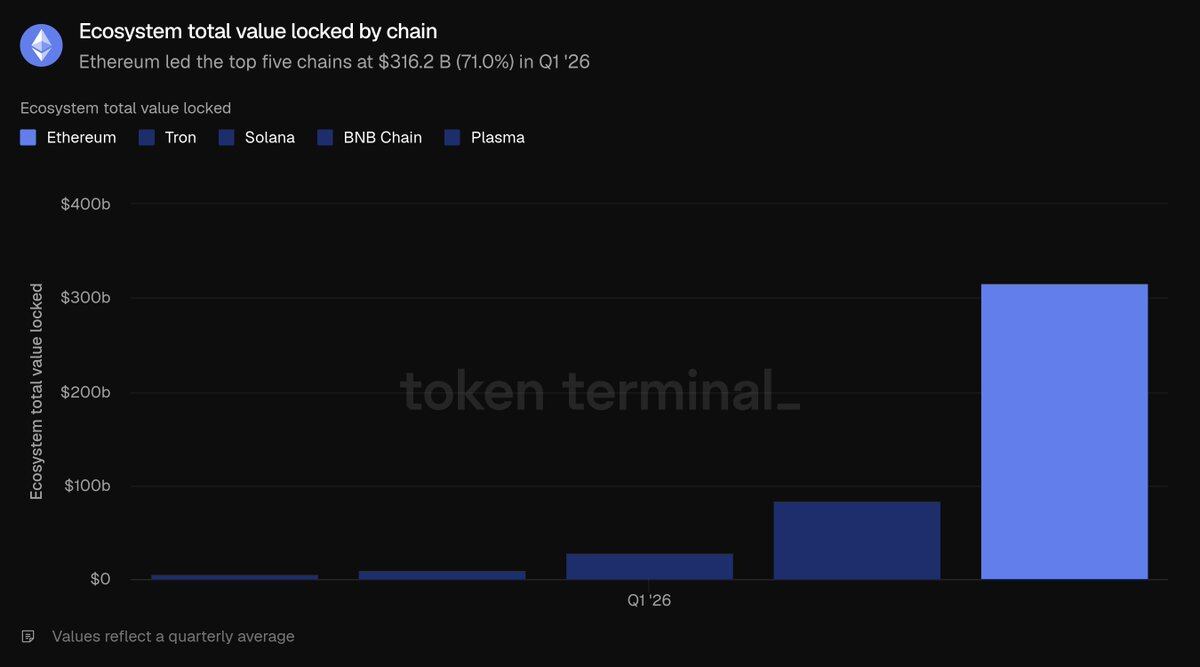
Among the top five major public chains, Ethereum's TVL is in a league of its own: $316.2 billion far exceeds the combined total of Tron ($84.5B), Solana ($28.8B), BNB Chain ($10.3B), and Plasma ($5.7B), accounting for 71% of the total TVL across these five chains. Capital is primarily concentrated in two major tracks: the liquid staking track led by Lido and the lending track centered around Aave. Restaking protocols like EigenLayer and ether.fi, as well as synthetic dollar stablecoin platforms like Ethena and Sky, also hold significant capital. This high concentration of capital is Ethereum's most prominent structural advantage.
The active loans metric represents the size of deposits that users have lent out to generate interest income, directly reflecting lending business revenue. This statistic tracks the total outstanding loans across all Ethereum lending applications. The average active loan scale in Q1 was $21.8 billion, a decrease of 16.6% QoQ but an increase of 39.0% YoY. The contraction in loan balances alongside TVL indicates a cooling of overall market risk appetite, but the scale remains significantly higher than the same period last year.
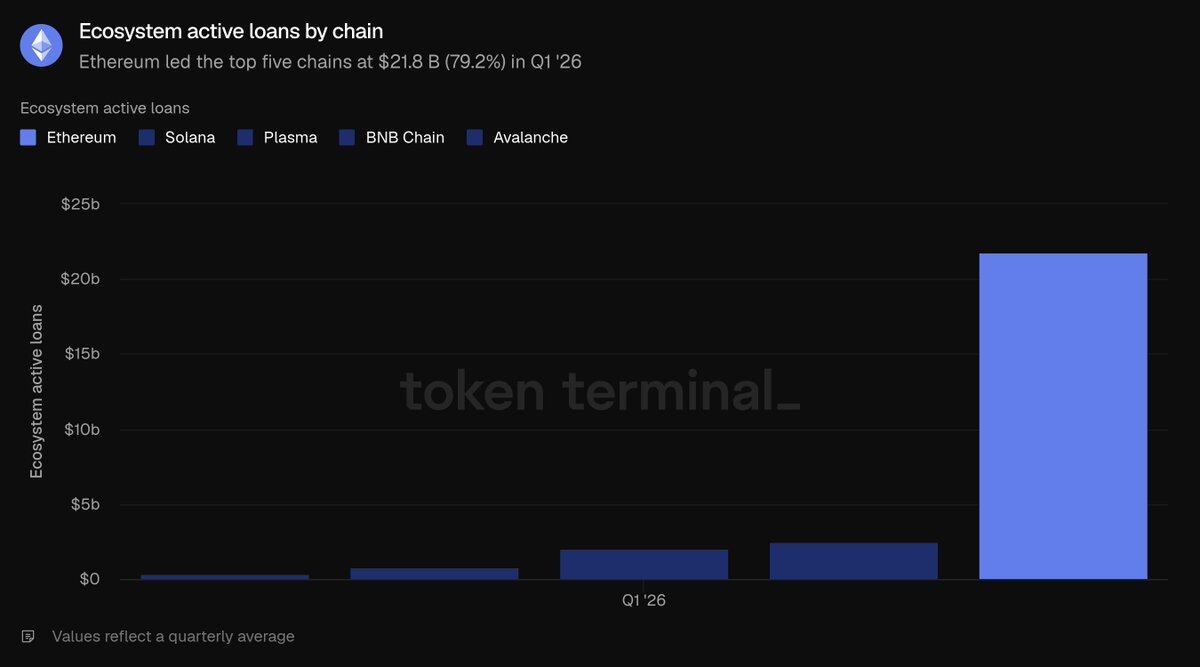
Ethereum's lending market is concentrated in a few major pools, with Aave dominating: at the end of the quarter, its active loans were approximately $13.5 billion, capturing the vast majority share of the ecosystem. It was followed by Morpho (~$1.9B), Sky's Spark (~$1B), and Maple (~$0.84B). The contraction in lending scale this quarter was primarily driven by Aave, with the decline in crypto asset prices leading to reduced lending demand and its total loan volume shrinking by about 24%. In a horizontal comparison across the top five public chains, Ethereum's $21.8 billion in active loans significantly outpaces Solana ($2.5B), Plasma ($2.1B), BNB Chain ($0.7608B), and Avalanche ($0.3924B), commanding 79.2% of the total loans across these five chains. This track has the highest percentage share for Ethereum among all sectors covered.
Decentralized exchange (DEX) trading volume refers to the total value of transactions executed on on-chain spot exchanges. Traders pay fees when trading, making volume highly correlated with platform revenue. This data aggregates DEX trading across the entire Ethereum ecosystem. Total ecosystem trading volume in Q1 was $134.5 billion, down 24% QoQ and 31.2% YoY. The decline in trading volume was steeper than the contraction in TVL, confirming a significant reduction in market risk appetite during this quarter's asset downturn.
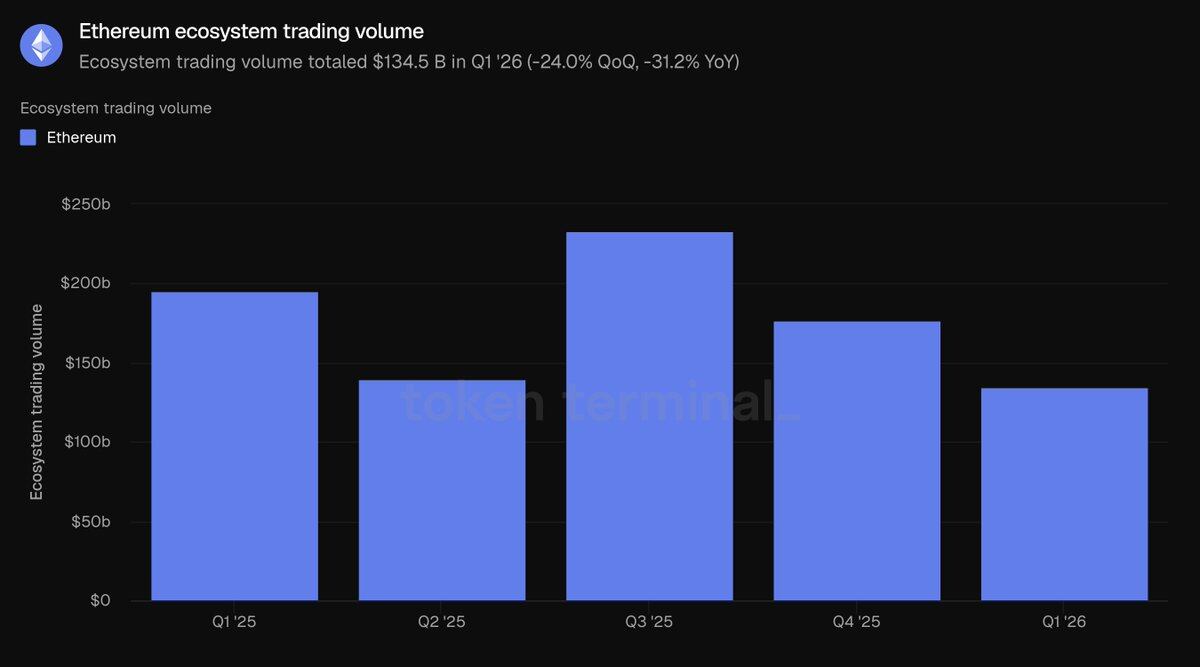
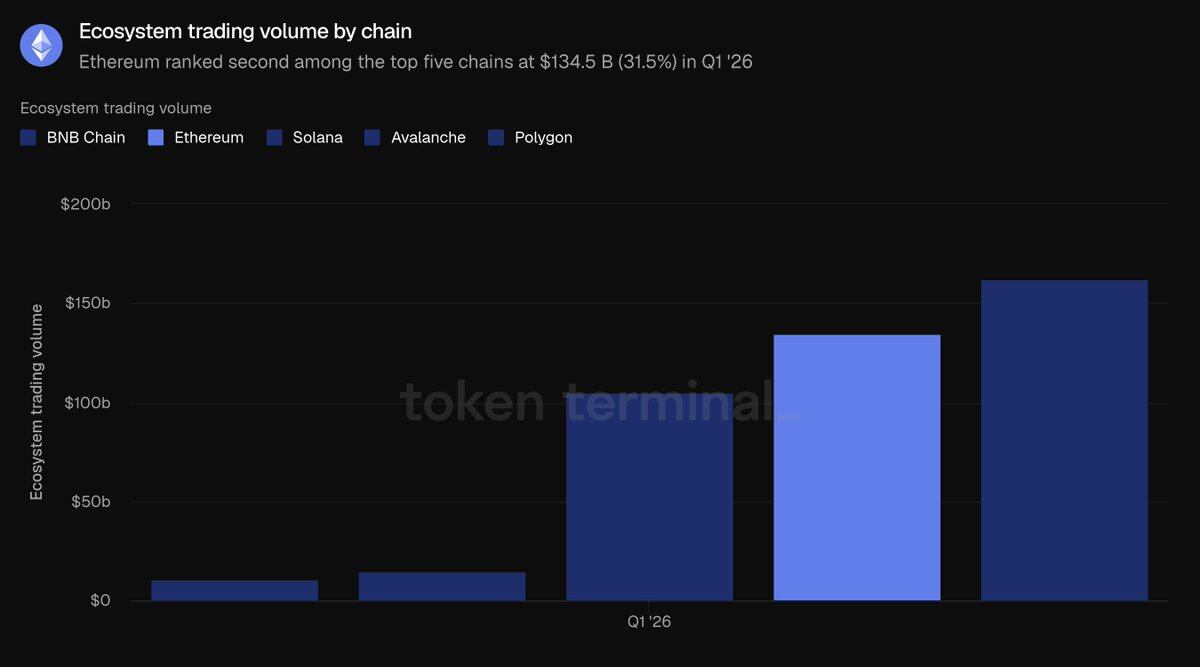
Ethereum DEX trading flow is highly concentrated on top platforms: Uniswap's Q1 trading volume was approximately $85.5 billion, accounting for two-thirds of the ecosystem total. It was followed by Curve (~$22.1B) and CoW Swap (~$12.4B). Trading volume is the only metric where Ethereum did not rank first among the top five public chains. BNB Chain's total volume of $162.5 billion surpassed Ethereum's $134.5 billion, with Solana close behind ($104.9 billion). Avalanche ($14.5 billion) and Polygon ($10.7 billion) ranked lower. Ethereum's trading volume accounted for 31.5% of the total across the five chains, second to BNB Chain's 38%.
Ecosystem fees refer to all costs incurred by users when using various applications, including borrower interest and trader transaction fees. This intuitively reflects the economic value created by the ecosystem. The statistic aggregates fees across all Ethereum applications. In Q1, total ecosystem fees amounted to $2 billion, a decrease of 16.9% QoQ and 7.8% YoY, correlating with the decline in trading and lending activity.
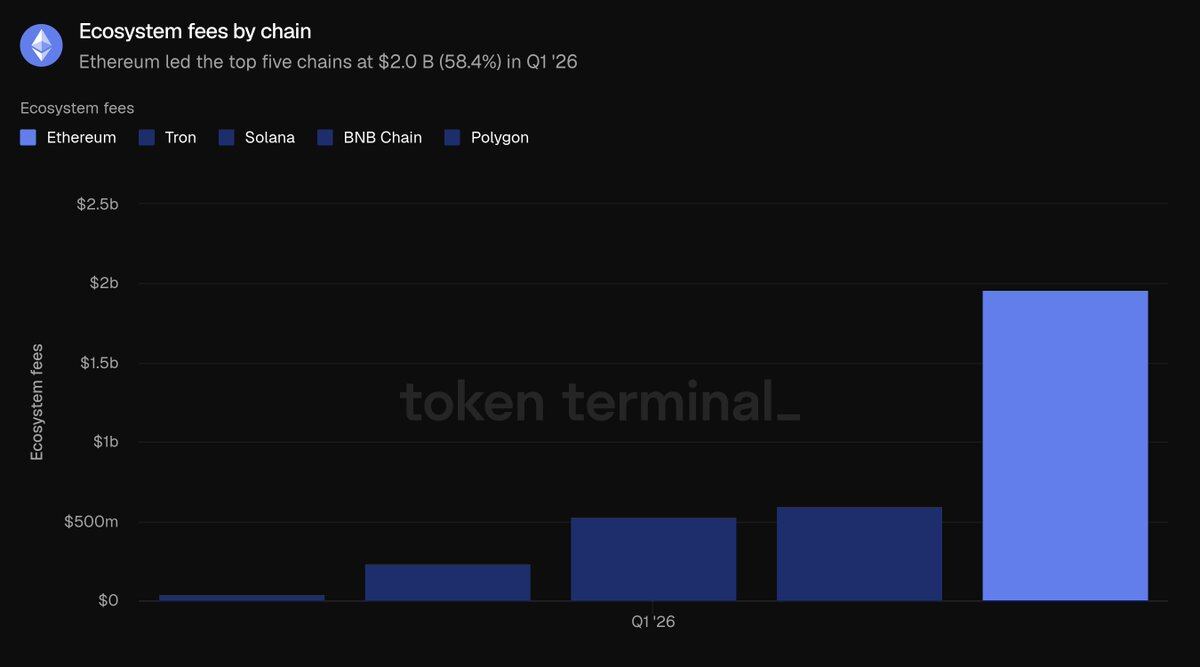
Ethereum's $2 billion in ecosystem fees far surpasses Tron ($599.3 million), Solana ($532.5 million), BNB Chain ($231.9 million), and Polygon ($38.8 million), accounting for 58.4% of the total fees across the top five public chains. Even with the QoQ decline this quarter, Ethereum remains the largest source of application fees in the industry. Considering all metrics in this section: Ethereum leads the industry comprehensively in terms of locked capital, lending scale, and ecosystem fees, only lagging behind BNB Chain in DEX trading volume.
Tokenized Assets Sector
Total Market Cap of Circulating Assets refers to the total value of on-chain tokenized assets, calculated as circulating supply multiplied by the closing price of the day. Stablecoins use total circulating issuance, tokenized funds use on-chain assets under management (AUM), and tokenized stocks use the total value of shares issued on-chain. This section only covers assets issued on Ethereum.
In Q1, the average total market cap of Ethereum tokenized assets was $203.4 billion, remaining essentially flat QoQ (down only 0.7%), but up a significant 42.9% YoY. Stablecoins accounted for 87.9% of the total, with the remaining share distributed among tokenized funds, commodities, and stocks.
Stablecoins
In Q1, the average scale of Ethereum stablecoins was $178.9 billion, down slightly by 2.3% QoQ but up 37.6% YoY. This was the only tokenized sub-sector with a QoQ contraction. The market is dominated by two issuers: at the end of the quarter, Tether's USDT ($94.1 billion) and Circle's USDC ($54.5 billion) together accounted for the vast majority of Ethereum's stablecoin market cap. Other top products include Sky's USDS ($12.4 billion), Ethena's USDe ($5.9 billion), and PayPal's PYUSD ($2.9 billion). New compliant stablecoins like Ripple's RLUSD ($1.1 billion) have also been launched. In a horizontal comparison across the top five public chains, Ethereum's $178.9 billion stablecoin scale leads Tron ($84.5 billion), Solana ($14.5 billion), Arbitrum One ($6.8 billion), and Base ($4.7 billion), accounting for 61.8% of the total stablecoins across these five chains.
Tokenized Funds
In Q1, the average scale of Ethereum tokenized funds was $19.4 billion, up 4.9% QoQ and an explosive 73.1% YoY. This sector is divided into two main types:
Yield-bearing on-chain dollar products (largest scale): Sky's sUSDS (~$6.4 billion), Ethena's sUSDe (~$3.5 billion).
Traditional finance compliant funds (the core narrative vehicle for institutions): BlackRock's BUIDL (issued via Securitize, ~$1 billion), WisdomTree Government Money Market Fund (~$815 million), Superstate's USTB (~$620 million), followed by Ondo's OUSG (~$320 million). Comparing across the top five public chains, Ethereum's $19.4 billion in tokenized funds significantly leads ZKsync Era ($2.5 billion), BNB Chain ($2.3 billion), Solana ($1.3 billion), and Stellar ($1.1 billion), accounting for 73% of the total. This is the tokenized asset sector where Ethereum has its second strongest advantage.
Tokenized Commodities
In Q1, the average scale of Ethereum tokenized commodities was $4.7 billion, up 60% QoQ and a staggering 325.9% YoY, making it the fastest-growing tokenized category. This sector is almost entirely composed of on-chain gold: Tether Gold (XAUT, ~$2.6 billion) and Paxos Gold (PAXG, ~$2.4 billion) together account for the entire sector's share. In a horizontal comparison across five relevant public chains, Ethereum's $4.7 billion scale far exceeds Ripple ($736.6 million), Arbitrum One ($95.9 million), BNB Chain ($38.4 million), and Solana ($29.8 million), accounting for 84% of the total. This is the sub-sector where Ethereum has its strongest dominance.
Tokenized Stocks
Tokenized stocks are the smallest sub-category. In Q1, Ethereum's average scale was $365.1 million, a 16.5% increase QoQ, with the scale in the same period last year being nearly zero. This sector is almost exclusively dominated by Ondo Finance, which has issued tokenized versions of the S&P 500, Nasdaq 100 broad-based indices, and dozens of individual stocks, constituting the vast majority of Ethereum's tokenized stock market cap. In a horizontal comparison across the top five public chains, Ethereum's $365.1 million slightly leads Solana ($249 million), BNB Chain ($150.5 million), Arbitrum One ($29 million), and Stellar ($4.2 million), but only accounts for 45.8% of the total tokenized stocks across the five chains. This is the only tokenized asset sector where Ethereum does not hold an absolute majority share.
Summary of the tokenized assets sector: Stablecoin holdings declined slightly in Q1, but Ethereum's monopolistic position in the tokenized fund and commodity sectors continued to solidify.
On-Chain Usage Activity
Monthly Active Users (MAU) is defined as the number of unique addresses generating revenue-generating on-chain transactions per month. This metric only tracks addresses interacting with the Ethereum Layer 1 mainnet. The average MAU in Q1 was 13.2 million, a significant increase of 53.5% QoQ and 85.9% YoY, reaching an all-time high. This ends the period of slow growth seen over several previous quarters, with user growth rates accelerating substantially.
Total transaction count refers to the number of transactions written to and confirmed on the blockchain, reflecting the intensity of user on-chain interaction. Transactions Per Second (TPS) is the average confirmation rate over the period, measuring the network's real-time carrying capacity. Both metrics only cover the Ethereum Layer 1 mainnet. In Q1, Layer 1 processed a total of 200.


