Why Is the Crypto Market Seeing Another $2.08 Billion Liquidation Cascade? An Analysis of Bitcoin and Ethereum's Next Moves


Overview
The consecutive slump in the cryptocurrency market in early November 2026 was a deleveraging process jointly triggered by a reversal in macro interest rate expectations, risk spillover from tech stocks, and net outflows from U.S. spot ETFs: over the five days from November 5 to November 9, the derivatives market experienced two waves of forced liquidations totaling $2.08 billion, pushing Bitcoin (BTC) to flash-crash from $75,690 to a new low of $73,477 since August within 15 minutes on the night of November 8 (trading at $74,133.11 as of 18:31 Singapore time on November 9), and causing Ethereum (ETH) to plunge more than 5% in a single day, breaking below the key support of $2,157 to $2,104.42. The core dividing line determining the subsequent direction of the two coins is that Bitcoin has now fallen below the short-term holders' on-chain realized price ($75,820) and the average cost basis of the world's largest corporate treasury holdings ($75,451). Bulls must reclaim the $75,450 to $75,820 cost band on the daily chart to remove the risk of a decline toward $70,000, while Ethereum needs to hold the $2,000 psychological threshold and reclaim $2,242 to have any hope of reversing its weakness against Bitcoin.
Key Takeaways
This crypto market correction is not an isolated bearish event for a single coin, but a chain reaction after signals of tighter macro liquidity overlapped with institutional fund redemptions. As of November 9, 2026, the total global cryptocurrency market capitalization has fallen from $2.62 trillion in early November to about $2.52 trillion, and the Crypto Fear and Greed Index has dropped to the fear zone of 28 to 29. Breaking down the decline trajectory reveals three core drivers: First, U.S. nonfarm payrolls surged by 165,000 in October (far exceeding market expectations of 65,000), reinforcing hawkish expectations that the Federal Reserve will keep rates high or even discuss rate hikes at its December meeting; second, U.S. spot Bitcoin ETFs saw net outflows of $1.3 billion in the first five trading days of November (including a single-day outflow of $430.2 million on November 5), officially turning the cumulative net inflow for the full year of 2026 from positive to negative (year-to-date net outflow of $416 million to $502 million), while spot Ethereum ETF holders face suppression around an average cost line of about $3,200; third, on the night of Sunday, November 8, the Nvidia executive investigation controversy and news of stalled U.S.-Iran negotiations hit the thin weekend order book, triggering a single round of over $1 billion in cascading long liquidations, with Ethereum's single-coin liquidation amount reaching as high as $448 million, exceeding Bitcoin's $272 million. In the current high-volatility environment, traders can track real-time Bitcoin prices and spot Ethereum quotes to observe the turnover intensity in key cost zones.
Recap of Two Waves of Crypto Market Selling in Early November: From the 165,000 Nonfarm Payroll Shock to the 15-Minute Flash Crash on Sunday Night
Looking back at the full market evolution from November 3 to November 9, 2026, the crypto market did not decline at a steady pace, but experienced two pulse-like deleveraging episodes directly ignited by external macro and cross-market events.
The first wave of selling occurred from November 5 (Thursday) to November 6 (Friday). On November 5, affected by pledges from newly elected governors in four states including Texas after the U.S. midterm elections to suspend approvals for new AI data center construction, the Nasdaq Composite plunged 5.52% in a single day, the largest one-day drop since April 2025, and risk aversion toward tech stocks quickly spread to crypto assets. Then on November 6, the October nonfarm payrolls report released by the U.S. Bureau of Labor Statistics showed that U.S. nonfarm payrolls increased substantially by 165,000 in October, not only more than 2.5 times the market consensus of 65,000 but also far above the average monthly increase of 48,000 over the previous 12 months, while the unemployment rate edged down to 4.1%. Since the Federal Reserve kept rates unchanged at 3.75% to 4.00% by a 10-2 vote at the October 28 Federal Open Market Committee (FOMC) meeting, with two members already voting for a 25 basis point rate hike, this strong jobs report directly crushed market fantasies of near-term rate cuts. According to market liquidation statistics on November 6, the total cryptocurrency market capitalization fell 7.32% in a single day to $2.58 trillion that day, with 78 of the top 100 tokens declining, triggering $1.08 billion in forced derivatives liquidations within 24 hours, of which long liquidations reached as high as $954.38 million (88.2%), while short liquidations were only $127.30 million.
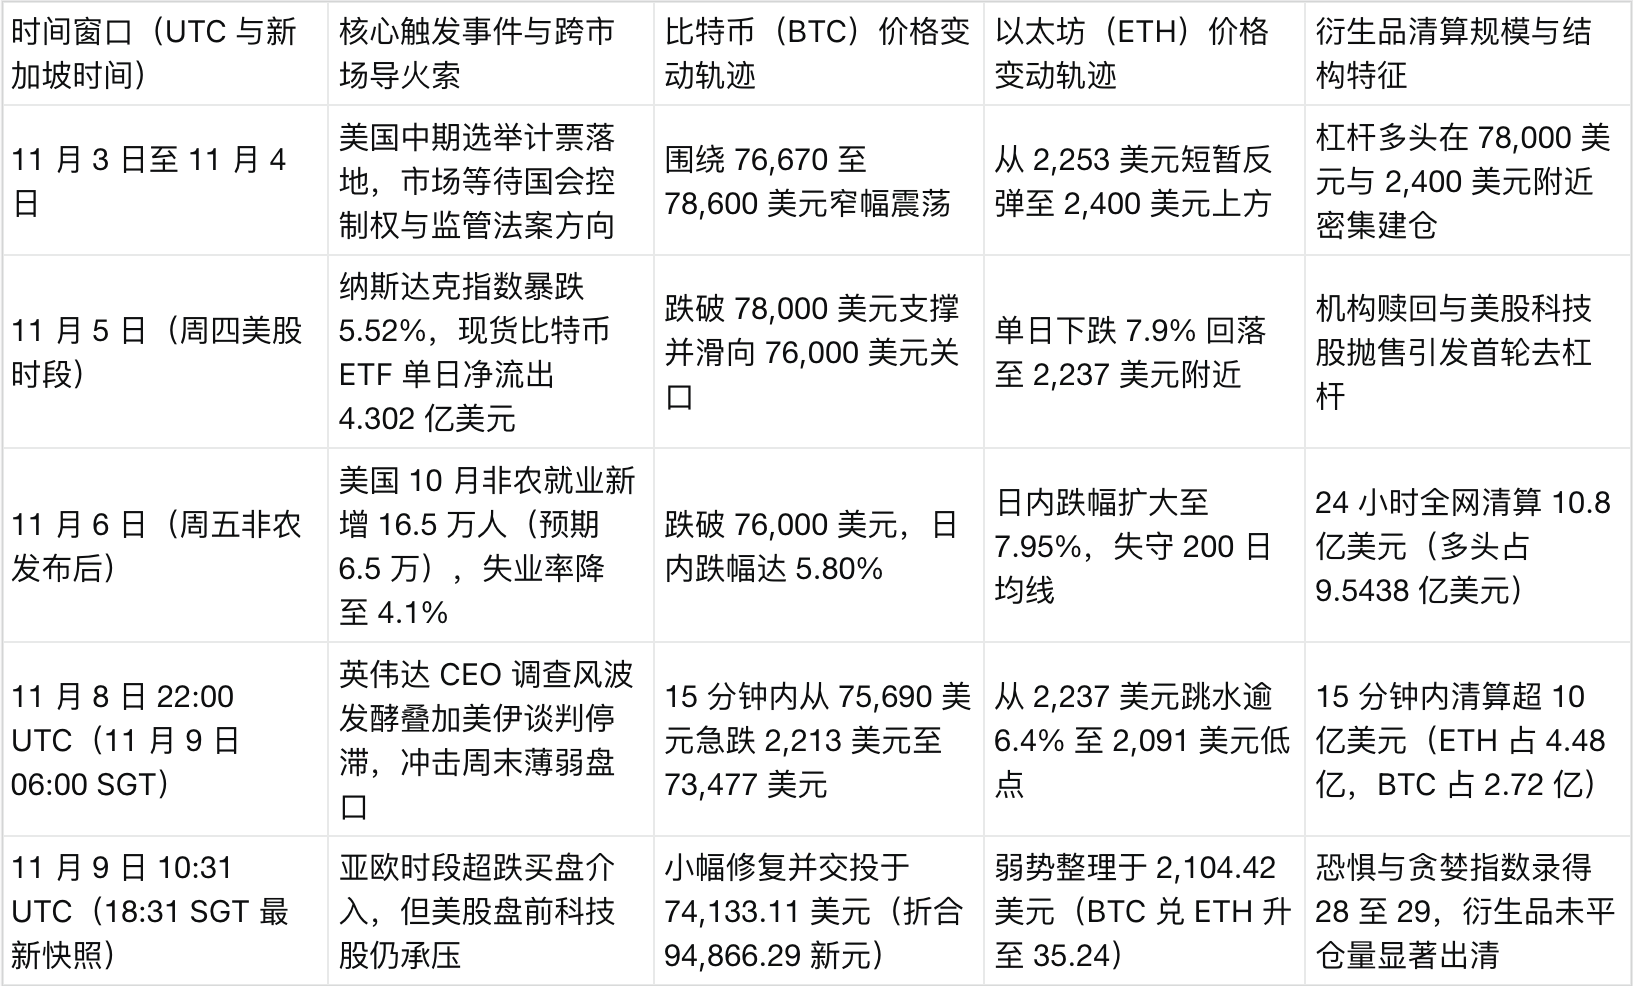
The second and more destructive wave of selling occurred at 22:00 UTC on the night of November 8 (Sunday) (corresponding to 06:00 Singapore time on November 9). During a period when traditional financial markets had not yet opened and market makers' weekend order book depth was at its thinnest, Nvidia's board announced an independent investigation into CEO Jensen Huang involving a $4.8 billion Southeast Asian chip procurement case, which, combined with geopolitical news of stalled Middle East U.S.-Iran negotiations, prompted cross-asset quantitative funds to sell first in the crypto market to cash out. According to the Sunday night flash crash and liquidation report, Bitcoin plummeted vertically from $75,690 to $73,477 in just 15 minutes (the lowest price since August 2026), while Ethereum smashed through both the $2,200 and $2,157 defense lines from above $2,237, hitting a low of $2,091. This 15-minute liquidity vacuum once again triggered more than $1 billion in contract liquidations, with an extremely rare inverted structure: Ethereum's single-coin liquidation amount reached as high as $448 million, 64.7% higher than Bitcoin's $272 million, reflecting a concentrated stampede among leveraged longs that had bought the dip in Ethereum before the weekend. As Morningstar Dow Jones market news noted on November 9, although Bitcoin rebounded to around $74,133 after the flash crash, market confidence in active buying remains fragile.
Institutional Fund Drain: Why Did Cumulative Net Inflows into Bitcoin ETFs Officially Turn Negative in November?
If contract liquidations explain the speed of the short-term decline, then the continued net redemptions from U.S. spot ETFs explain why every rebound lacked sustained buying support.
According to the daily ledger verified as of November 7 from the Farside spot ETF flow table and TFTC November ETF statistics, the 12 U.S. spot Bitcoin ETFs recorded a combined monthly net outflow of $1.3 billion in the first five trading days of November 2026 (4 of the 5 trading days saw net outflows, with only November 4 recording a net inflow of $74.6 million). Among them, single-day net outflows on November 5 (Thursday) reached as high as $430.2 million, and none of the 12 funds recorded net inflows that day; BlackRock's iShares Bitcoin Trust (IBIT) saw cumulative net outflows of $1.2 billion in early November (including $95 million on November 3, $201.2 million on November 4, and $105.0 million on November 5), while Fidelity's FBTC, although bucking the trend with $93.1 million in net inflows during the month, was far from enough to offset IBIT's redemption volume.
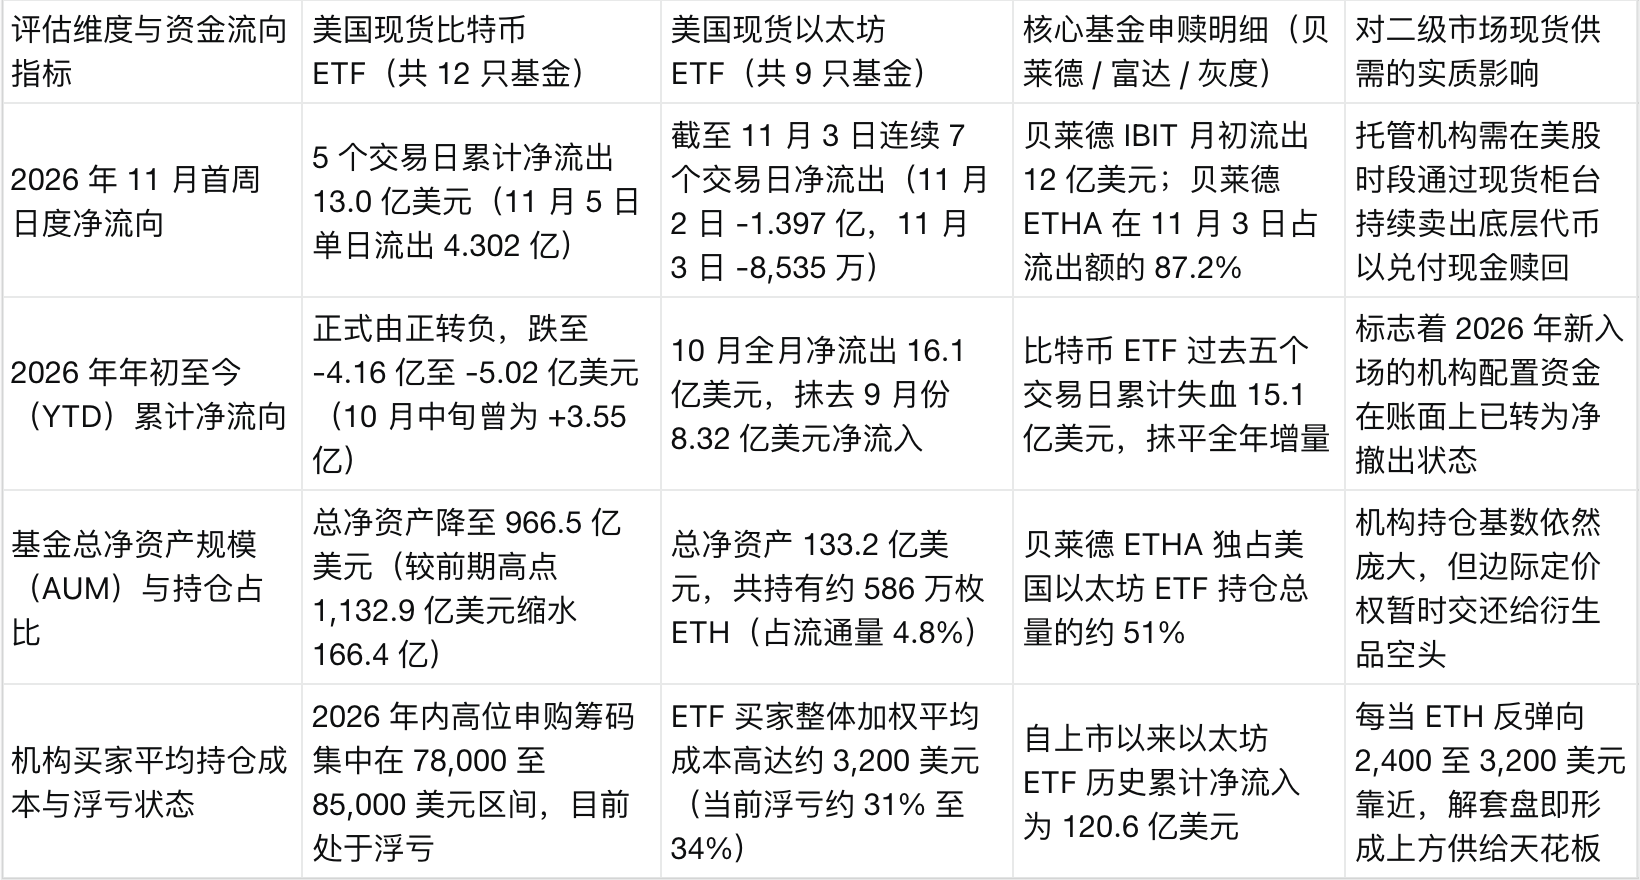
A more alarming milestone signal comes from the cross-month summary of SoSoValue crypto ETF tracking: following a single-day outflow of $643.3 million on October 30, $398.62 million on November 2, $115.56 million on November 3, and $430.2 million on November 5, the cumulative net inflow of U.S. spot Bitcoin ETFs for the full year of 2026 has officially fallen below the zero line, dropping to negative $416 million to negative $502 million (total assets under management shrank from $113.29 billion to $96.65 billion). Investors can see, in conjunction with the creation and redemption transmission mechanism of spot ETF fund flows, that when ETFs continuously experience net redemptions of hundreds of millions of dollars, authorized participants (APs) must sell an equivalent amount of spot Bitcoin in the secondary market to redeem U.S. dollar cash, which directly constitutes continuous spot selling pressure during U.S. stock trading hours.
On the Ethereum side, the cost inversion facing the institutional holding structure is even more severe. According to calculations in the Ethereum ETF cost basis and staking report, the 9 U.S. spot Ethereum ETFs currently hold a total of about 5.86 million ETH (4.8% of the circulating supply, with total net assets of $13.32 billion, of which BlackRock's ETHA accounts for about 51%), but the average entry cost basis for these ETF buyers is perched at about $3,200. Based on the current price of $2,104.42 on November 9, U.S. Ethereum ETF holders as a whole are sitting on paper losses of about 34%. However, in sharp contrast to the withdrawal of funds through ETF channels, native on-chain staking demand for Ethereum has actually heated up against the trend during the crash: as of early November, the Ethereum validator activation queue had accumulated as many as 986,847 ETH waiting to enter staking, while the validator exit queue had only 4,320 ETH, showing that long-term on-chain whales did not follow Wall Street ETF managers in panic selling, but instead used low coin prices to lock their holdings into staking contracts.
Where Does Bitcoin (BTC) Go From Here? Repair Conditions After the $75,451 Cost Floor Break and the $70,000 Test
After the decline from November 8 to 9, Bitcoin faces its most severe support test of the second half of 2026 on both technical and on-chain valuation fronts: the current price of $74,133.11 has already broken below the two core cost defense lines that had underpinned the market for weeks.
According to the on-chain cost accounting framework of MVRV and realized price, the short-term holder realized price (STH Realized Price) for holders of fewer than 155 days stands at $75,820; meanwhile, Strategy, the publicly listed company holding the most Bitcoin in the world, had an overall average purchase price of exactly $75,451 after increasing its holdings to 849,327 BTC as of November 1. Before Bitcoin plunged from $75,690 to $73,477 on the night of November 8, $75,451 to $75,820 had been the cost floor that bulls defended to the death; now with the price trading at $74,133, it means that both the on-chain active buyers who entered over the past five months of this cycle and Strategy, which holds more than $64 billion in Bitcoin, have seen their overall positions slip into slight paper losses.
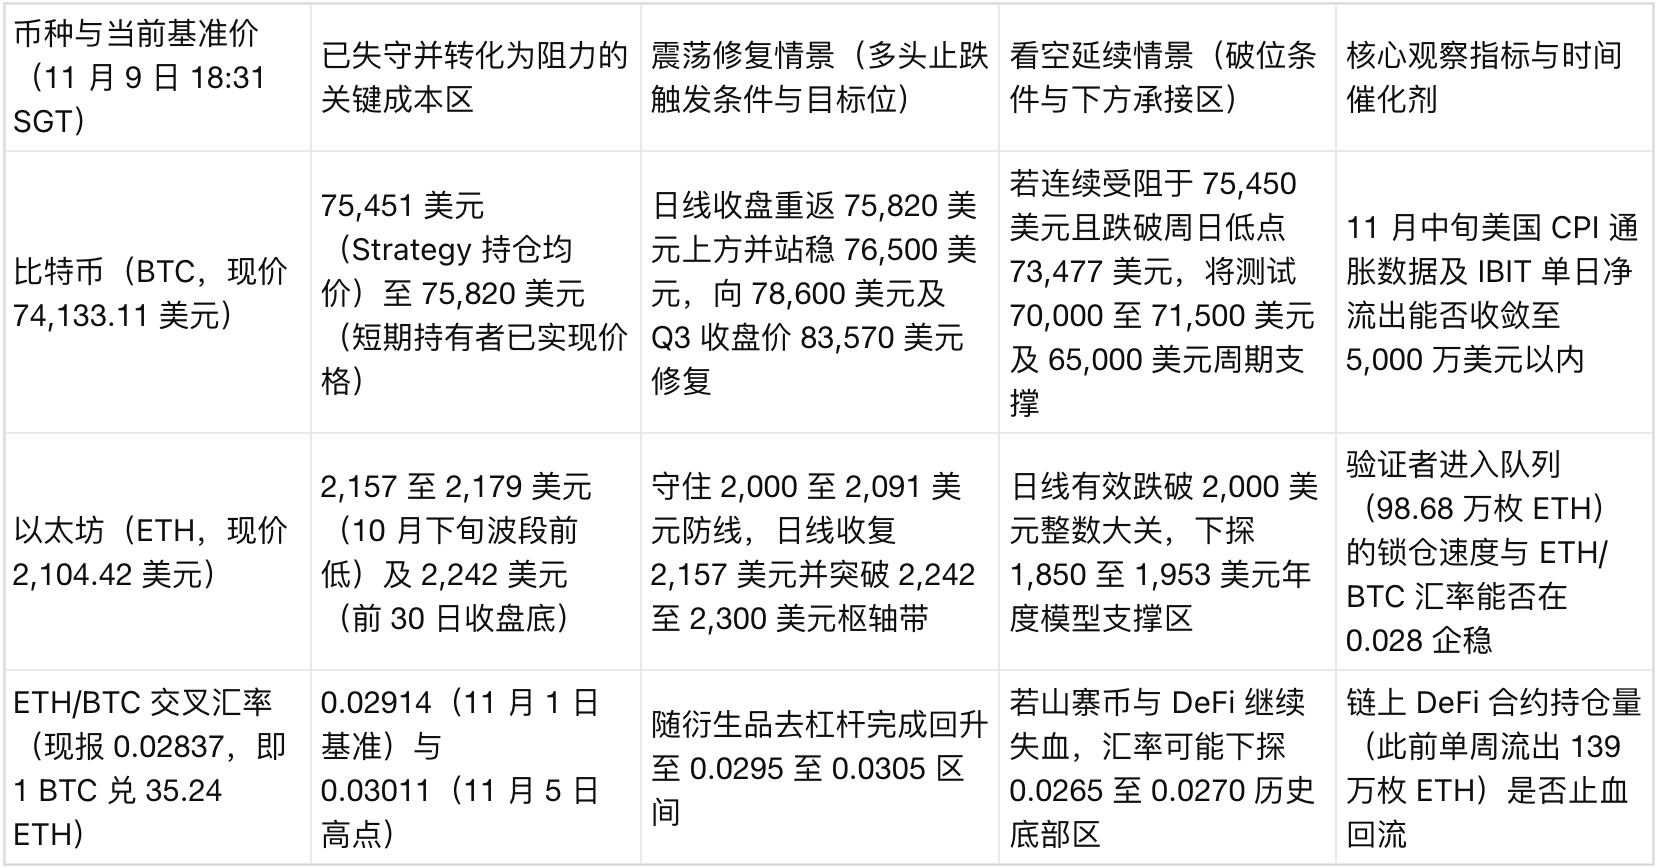
Looking ahead to the next two weeks through the end of November, Bitcoin's price path will evolve around the $75,451 to $75,820 line of得失 in three scenarios:
The first is a false breakdown (bear trap) scenario of rapid recovery. In the mid-cycle shakeouts of historical bull markets, Bitcoin has repeatedly briefly spiked below the short-term holder realized price to flush out high-leverage longs (just as November 6 and November 8 combined flushed out more than $2.08 billion in leveraged positions). If Bitcoin can quickly attract off-exchange dollar-cost-averaging buying after U.S. stocks open this week, pushing the daily close back above $75,820 and breaking through $76,500, then the Sunday night dip to $73,477 will be confirmed as a liquidity-clearing bottom, and the price is expected to return to the $78,600 to $83,570 range in the second half of November.
The second is a deep bottom-seeking scenario testing the $70,000 round-number threshold. According to real-time contract pricing on the decentralized prediction market Polymarket as of November 9, market traders currently assign an implied probability of 46.5% that Bitcoin will touch $70,000 before the end of November. If U.S. spot Bitcoin ETFs continue to see net outflows of $200 million to $400 million per day this week, causing BTC's rebound to be capped in the $75,451 to $75,820 range and to break below Sunday's low of $73,477 again, the first downside receiving zone will move down to $70,000 to $71,500; and the deeper macro safety cushion lies at the $65,000 cycle support band identified by Fidelity's macro model, as well as the $53,136 to $58,544 hard floor represented by the average on-chain production cost of miners across the network.
Where Does Ethereum (ETH) Go From Here? The $2,000 Defense Battle After Losing $2,157 and Trading Strategies
Compared with Bitcoin's roughly 4.4% pullback from early November, Ethereum has borne greater structural pressure in this decline. With the break below the late-October prior low support of $2,157 to $2,179 on the night of November 8 (as well as the $2,242 daily closing floor that had been defended for days), ETH traded at $2,104.42 on November 9, causing the number of Ethereum exchangeable for 1 Bitcoin to surge from 33.21 on November 5 to 35.24 (the ETH/BTC exchange rate fell to 0.02837).
There are three core reasons suppressing Ethereum's relative performance: first, its high-beta tech stock characteristics made it the first to suffer when the Nasdaq plunged 5.52%; second, the diversion effect of Layer 2 compressed the mainnet's EIP-1559 burn revenue (in late October, single-day burn volume once fell to single-digit ETH, putting the mainnet in a slight net issuance state); third, the aforementioned $448 million single-day contract long liquidation and redemption pressure on ETF buyers below the $3,200 cost line.
Therefore, Ethereum's trajectory in mid-to-late November depends entirely on whether the $2,000 to $2,100 round-number demand zone can be defended:
In the bearish test scenario, since the daily chart has already closed below $2,157, $2,000 to $2,091 (Sunday night's low) constitutes the psychological defense line from which bulls cannot retreat. If ETF net outflows fail to slow after U.S. stocks open and