


AI Giants Burn Cash, Energy Giants Print Money: Super Earnings Week, Cash Incinerators vs. Cash Printers


Microsoft and Alphabet will report earnings after the market close on October 28, with Amazon following closely behind, and ExxonMobil and Chevron wrapping up the week. The focus of this earnings round is no longer just how fast AI demand can still grow, but also the cash cost required to achieve that growth.
Over the past two years, the market has been willing to pay a premium for the long-term returns of cloud computing and AI infrastructure. As capital expenditures continue to climb and free cash flow comes under pressure, investors must recalculate: whether orders can be converted into revenue in time, whether revenue can cover depreciation, and ultimately how much cash is truly left for shareholders.
This week, Microsoft, Alphabet, and Amazon need to answer the question of returns on AI investment. ExxonMobil and Chevron provide another reference point: when profits are realized as cash, and that cash can be converted into dividends, buybacks, and debt reduction, what price is the market willing to pay for such assets?
1. 160 Companies Report This Week, Market Looks to Cash Flow Statements First
This week, approximately 160 S&P 500 constituent companies will report earnings, with Microsoft, Alphabet, Amazon, ExxonMobil, and Chevron being the most closely watched group (TradingKey and company filings summary). The schedule is: Microsoft and Alphabet after the close on October 28; Amazon and Intel after the close on October 29; Eli Lilly and Caterpillar before the open on October 29; and ExxonMobil and Chevron wrapping up on October 30. Meanwhile, memory manufacturers such as Samsung Electronics, SK Hynix, and Kioxia will also deliver results. The demand and costs of AI infrastructure are becoming a common topic spanning both US and Asian tech stocks.
The market has already given signals in advance. Last week, the MAGS Magnificent Seven ETF fell nearly 7% from its year-to-date high, and Meta dropped about 18% from its high due to free cash flow turning negative (October 26 report).
This does not mean the market no longer believes in AI. More precisely, investors are beginning to ask: as AI demand grows, how much will capital expenditures, depreciation, and financing costs increase? When revenue growth is no longer sufficient to explain valuations, the cash flow statement becomes the next checkpoint for verifying investment returns.
2. AI Giants Burn Hundreds of Billions Annually—Can Cash Flow Keep Up?
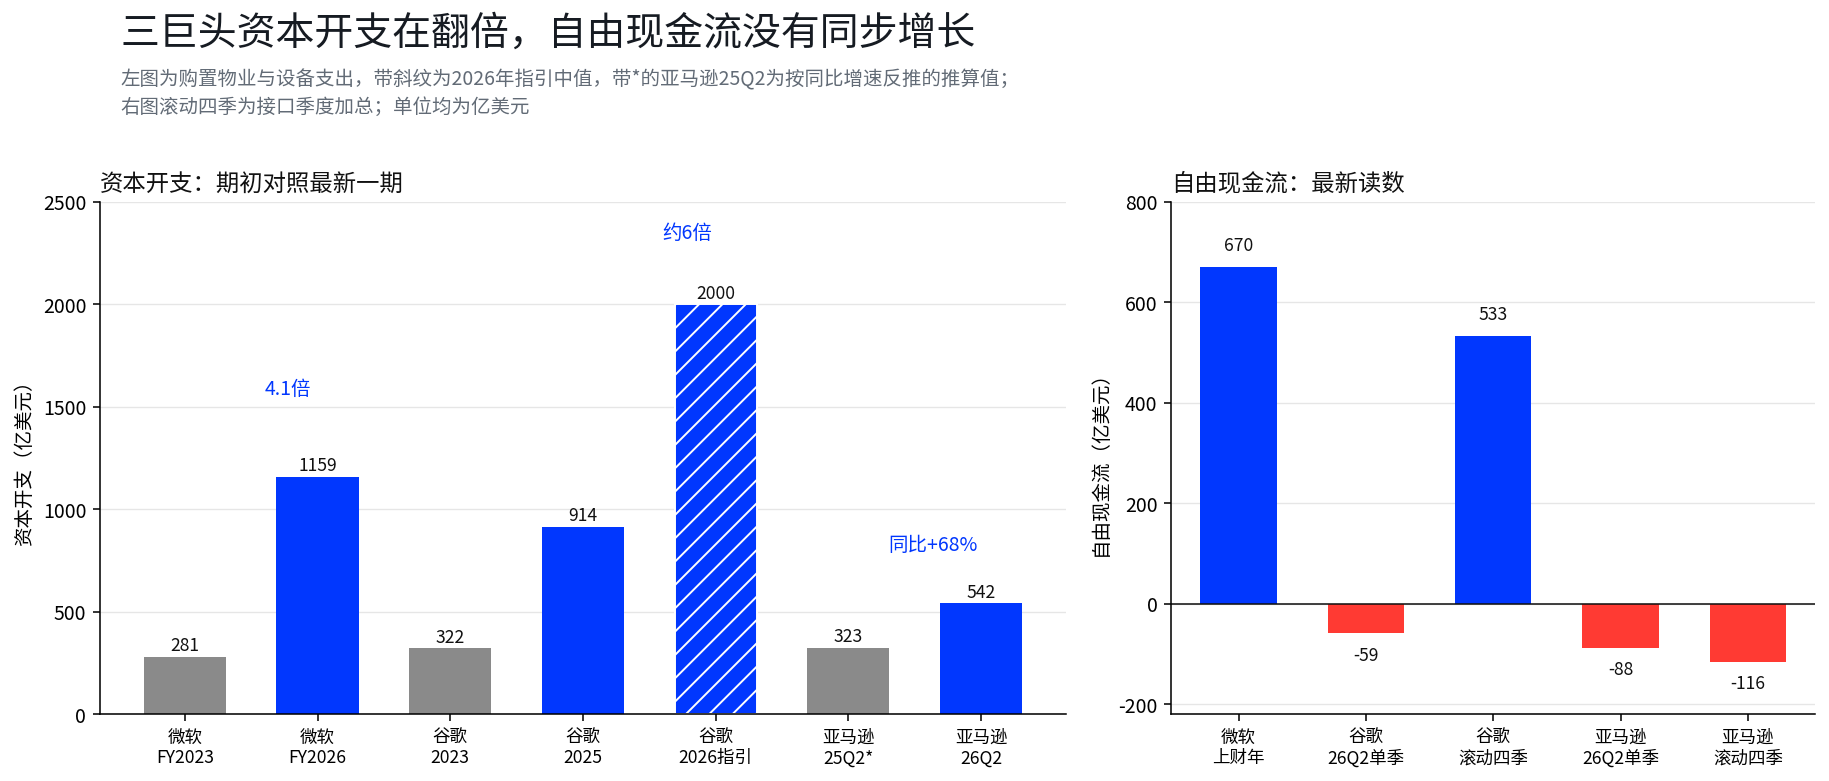
The three giants' combined spending on property and equipment in the previous quarter was approximately $134.9 billion, roughly double that of a year ago (company filings summary). AI infrastructure buildout is still accelerating, and what needs to be clearly seen is the widening gap between the pace of investment and cash returns.
Alphabet's capital expenditures rose from $32.2 billion in 2023 to $91.4 billion in 2025, with 2026 guidance at a midpoint of approximately $200 billion (API and company guidance). Based on this guidance, the average quarterly investment needed in the second half would be approximately $57.2 billion to $62.2 billion, significantly higher than Q2's $44.9 billion (this article's estimate). In other words, what the market needs to see is not just how much was spent this quarter, but whether this round of investment is still accelerating.
Amazon faces similar cash pressure. Q2 capital expenditures were $54.2 billion, up 68% year-over-year; free cash flow was approximately negative $18.2 billion in Q1 and approximately negative $8.8 billion in Q2, with net outflows for two consecutive quarters.
Microsoft's gap is even more telling. Fiscal year 2026 (July 2025 to June 2026) capital expenditures are approximately $115.9 billion, 4.1 times the $28.1 billion in fiscal year 2023, while free cash flow over the same period only rose from $59.5 billion to approximately $67 billion (API, fiscal year data). Investment scale has quadrupled, but cash returns have not grown proportionally.
Demand is not without support. Alphabet disclosed cloud backlog orders of approximately $514 billion (data cited in reports), and Amazon's compute orders extend to 2028. What really needs to be answered is how quickly these orders can be converted into revenue and profit, and how much additional capital expenditure is required to fulfill delivery.
3. Cash Flow Yield Trails US Treasuries, Tech Giants' Valuations Under Pressure Again
A single quarter turning negative may be affected by payment timing and spending schedules; trailing four-quarter totals are better suited for observing cash generation capability. Based on API data, Alphabet's trailing four-quarter free cash flow is still approximately $53.3 billion—a single quarter turning negative does not mean the past year's cash generation capability has collapsed. Amazon's trailing four-quarter figure is approximately negative $11.6 billion (reported data shows negative $7.6 billion; the difference may come from the accounting treatment of finance leases, both figures noted in the text). Microsoft's free cash flow for the last fiscal year was $66.987 billion.
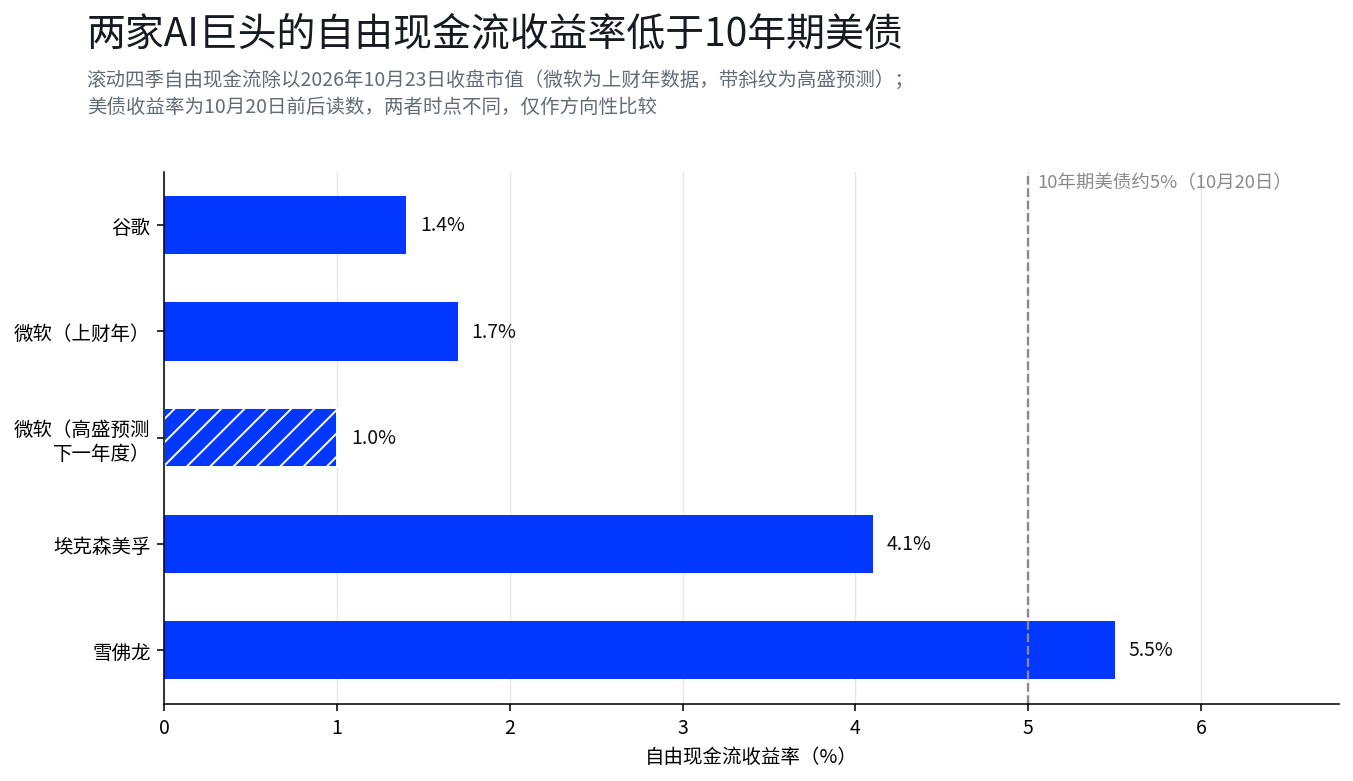
Comparing free cash flow to market capitalization makes valuation pressure more intuitive. Based on trailing four-quarter data and the October 23 closing market capitalization, Alphabet's free cash flow yield is approximately 1.4%, and Microsoft's last fiscal year was approximately 1.7%. If Goldman Sachs' forecast materializes ($67 billion dropping to $40.1 billion), next year it would fall to approximately 1.0%. Meanwhile, the 10-year US Treasury yield is around 5%.
This comparison cannot directly lead to the conclusion that Treasuries are superior to tech stocks. Stock cash flows can grow with the business, and bond yields are not equivalent to long-term total returns on stocks. What it illustrates is another reality: when the risk-free rate is at a high level, current valuations may require stronger future cash flow growth to support them.
Energy giants provide a different reference. Using the same methodology, ExxonMobil and Chevron's free cash flow yields are approximately 4.1% and 5.5% respectively, higher than or close to Treasury levels. What the market is really comparing is how much cash can be recovered from the price paid today, and how much risk future growth requires.
4. Orders Are Not the Same as Collections: When Will AI Investment Earn Back Its Cost?
The return on AI infrastructure investment depends on the speed of order fulfillment, the intensity of capital expenditures, and the depreciation pressure after new assets are put into use.
On order conversion: Alphabet's cloud backlog is approximately $514 billion. Simply annualizing Q2 cloud revenue of $24.8 billion gives approximately $99.2 billion in annual revenue (this article's estimate), a static ratio of approximately 5.2 times. This figure is not the actual payback period, nor does it mean backlog orders will be evenly recognized as revenue over five years; it is better used to illustrate the gap between order scale and current-period revenue. The earnings call needs to address delivery timelines, revenue recognition pace, and whether customer demand will change.
On investment scale: Amazon's 2026 capital expenditure plan is approximately $220 billion (reported data), already higher than AWS's combined revenue of approximately $168.8 billion over the past four quarters ($42.2 billion times four, this article's estimate). The two are not entirely comparable—capital expenditures serve multiple future years and multiple businesses, while AWS revenue is current-period revenue from a single business. This ratio still illustrates that AI infrastructure buildout requires enormous upfront investment, and short-term cash flow may come under considerable pressure.
On depreciation: the three giants' combined 2026 capital expenditures are approximately $670 billion (media summary). Using straight-line depreciation over 5 to 6 years for a static estimate, once all assets are operational, annual incremental depreciation would be approximately $110 billion to $130 billion. This is only a static scenario; it does not mean all spending will be operational in the same year or use the same depreciation period. The key is whether the gross profit from incremental cloud revenue can cover incremental depreciation, and when profit margins will be affected.
Counter-evidence should also be placed on the table. Cloud revenue has dual optionality from price increases and demand expansion; Microsoft has already told investors that free cash flow will resume growth (reports). The key variable folded into valuations is the gross margin structure of incremental revenue—the absolute amount of spending itself is secondary—and this is precisely the part most worth listening to line by line on the earnings call.
5. Energy Giants' Profits Expected to Grow Substantially
Unlike AI giants still making massive investments in future capacity, the focus for energy giants is whether profits can be converted into cash, and where that cash ultimately flows.
Based on LSEG consensus data, ExxonMobil's Q3 profit is expected at approximately $16.2 billion, up approximately 101% year-over-year, and Chevron's at approximately $9.3 billion, up approximately 158% year-over-year (Reuters citation). Based on API year-ago bases, the two would be approximately 115% and 163% respectively; the difference from LSEG data may come from adjustment items, and the text follows LSEG consensus. These forecasts await verification by official earnings reports, but they already reflect market expectations for both companies' profit growth.
Cash flow data provides another layer of support. ExxonMobil's Q2 operating cash flow was approximately $23.555 billion, and free cash flow was approximately $17.028 billion—72% of full-year 2025 in a single quarter—with quarterly capital expenditures stable at around $6.5 billion, not expanding with oil prices. Chevron's Q2 free cash flow was approximately $16.807 billion, equivalent to approximately 101% of its full-year 2025; full-year capital expenditure is trending toward the lower end of the $18 billion to $19 billion range (Goldman Sachs research citation). Chevron's Q1 free cash flow was once negative $1.5 billion; a single-quarter high cannot be directly extrapolated to the full year.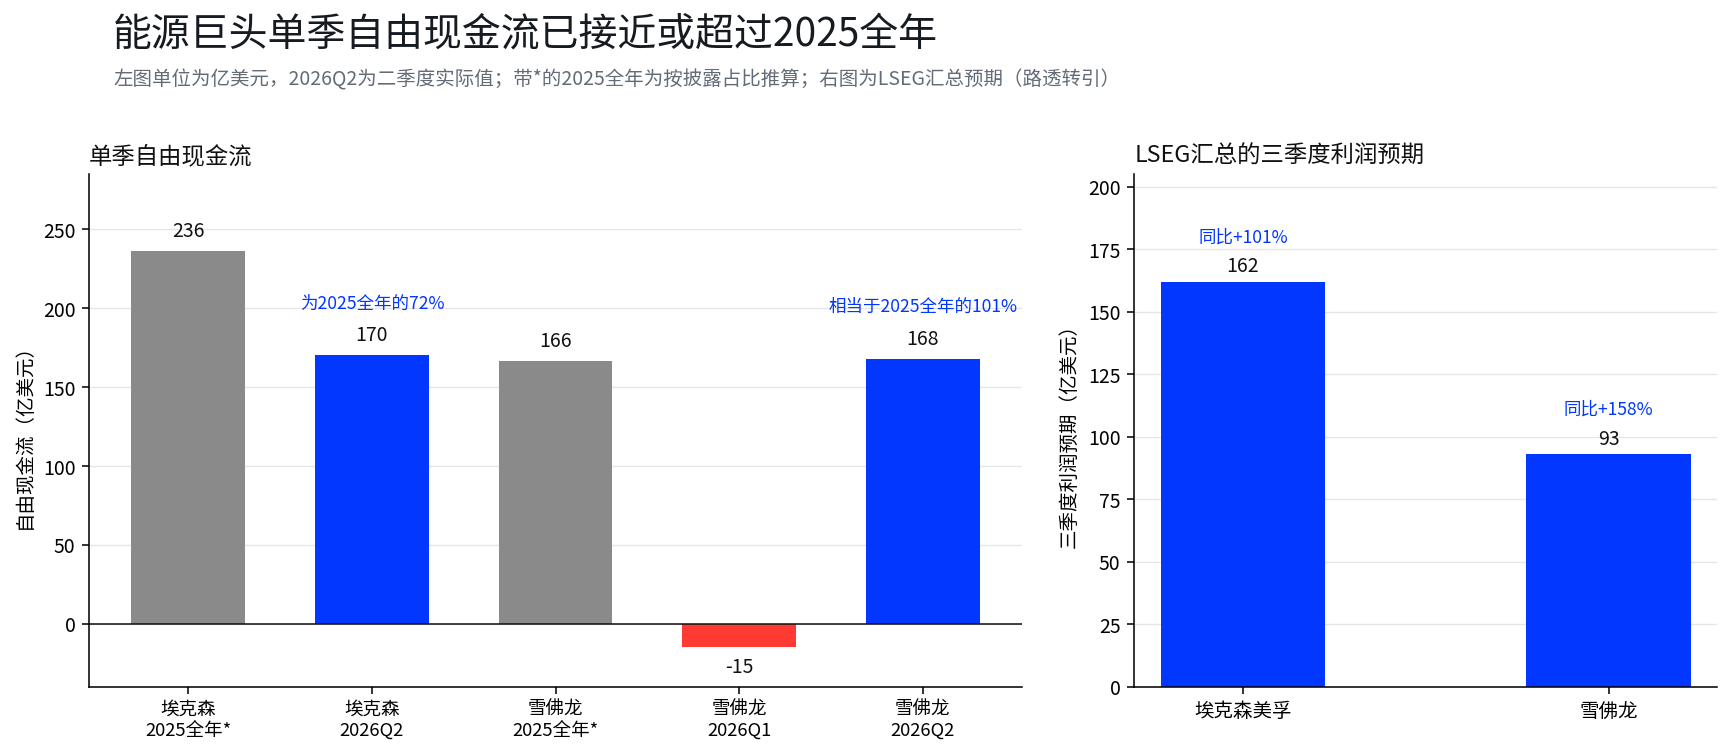
For the energy sector, the key is not just how much can be earned when oil prices rise, but also whether companies can control capital expenditures and continuously deploy cash for dividends, buybacks, and debt reduction. If Q3 earnings meet expectations, ExxonMobil's trailing P/E ratio would fall from the current approximately 23 times to approximately 18 times (based on net income totals and market capitalization), and combined with a trailing free cash flow yield of approximately 4%, its appeal does not depend entirely on oil prices rising further. This judgment still depends on oil prices, refining margins, and cash return policies; it cannot be concluded based on a single quarter's profit growth alone.
6. Caterpillar's Orders Cover Second-Half Revenue, Yet Stock Is Down 34% from June High
Caterpillar's earnings will test whether AI investment can continue to transmit to the real economy. The company reports before the open on October 29; the market expects revenue of approximately $20.7 billion, up approximately 17% year-over-year, and adjusted EPS of approximately $7 (analyst consensus). Bernstein estimates its backlog at approximately $77 billion, roughly 0.93 times annualized revenue (based on Q3 expected annualized revenue of approximately $82.8 billion), already covering 100% of expected second-half 2026 revenue versus a historical average of approximately 60% (research citation). Demand for power generation equipment, cooling systems, and heavy machinery driven by data center expansion provides direct support for orders.
Sufficient orders do not mean profits will necessarily grow in tandem. In the week before earnings, Caterpillar's stock fell approximately 33.89% from its June 30 closing high (TIKR statistics). The market is confirming whether backlog orders can be converted into shipments and revenue as planned, and whether the growth rate of power generation equipment sales can sustain Q2's 29% level. Orders reflect demand; shipments, gross margins, and cash collection determine what this demand is ultimately worth.
7. Eli Lilly Is Not Cheap, but Cash Flow Is Visible
Eli Lilly reports before the open on October 29; the market expects Q3 EPS of approximately $8.38 and revenue of approximately $22.97 billion (RBC and public reports). Based on API bases, revenue would grow approximately 31% year-over-year and EPS approximately 35% year-over-year, roughly flat quarter-over-quarter; the slope of growth momentum needs to be confirmed on the earnings call.
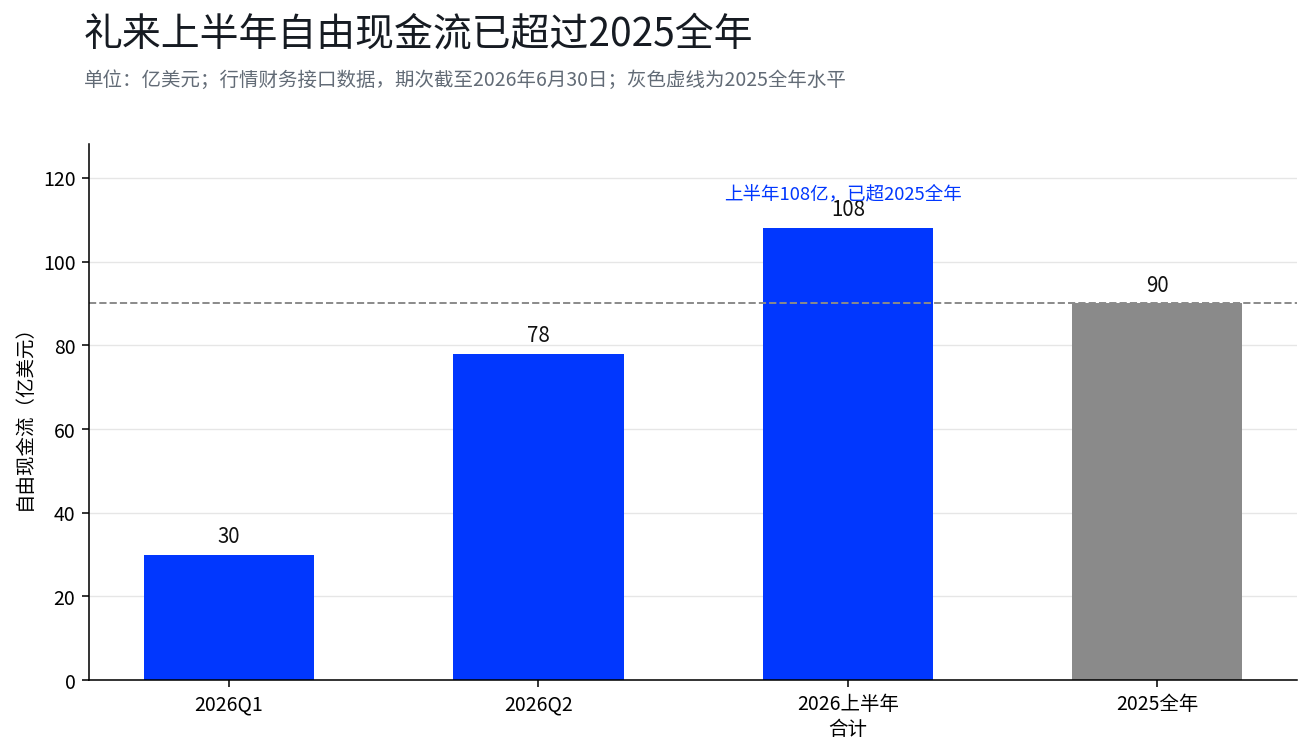
Eli Lilly's current P/E ratio of approximately 45 times (based on trailing four-quarter net income of approximately $26.7 billion and the October 23 closing market capitalization) is not low. Its appeal lies in its growth logic—prescription-driven pharmaceutical revenue and AI infrastructure investment are two different paths. The company's Q1 and Q2 free cash flows were $3 billion and $7.8 billion respectively, totaling approximately $10.8 billion in the first half, already exceeding full-year 2025's $9 billion. This type of cash flow also faces R&D, competition, and drug pricing risks, but does not need to rely on tech giants continuously expanding capital expenditures to materialize.
In this week of AI assets being repriced, Eli Lilly offers a different risk exposure. The real question is: how high a price are investors willing to pay for visible revenue growth and cash generation capability?
8. Three Things to Watch on Earnings Calls: Capex, Depreciation, and Order Fulfillment
Over the past two years, capital has paid a high premium for a decade-ahead compute position, tolerating giants borrowing to expand capacity. With the 10-year Treasury yield hovering around 5% and financing costs staying elevated, patience is being exhausted, and capital is beginning to examine tech giants' balance sheets using the standards applied to cyclical stocks. Meta already demonstrated this pricing last week: capital expenditures exceeded expectations, free cash flow turned negative, and the stock took a heavy hit.
On the earnings calls, first listen to 2027 capital expenditure guidance—whether slowing or accelerating determines how long the cash flow alarm rings. Then listen to the matching of depreciation and profit margins—whether Microsoft Azure's constant-currency growth can withstand depreciation ramp-up, and when incremental depreciation will be covered by incremental gross profit, which is the timetable for cash flow turning positive. Finally, listen to orders and collections—the revenue recognition pace of cloud backlog orders and the fulfillment progress of Amazon's compute orders extending to 2028.
In this earnings week, what the market is doing is putting the cash flow quality, realization timing, and valuation cost of different assets back on the same table for comparison. AI giants may still deliver on massive investments through cloud business growth and compute demand, provided investors see a clearer path to returns. Energy giants, on the other hand, must prove that current cash flow can sustainably convert into dividends, buybacks, and balance sheet improvement, not relying solely on short-term price conditions.
Cross-market transmission is also occurring. The rotation of capital between US certainty assets and AI high-beta assets may be affecting Hong Kong tech stocks and dividend assets; the consecutive net selling by southbound funds over the past two weeks is another reading of the same logic.
Data Notes
- Earnings calendar and company count: TradingKey weekly preview, MarketBeat, CNBC, and Eastmoney summaries, October 25-26, 2026.
- Four-statement financial data (revenue, net income, operating cash flow, capital expenditures, free cash flow): market financial API; latest period through June 30, 2026; historical periods aligned by reporting period end. Microsoft data is fiscal year (July 2025 to June 2026); trailing four quarters are API quarterly sums.
- Metric definitions and comparison limitations: Capital expenditures in the text and charts are based on each company's disclosed spending on property and equipment, excluding finance lease principal; accounting treatment of finance leases varies across companies, and relevant figures are separately noted. In free cash flow yield comparisons, market capitalization is as of the October 23, 2026 close, and the 10-year Treasury at approximately 5% is a reading from around October 20; the two time points differ, and results are for directional reference only.
- Estimation notes: Free cash flow yield (free cash flow divided by API market capitalization), Google order conversion at approximately 5.2 years, Amazon spending versus AWS revenue comparison, depreciation scale, and Eli Lilly and Exxon P/E ratios are all estimates by this article, not disclosed by companies or institutions.
- Alphabet cloud backlog of $514 billion, Amazon 2026 capital expenditures of approximately $220 billion, and TTM free cash flow reported data: cited from OANDA, Benzinga, Wallstreetcn, and other reports; original documents not individually verified.
- Microsoft free cash flow forecast ($67 billion dropping to $40.1 billion): Goldman Sachs research cited by media, October 15-16, 2026.
- Energy profit expectations: LSEG and Reuters (cited by OilPrice.com, Yahoo Finance), October 21, 2026. ExxonMobil refining profit details from company 8-K preview and BMO estimates cited.
- Caterpillar backlog and coverage ratio: Bernstein and Citi research cited by Investing.com, October 12-14, 2026. Stock price and expected revenue data from TIKR, October 23, 2026.
- Eli Lilly expectations: RBC Capital and public reports, October 2026.
- Individual stock closing prices and market capitalization: market API, October 23, 2026 close.
Disclaimer
This content is for general informational





