Bank of America's Hartnett: Six months before the peak of the "dot-com bubble" in March 2000, only tech and telecom sectors were rising—"exactly the same" as now


- Key Takeaway: BofA Chief Strategist Hartnett warns that the current market structure closely mirrors the eve of the 2000 dot-com bubble burst, characterizes AI capex as "the biggest bubble since railways," and recommends investors contrarily increase bond allocations.
- Key Points:
- 400 S&P 500 constituents have fallen below their 50-day moving average, and 300 have dropped below their 200-day moving average. Gains are highly concentrated in AI-related sectors such as the Mag7, with market breadth falling to lows last seen during the dot-com bubble era.
- Hartnett likens AI to the 19th-century railway bubble, noting that hyperscaler capex is projected to reach 3.5%-4% of GDP by 2027, but lacks the support of declining Treasury yields.
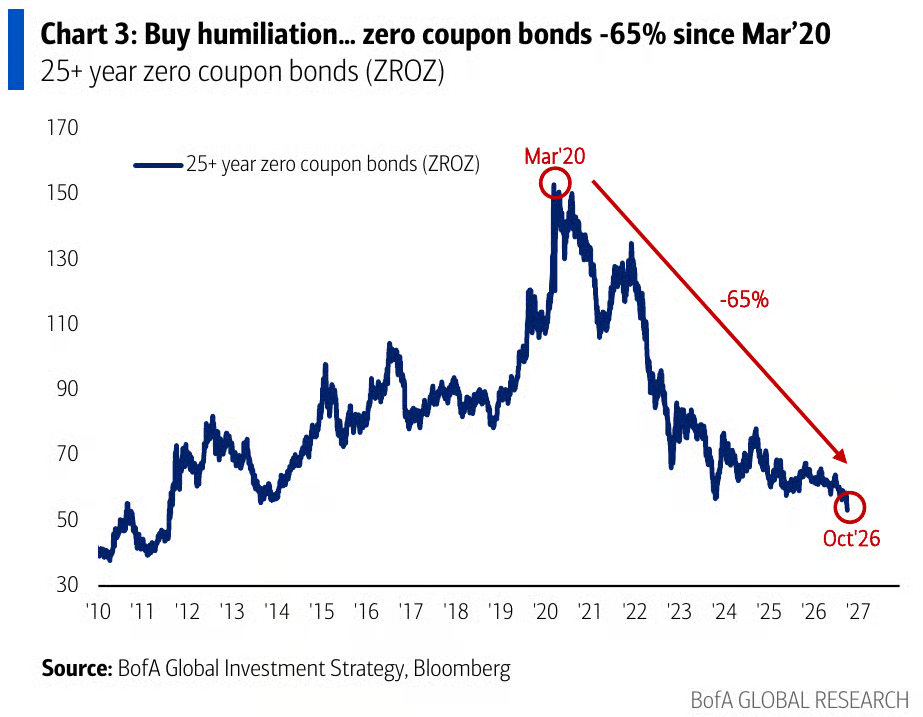
- The 10-year U.S. Treasury yield has risen to 5.33%, the highest since 2002. Long-duration zero-coupon bonds have fallen 65% from their 2020 peak. Hartnett declares a "buy the shame" call, recommending increasing bond allocations.
- BofA private clients' equity allocation has risen to a record high of 66.3%, while cash allocation has fallen to a record low of 9.4%, with institutional positioning extremely crowded.
- EPFR data shows long-term bonds saw $7.4 billion in weekly net inflows, the largest since May 2025, while municipal bonds saw $4.2 billion in net inflows, a record high, as capital begins to follow suit into bonds.
- Hartnett outlines four warning lines: IXG falling below $125, MOVE rising above 125, MDY falling below $666, and IJR falling below $135. If small-cap stocks follow bank stocks lower, it would trigger a deleveraging cascade.
Original author: Bu Shuqing
Original source: Wallstreetcn
Michael Hartnett, Chief Investment Strategist at BofA Securities, issued a warning: the current market structure closely mirrors the eve of the 2000 dot-com bubble burst, and he advised investors to start buying bonds on dips.
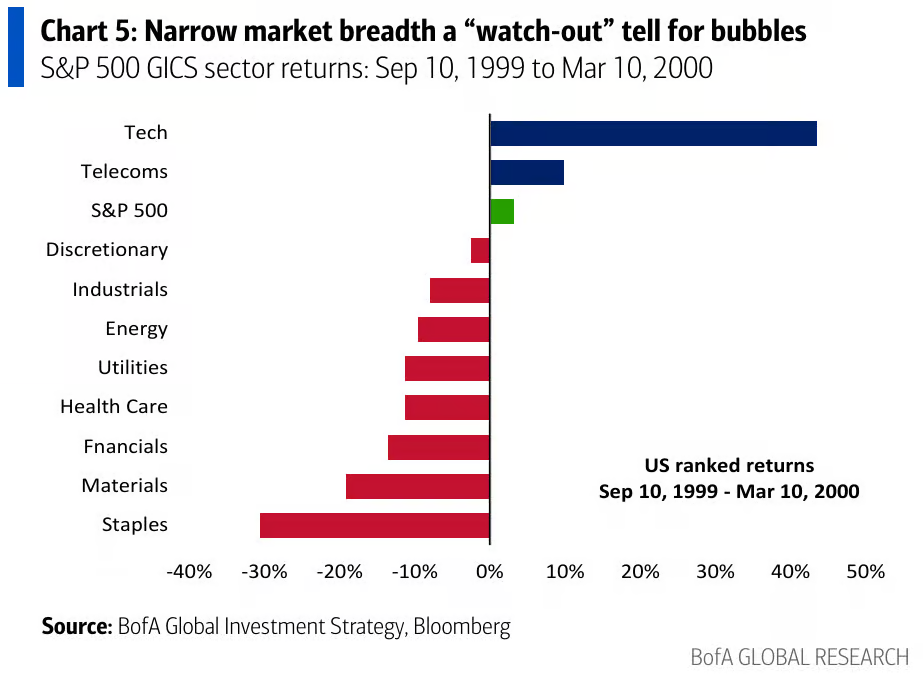
In the latest installment of the《Flow Show》report, Hartnett noted that in the six months before the March 2000 peak of the dot-com bubble, the technology sector rose more than 40%, while the consumer staples sector fell 30%, and every sector except tech and telecom declined. He stated that this pattern is "virtually identical" to current market movements. Meanwhile, 400 constituents of the S&P 500 have fallen below their 50-day moving average, and 300 have dropped below their 200-day moving average, with market gains highly concentrated in AI-related sectors represented by the "Mag7."
In the bond market, the 10-year U.S. Treasury yield has risen to 5.33%, the highest since 2002. Hartnett views this as a buying opportunity, putting forward the rallying cry of "buy humiliation" and advising clients to begin increasing bond allocations. He believes that long-term U.S. Treasury returns have fallen to a century low, and historically, such extreme low returns often marked the arrival of generational buying opportunities.
Extreme Market Divergence, the 1999 Analogy Signal Continues to Flash
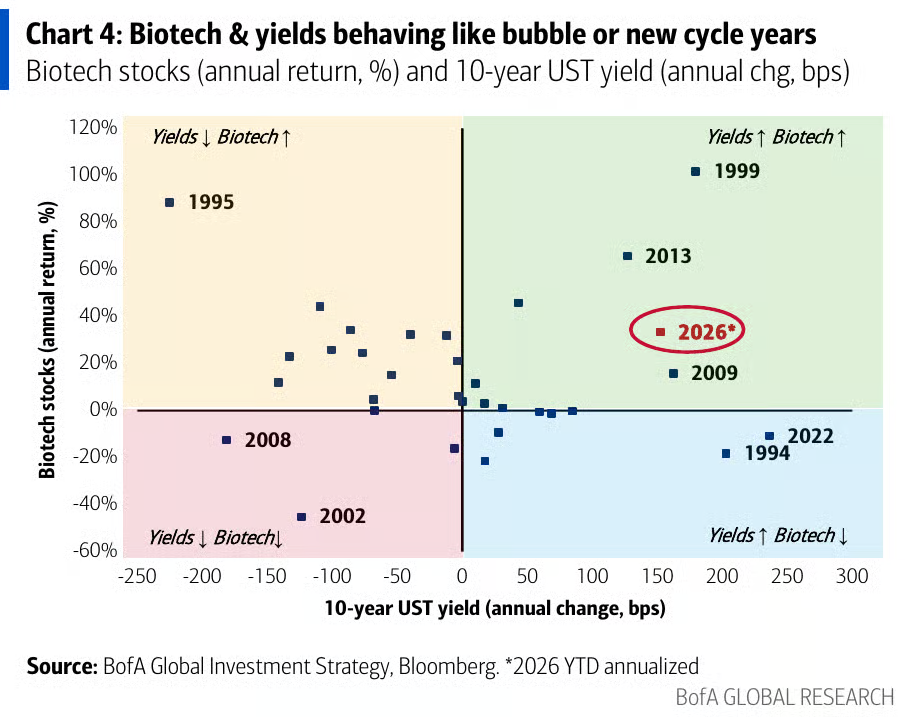
Hartnett titled his report "A Tale of Two Cities," depicting the current polarized market landscape. He wrote that the market is "long AI" (NDX) while "short AI-irrelevant assets" (the S&P 500 equal-weight index SPW), with Mag7, AI, and biotech sectors showing clear immunity to the high interest rate environment — "the 1999 analogy still holds."
On the data front, statistics from Goldman Sachs' technology trading desk show that even with the index at historic highs, the median S&P 500 constituent has fallen 16% from its peak, and market breadth has dropped to levels seen during the dot-com bubble era. A day later, the share of stocks trading above their 200-day moving average fell further below 50%.
The historical template cited by Hartnett shows that in the six months before the March 2000 peak, the technology sector alone rose over 40%, all other sectors fell across the board, and the consumer staples sector dropped as much as 30%. He believes the current degree of sector divergence in the market is almost identical to that period.
The AI Capex Bubble: Lessons from the Railway Bubble
Hartnett characterizes artificial intelligence as "the biggest bubble since railways," and in this week's report provides a detailed review of the bursting of two 19th-century railway bubbles.
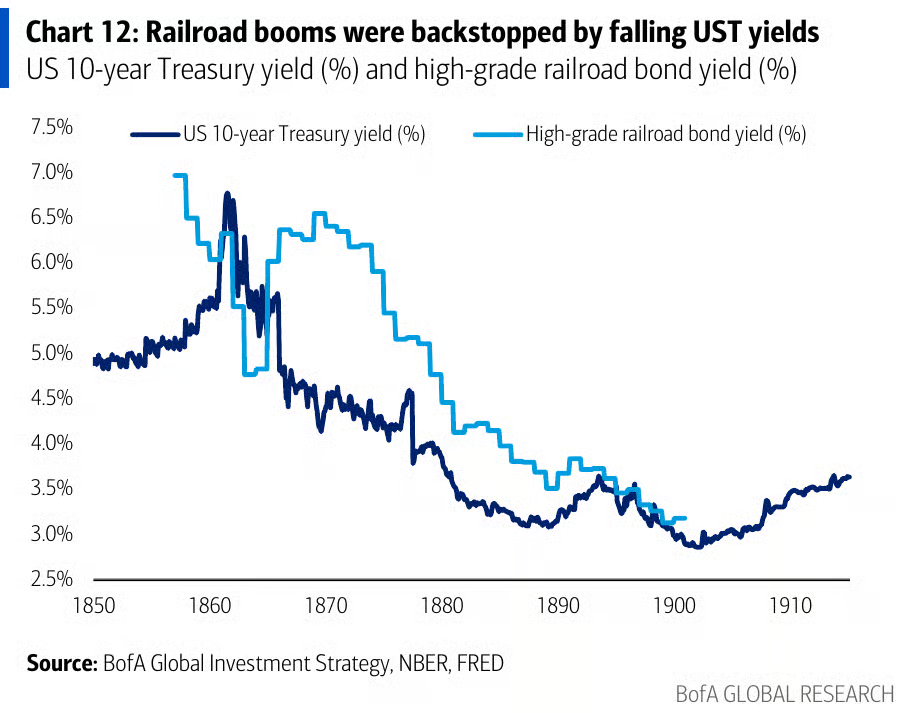
The first railway bubble ended in 1873: between 1861 and 1872, railway stock prices tripled, U.S. railway mileage expanded from 35,000 miles to 70,000 miles, and capital expenditure peaked at roughly 5% of GDP. Subsequently, the Franco-Prussian War triggered a U.S. credit contraction, European capital flowed back home, Jay Cooke & Company collapsed in 1873, and approximately 115 railway companies went bankrupt within the following 12 months.
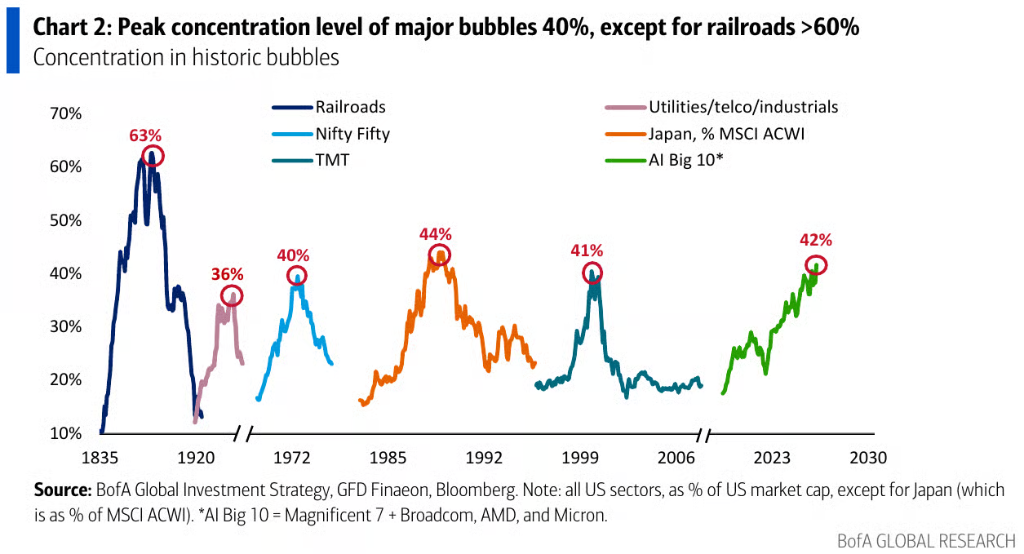
The second railway bubble ended in 1881: railway stocks rose 2.5 times from 1877 to 1881, at one point accounting for 63% of total U.S. stock market capitalization. Railway construction quadrupled in four years, creating excess capacity, freight rates continued to decline, revenues and profits collapsed, and ultimately triggered a banking crisis and the third-longest economic recession in U.S. history (1882 to 1885).

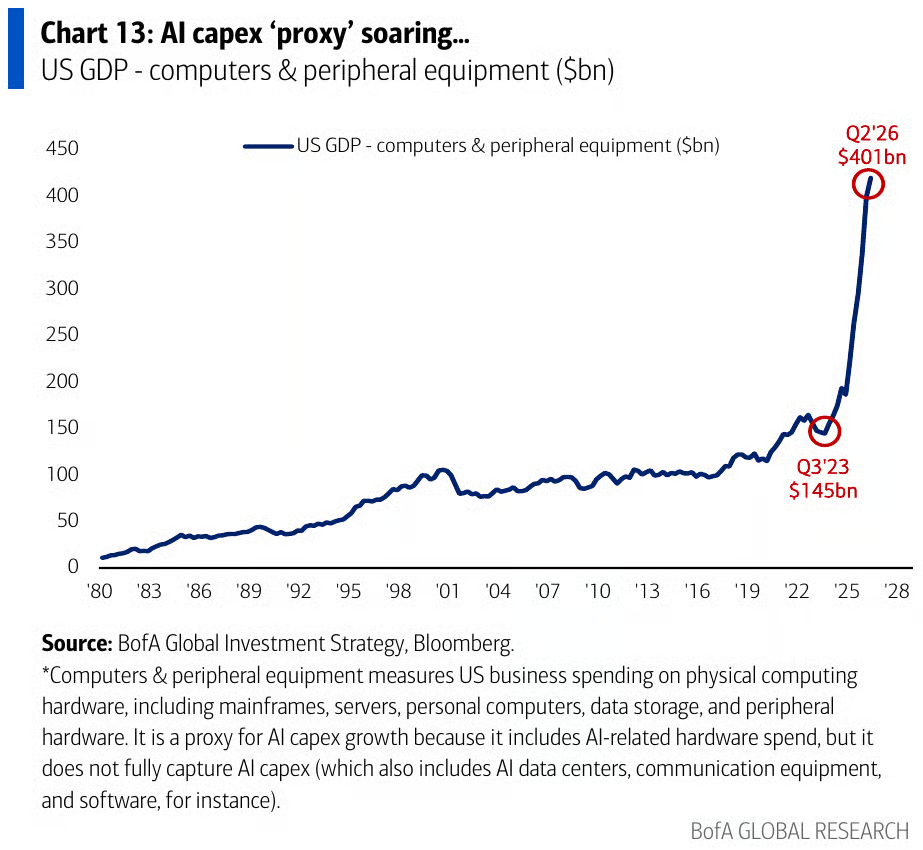
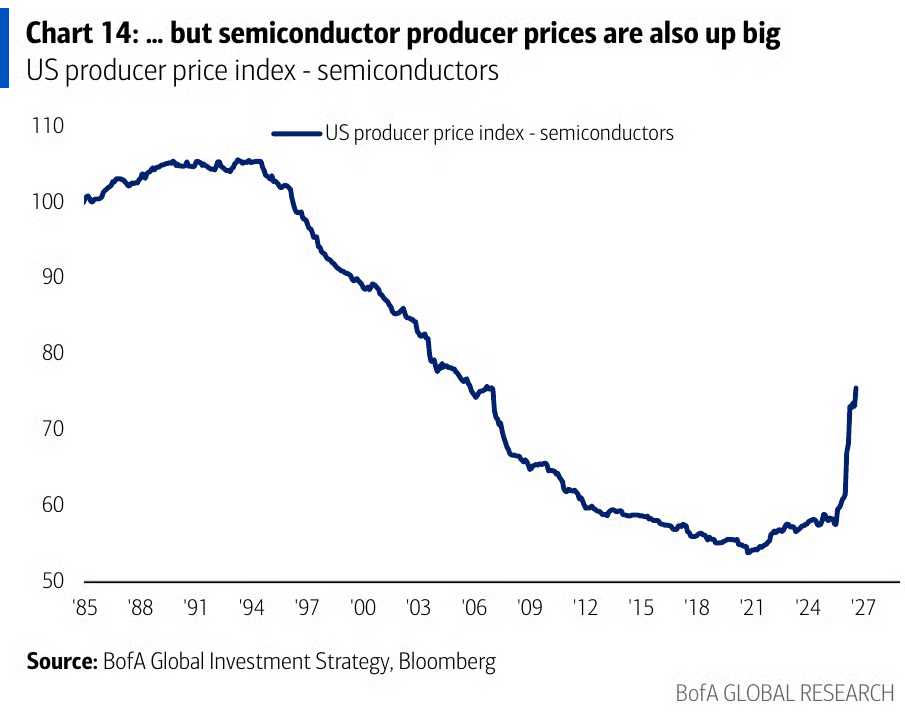
Drawing a contrast with the present, Hartnett points out that hyperscaler capital expenditure is projected to reach 3.5% to 4% of GDP by 2027, still below the 5% peak of the railway era, and semiconductor prices continue to rise, in stark contrast to the railway era when freight rates fell 5% annually.
However, he also warned that both railway bubbles were supported by declining Treasury yields, "and that is clearly not the case today."
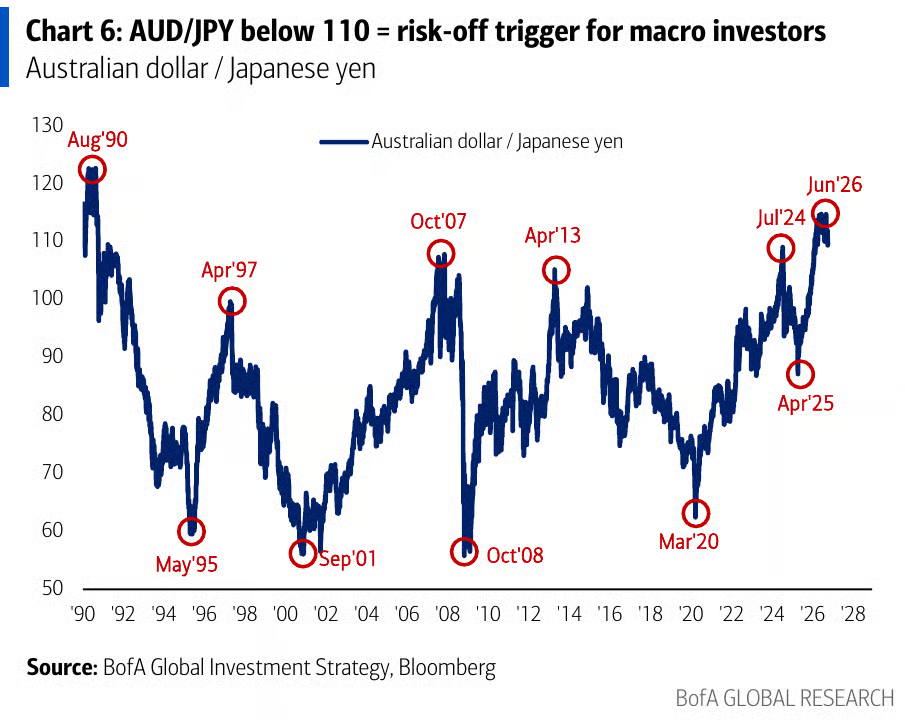
Furthermore, the end of both railway bubbles was accompanied by credit events, sharp liquidity contractions, and geopolitically driven capital outflows — and all three signals are now already manifesting in Oracle credit default swaps (CDS), the AUD/JPY exchange rate, and the French bond market.
"Buy Humiliation": Hartnett Turns Bullish on Shunned U.S. Treasuries
In the bond market, Hartnett's stance is becoming increasingly pronounced.
He acknowledges that a 100 to 200 basis point decline in yields may require a credit event or recession as a catalyst, but he believes the current extreme positioning itself constitutes a reason to buy: asset allocators are broadly overweight equities and short bonds, betting on one last leg up in U.S. tech stocks and one last leg up in Treasury yields.

On long-term U.S. Treasuries, long-duration zero-coupon bonds (ZROZ) have fallen 65% from their March 2020 peak, and the 10-year rolling Treasury return stands at -2%, the lowest in a century. Hartnett cites historical data showing that the last time long-term returns on stocks and commodities were similarly dismal, it precisely marked the emergence of a generational buying opportunity.
He further turns his attention to investment-grade bonds of hyperscalers, noting that the U.S. investment-grade technology bond index (CITE) has fallen 9% in price over the past year, with yields rising from 4.5% to 6.2%. He argues that given the AI industry's backing from the U.S. government, long-term bond yields of hyperscalers such as Oracle (8.4% yield), Meta (7.5%), and Google (6.9%) have approached junk bond levels and may soon attract buying interest.
Investors Begin to Follow Suit and Increase Bond Allocations
The latest EPFR data (as of Wednesday of the week) shows bonds received net inflows of $18.8 billion, equities $15.8 billion, cryptocurrencies $900 million, and gold $700 million, while cash saw outflows of $118 billion due to quarter-end rebalancing.
Specifically, long-duration bonds (government and corporate) with maturities exceeding 6 years saw weekly net inflows of $7.4 billion, the largest since May 2025; municipal bonds saw net inflows of $4.2 billion, a record high since data began in 2004; European equities saw net inflows of $1.3 billion, the largest since February 2026; Chinese equities saw net inflows of $3.7 billion, the largest in nearly 9 weeks; the technology sector saw net inflows of $3.3 billion, the largest in nearly 5 weeks; and utilities saw net inflows of $1 billion, the largest since December 2025.
Notably, BofA private clients' equity allocation as a percentage of assets under management has risen to a record high of 66.3%, while cash allocation has fallen to a record low of 9.4%, indicating that institutional investors' equity positioning is in an extremely crowded state.
Four Key Warning Lines
Hartnett lists four market risk trigger levels to monitor closely: the Global Financials ETF (IXG) falling below $125, the bond market volatility index MOVE rising above 125, the Mid-Cap ETF (MDY) falling below $666, and the Small-Cap ETF (IJR) falling below $135. He notes that once small-caps follow bank stocks downward, the risk cascade of deleveraging will officially begin, and at that point even policy support will be hard-pressed to stop it.
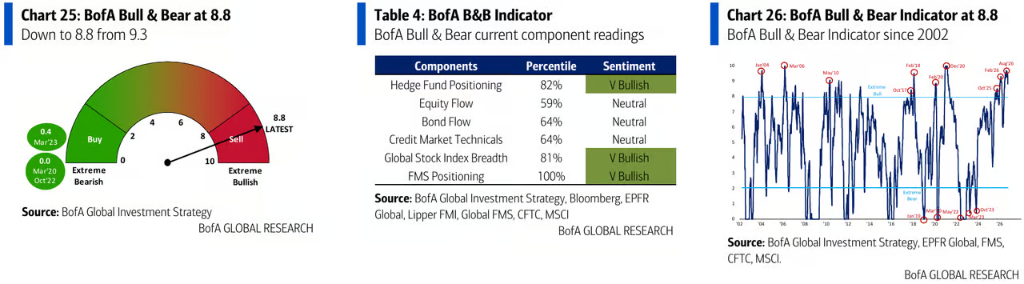
The BofA Bull & Bear Indicator fell from 9.3 to 8.8 this week, which Hartnett attributes to widening high-risk bond spreads, high-yield bond outflows, and rapidly deteriorating global market breadth — a net 27% of constituents in the global equity index simultaneously fell below both their 50-day and 200-day moving averages, the worst level since March. Despite the decline, the reading of 8.8 remains in "sell" territory.
Risk Disclosure and Disclaimer