
Gate Research: BTC and ETH continue their weak consolidation; moving average strategies can capture trend breakouts.
- 核心观点:加密货币市场持续弱势震荡,情绪偏谨慎。
- 关键要素:
- BTC与ETH价格持续下行,反弹乏力。
- 多空比围绕1波动,资金方向摇摆。
- 合约持仓低位,杠杆资金观望。
- 市场影响:短期需警惕下行与清算风险。
- 时效性标注:短期影响
Market Overview
To systematically present the current changes in funding behavior and trading structure in the cryptocurrency market, this report examines five key dimensions: Bitcoin and Ethereum price volatility, long/short ratio (LSR), contract open interest, funding rates, and market liquidation data. These five indicators cover price trends, investor sentiment, and risk profiles, providing a comprehensive reflection of the current market's trading intensity and structural characteristics. The following analysis will examine the latest changes in each indicator since November 4th:
1. Price Volatility Analysis of Bitcoin and Ethereum
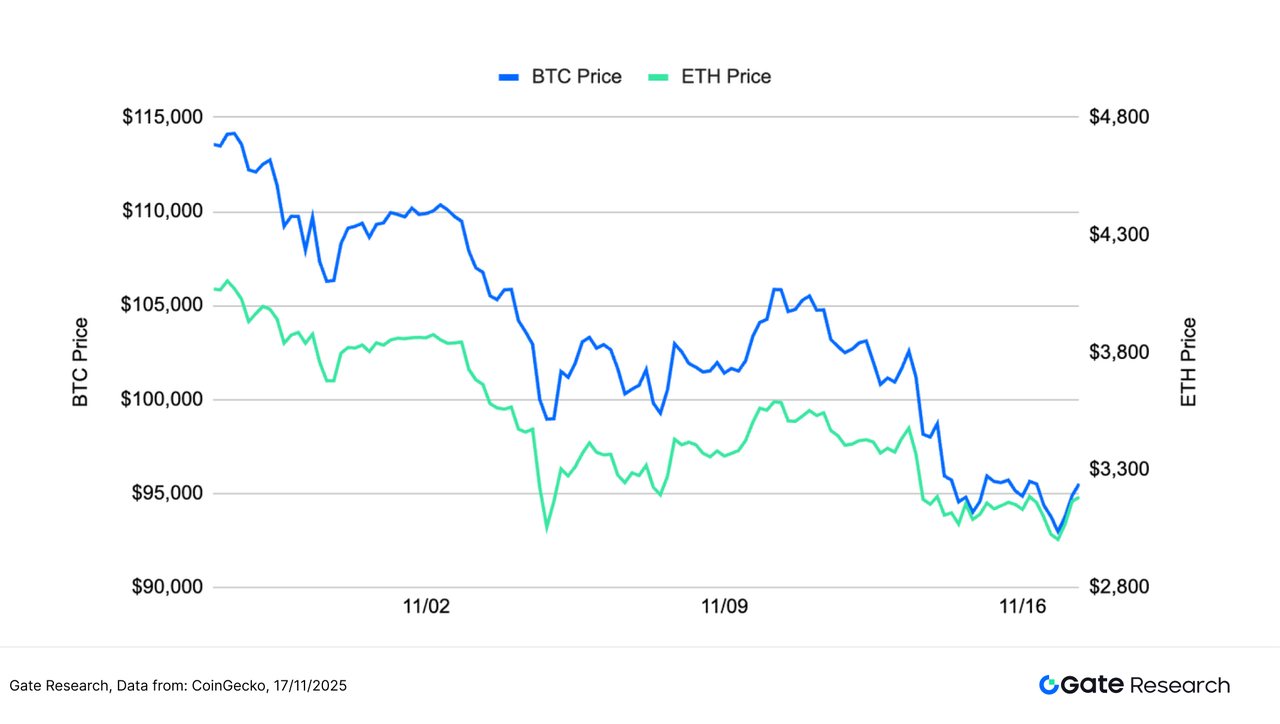
According to CoinGecko data, from November 4th to November 17th, BTC and ETH maintained a weak and volatile pattern, with prices continuing to decline since October, and market sentiment leaning towards caution. BTC weakened after falling from its high above $125,000, and although it attempted several short-term rebounds, none broke through the previous high, and the overall trend remained downward. ETH's movement was roughly in sync with BTC, declining continuously from above $4,000, with a more moderate rebound. [1][2][3] During this period, BTC once fell below $95,000 and attempted to stabilize and consolidate, but buying momentum was limited; ETH found temporary support near $3,000, but the rebound was significantly weaker than BTC. Overall, neither has broken out of its downward structure, and the short-term rebounds are mostly due to short covering, and no trend reversal signal has yet been formed.
Macroeconomic and on-chain factors combined to exacerbate downward pressure. Despite the government shutdown ending last week, liquidity did not return, and the crypto market instead weakened under pressure. Expectations for a December rate cut have significantly decreased from approximately 67% to 46%, and ETFs have seen net outflows of $3.6 billion for two consecutive weeks. Long-term on-chain holders have reduced their holdings by approximately 815,000 BTC in the past 30 days, the largest sell-off in nearly a year, further dragging down the market. High-leverage liquidations amplified volatility, keeping market sentiment cautious. In the medium term, as deleveraging progresses, structural opportunities are gradually accumulating, which investors should pay attention to.
Overall, BTC and ETH are still in a weak consolidation phase after a mid-term downtrend. If BTC fails to effectively recover the $115,000 range, or if ETH fails to regain the $3,800-$4,000 level with increased volume, the short-term market is likely to maintain a weak and volatile trend.
Figure 1: BTC and ETH have been declining continuously from their highs, with a weak rebound structure throughout the period, and the overall trend has continued to be downward and volatile.
The short-term volatility of both BTC and ETH exhibits a high-frequency oscillation pattern, with several rapid spikes occurring during this period. As shown in the chart, BTC volatility surged significantly on several key trading days, even exceeding the intensity of ETH, indicating a more intense emotional reaction in the market during declines. ETH volatility also remained active, but the peak amplitude was generally slightly lower than that of BTC, reflecting that while short-term fluctuations were frequent, the strength was relatively mild.
Overall, market volatility remains high. The sharp spikes in BTC indicate intensified competition between bulls and bears at key price levels, while the continuous increase in ETH volatility suggests sustained short-term capital inflows and outflows and heightened sentiment sensitivity. If the volatility of both BTC and ETH further amplifies in tandem with increased trading volume, it may signal a new directional trend in the market. It is recommended to continue observing the correlation between volatility and trading volume.
Figure 2: BTC volatility surged multiple times, reflecting strong emotional reactions; ETH volatility remained active but peaks were relatively mild.
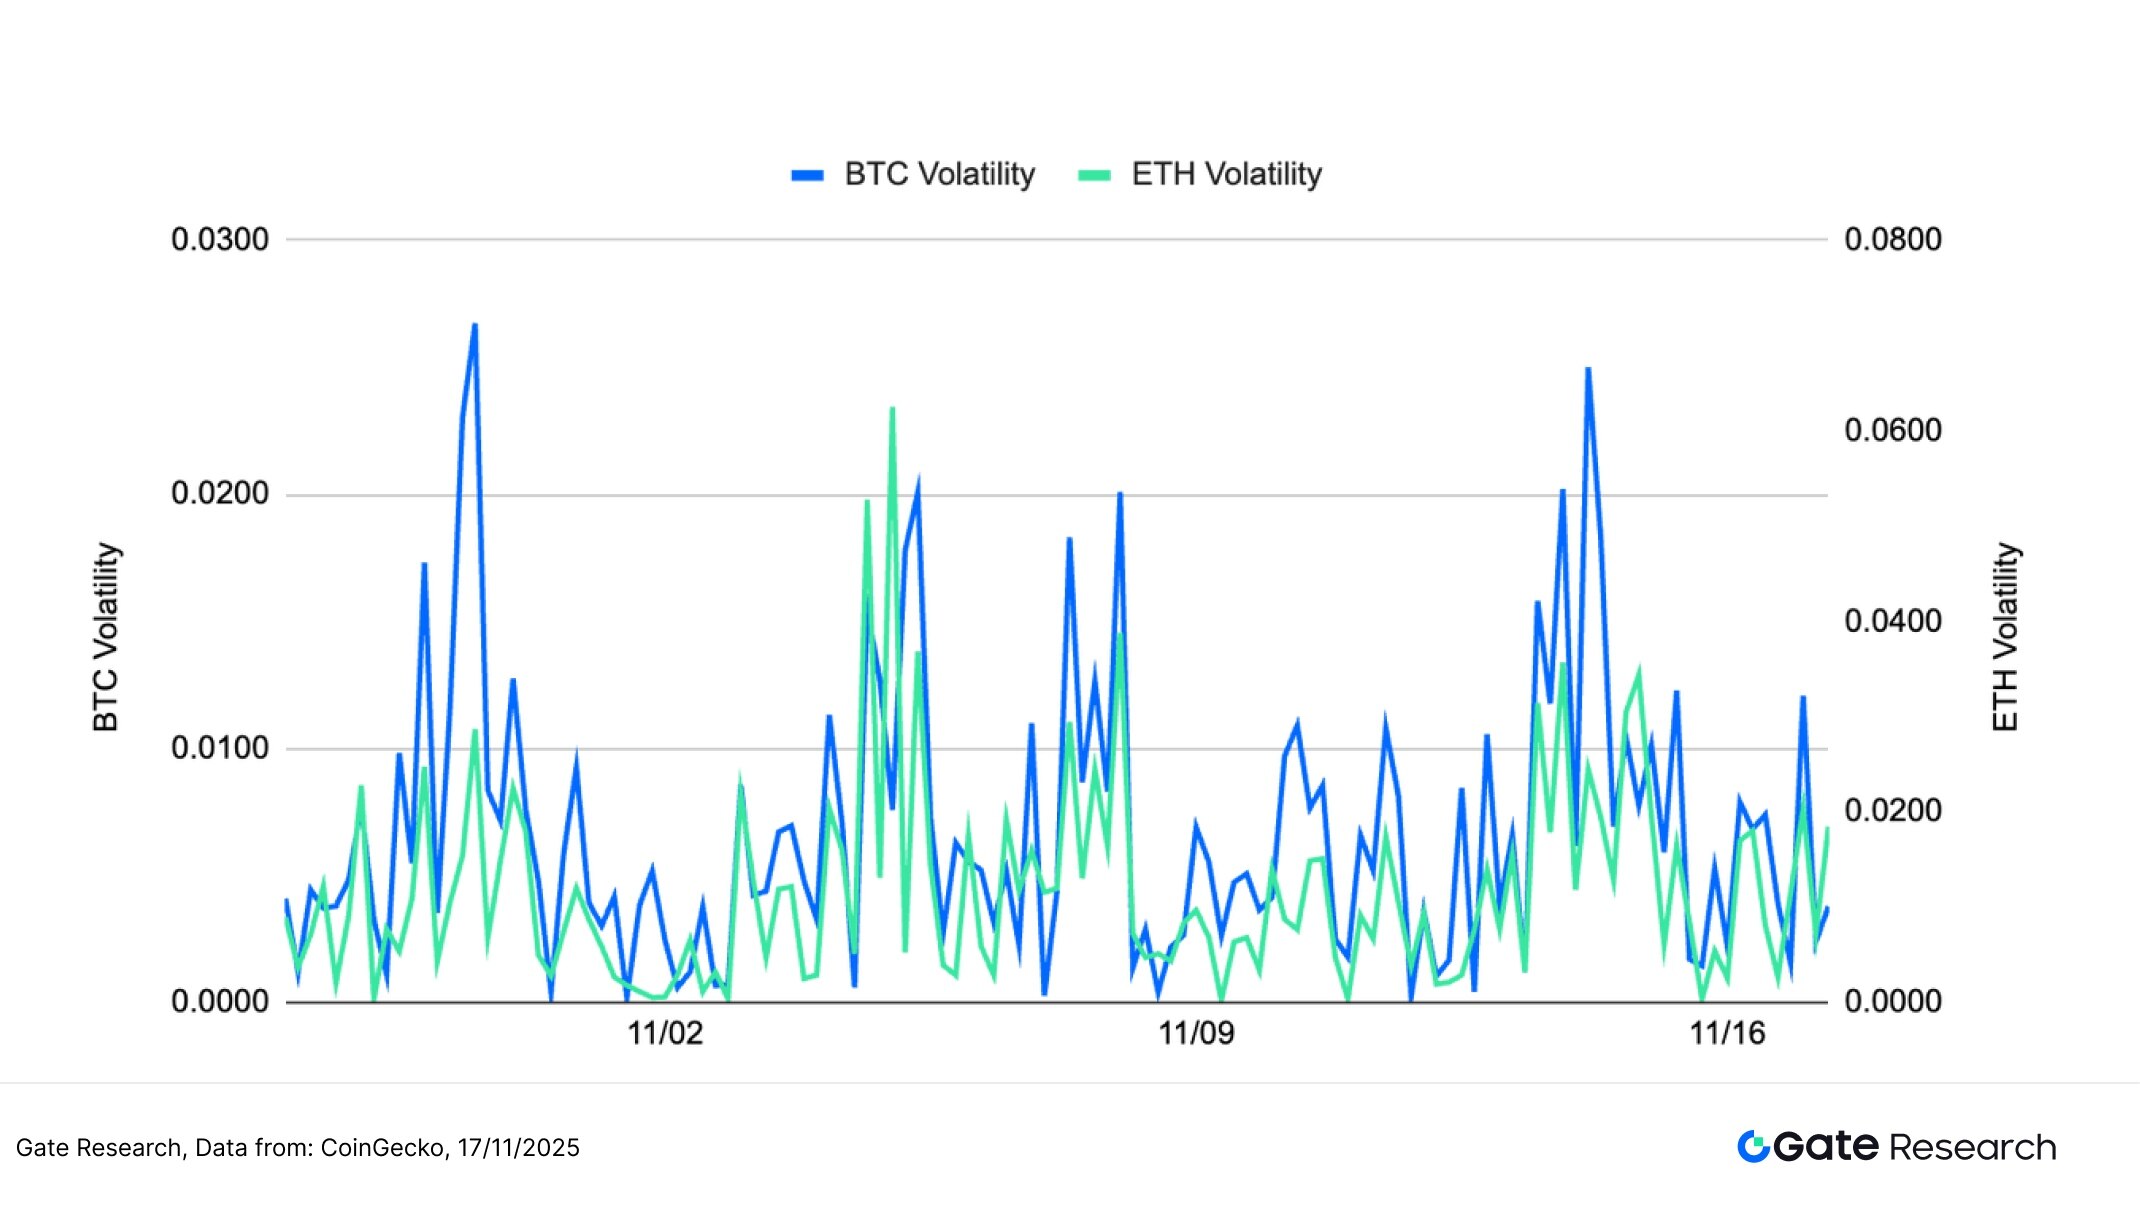
The prices of BTC and ETH have recently continued their weakness, with volatility rising rapidly on several occasions during the decline, indicating fragile sentiment and a more sensitive market response to key price levels. If volatility continues to rise and resonates with trading volume, the short-term market may be poised for a directional move.
2. Bitcoin vs. Ethereum Long/Short Trading Size Ratio (LSR) Analysis
The Long/Short Taker Size Ratio (LSR) is an indicator that measures the proportion of active long positions versus short positions in the market. An LSR greater than 1 indicates a bullish market with long positions dominating, while a lower LSR indicates a bearish market. This indicator reflects the strength of trading sentiment and changes in momentum.
According to Coinglass data, from November 4th to November 17th, the long/short trading volume ratio (LSR) of BTC and ETH fluctuated narrowly around 1, indicating that market sentiment continued to struggle in a weak market, and funds did not form a unified direction. [5]
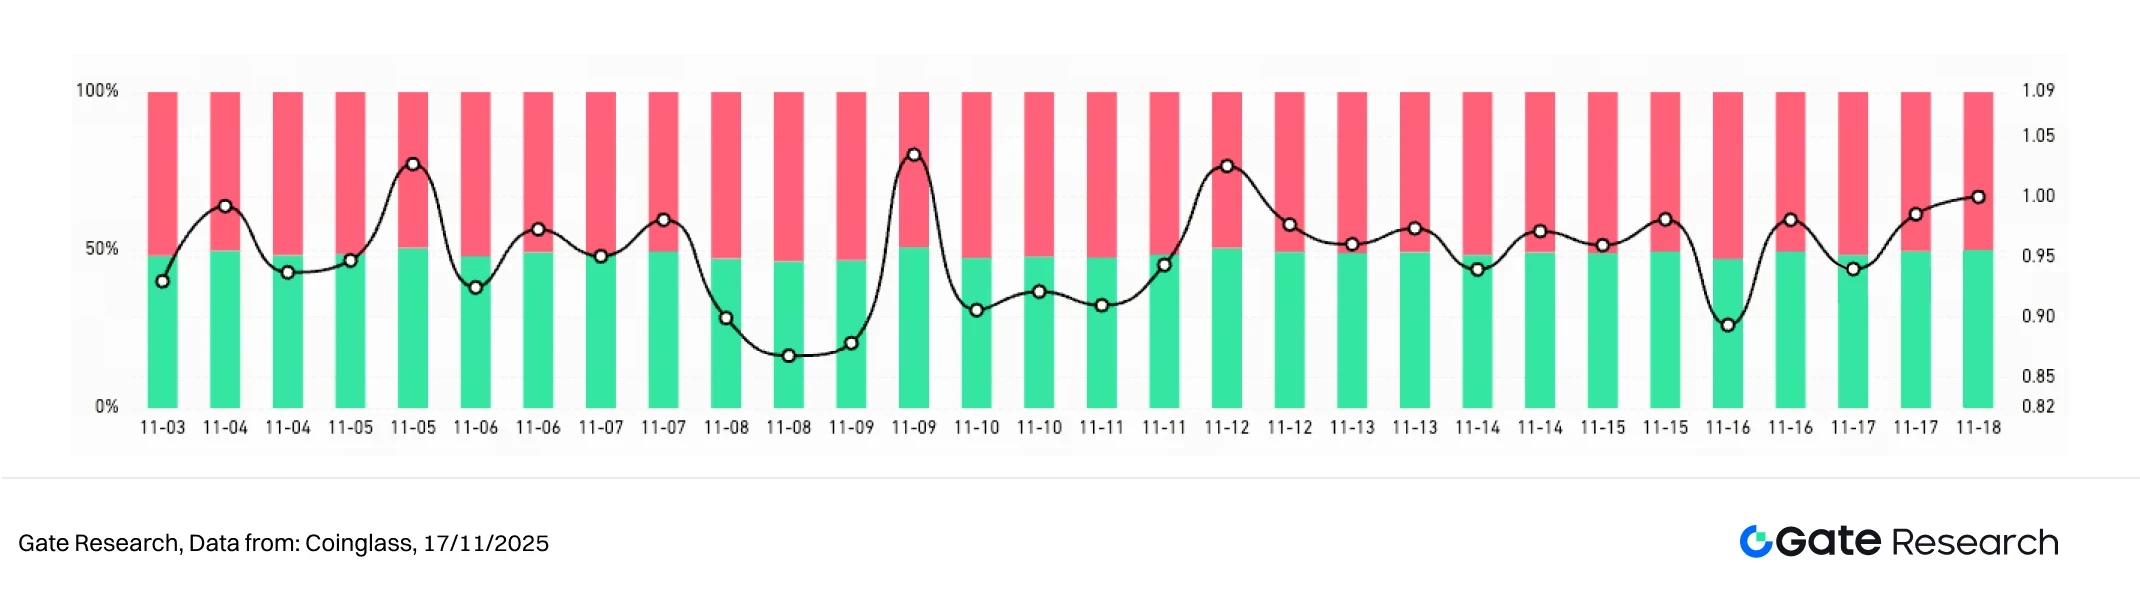
BTC's LSR repeatedly switched between 0.9 and 1.0, with short-term buying and selling alternating in dominance. It only briefly rose above 1 at a few points, reflecting weak upward momentum and a market primarily characterized by observation and tentative rebounds. ETH's LSR exhibited even greater volatility, repeatedly dipping to around 0.9 before quickly rebounding to the 1.0–1.05 range. This indicates more frequent short-term fund inflows and outflows, with faster shifts in bullish and bearish sentiment, particularly evident in lower price levels.
Overall, the long/short ratios for both BTC and ETH have been fluctuating within a range. While sentiment hasn't fully strengthened, the long/short ratios have shown a slight upward trend since mid-month, indicating that bearish sentiment has eased somewhat. If the LSR can stabilize above 1 and be accompanied by a rebound in trading volume, it could be a leading indicator of market stabilization or even a rebound.
Figure 3: BTC's LSR fluctuates repeatedly between 0.9 and 1.0, indicating that the upward momentum remains weak.
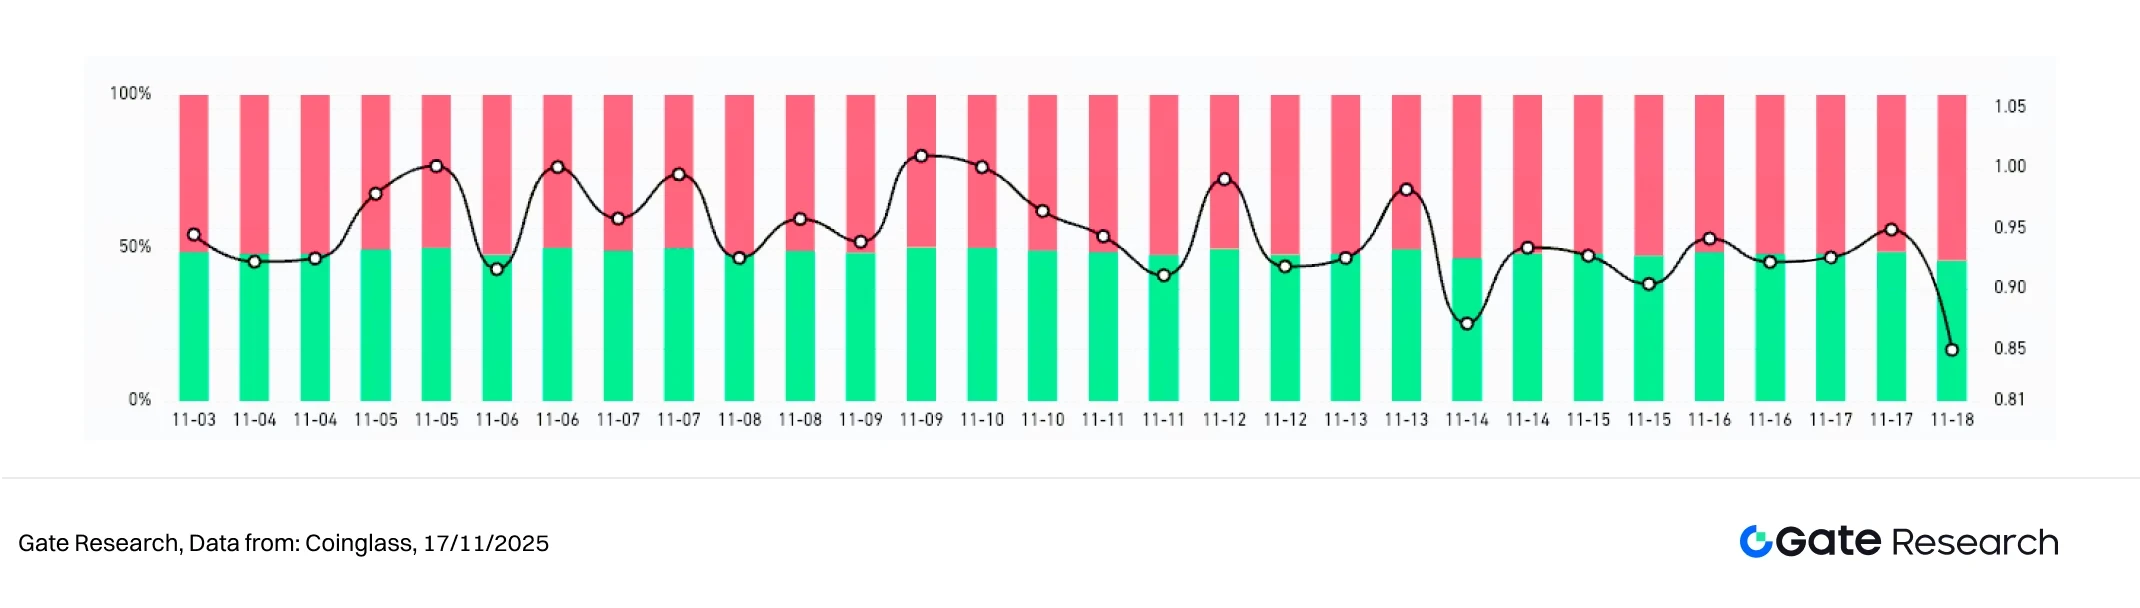
Figure 4: ETH's LSR shows more active volatility, indicating faster shifts in short-term investor sentiment.
3. Analysis of Contract Open Interest
According to Coinglass data, the open interest in BTC and ETH futures contracts has been weakening for the past two weeks, showing no significant recovery after the large-scale deleveraging at the end of October, and remaining at a low level overall. Current open interest (OI) structure indicates that market sentiment is conservative, and funds have not re-entered the market on a large scale. [6]
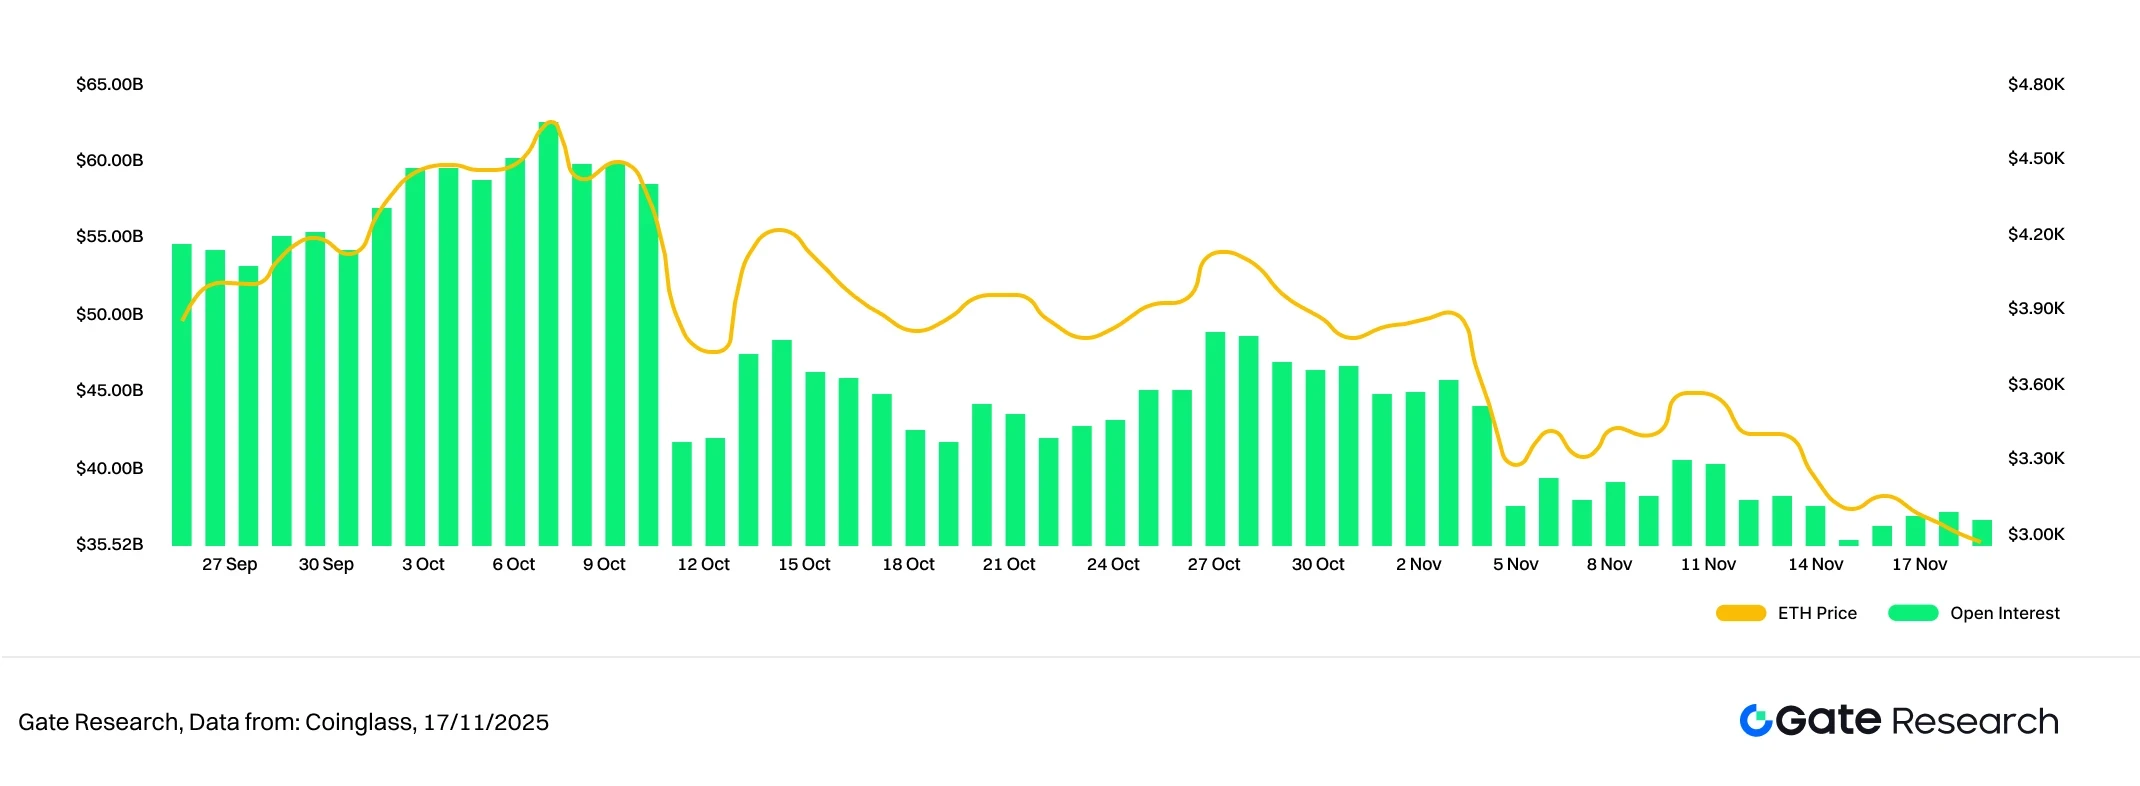
Since its peak in early October, BTC's open interest has declined rapidly and has remained at a relatively low level, without significant signs of increased holdings. This reflects the caution of bulls in a weak market, with institutional and major funds adopting a wait-and-see approach. ETH's open interest (OI) has also shown a stepped decline, with a clear gap in open interest appearing in early November, followed by slight fluctuations at low levels. Compared to BTC, ETH's open interest replenishment has not been stronger, indicating that funds remain conservative about the medium-term trend.
Overall, the current market leverage structure remains in a "wait-and-see phase after deleveraging," with limited capital inflows and a lack of trend-driving forces. If prices subsequently stop falling and rebound, accompanied by increased trading volume, it is expected to drive renewed growth in open interest; conversely, if the market weakens again, the low-level open interest structure may exacerbate short-term volatility risks.
Figure 5: After a significant drop from its high, BTC holdings have remained at a low level, indicating weak willingness to enter the market.
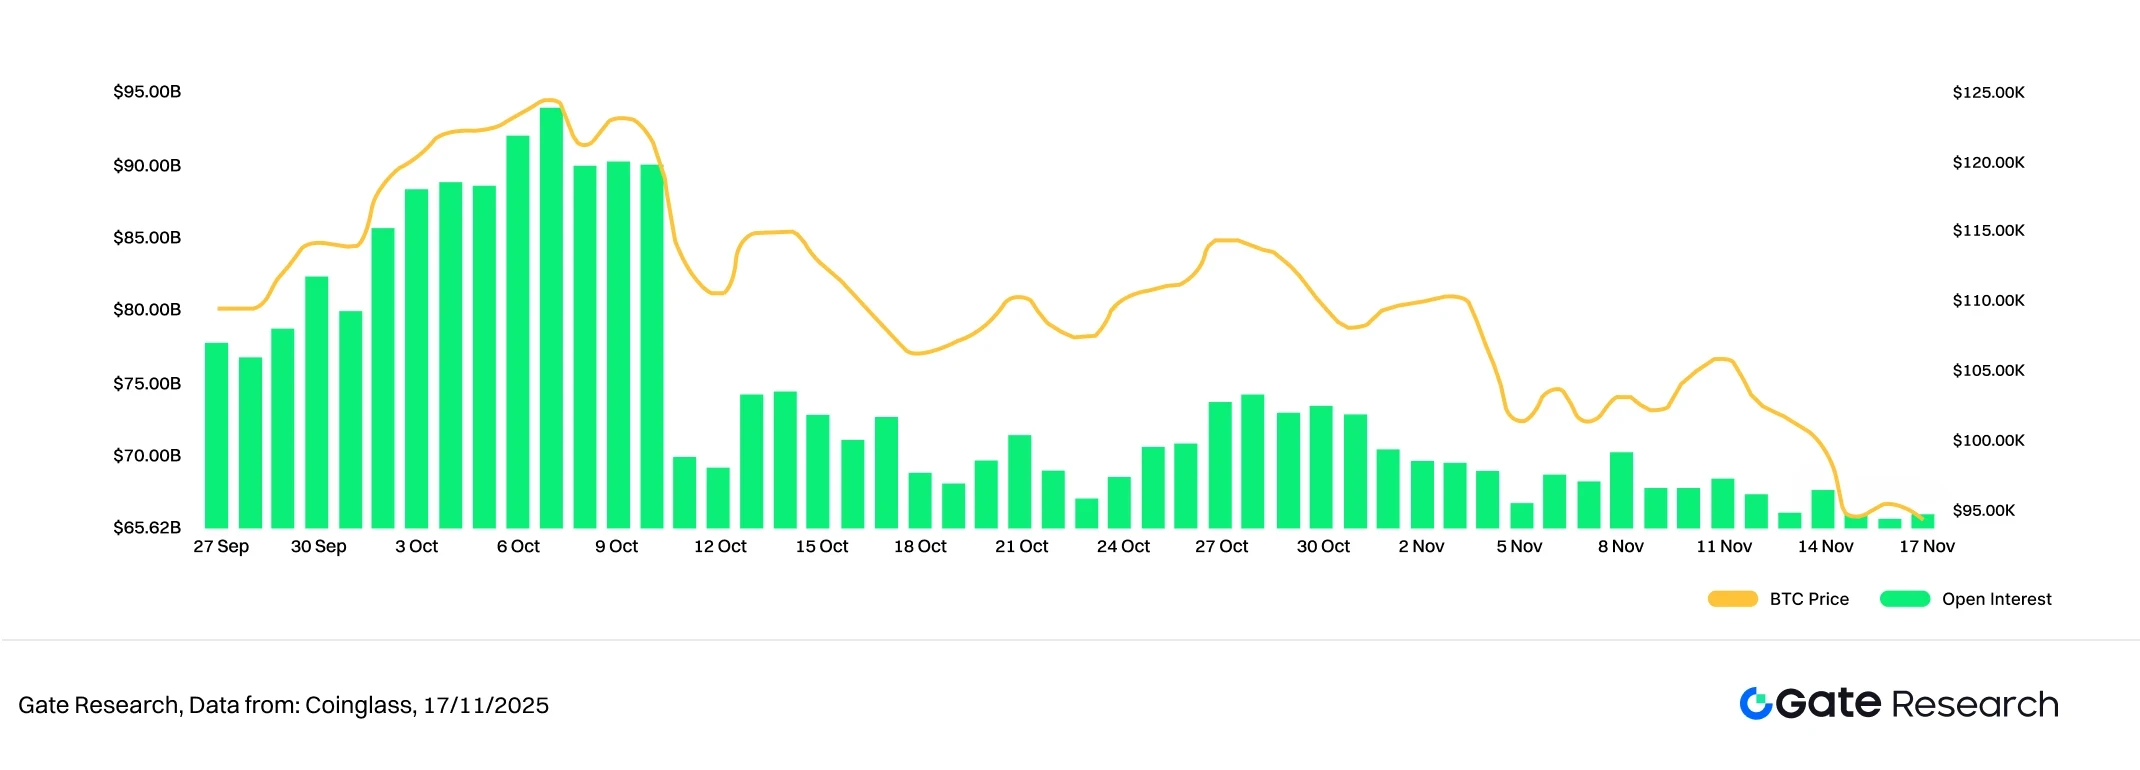
Figure 6: After a continuous decline, ETH holdings have entered a low range, with leveraged funds remaining in a wait-and-see state.
4. Funding Fee Rate
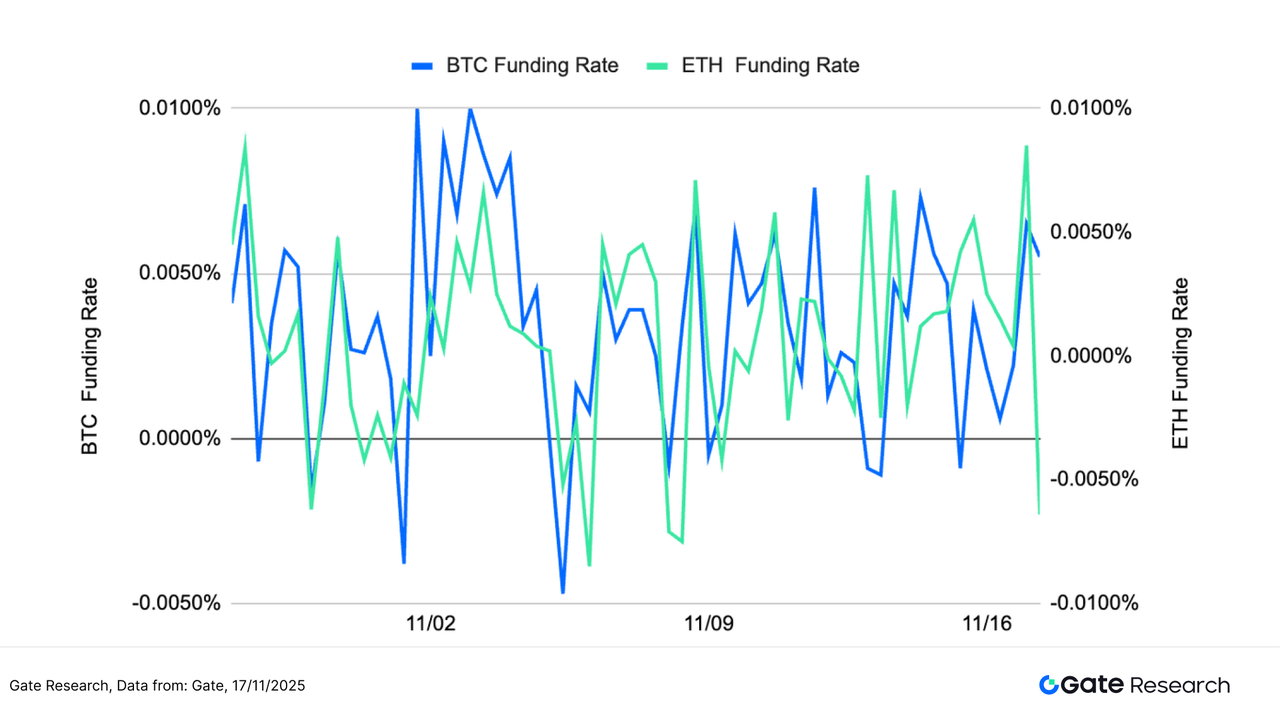
Both BTC and ETH funding rates exhibited a high-frequency oscillation pattern, rapidly switching between positive and negative around 0, reflecting fluctuating market sentiment and a lack of consensus on direction. As shown in the chart, BTC's funding rate volatility increased significantly, repeatedly turning negative and then quickly recovering, indicating that leveraged funds were constantly adjusting their positions in a weak market, suggesting a cautious short-term sentiment. [7][8]
ETH's funding rates also exhibited significant volatility, quickly turning negative during multiple pullbacks before rapidly returning above zero. This indicates that short-term funds are more sensitive to inflows and outflows and react more rapidly to price changes. Overall, ETH's volatility is slightly higher than BTC's, suggesting a stronger short-term trading driver.
Overall, market funding rates are fluctuating in a "directionless, fast-paced" manner, with open interest continuing to decline and entering a low range. If funding rates can stabilize above the positive range and be accompanied by a rebound in trading volume, it could signal a stabilization or even a rebound in the market; conversely, if they remain negative for an extended period, it warrants caution regarding increased bearish momentum and further downward pressure on prices.
Figure 7: BTC and ETH funding rates fluctuate frequently around 0, indicating fluctuating market sentiment with unclear direction.
5. Cryptocurrency contract liquidation chart
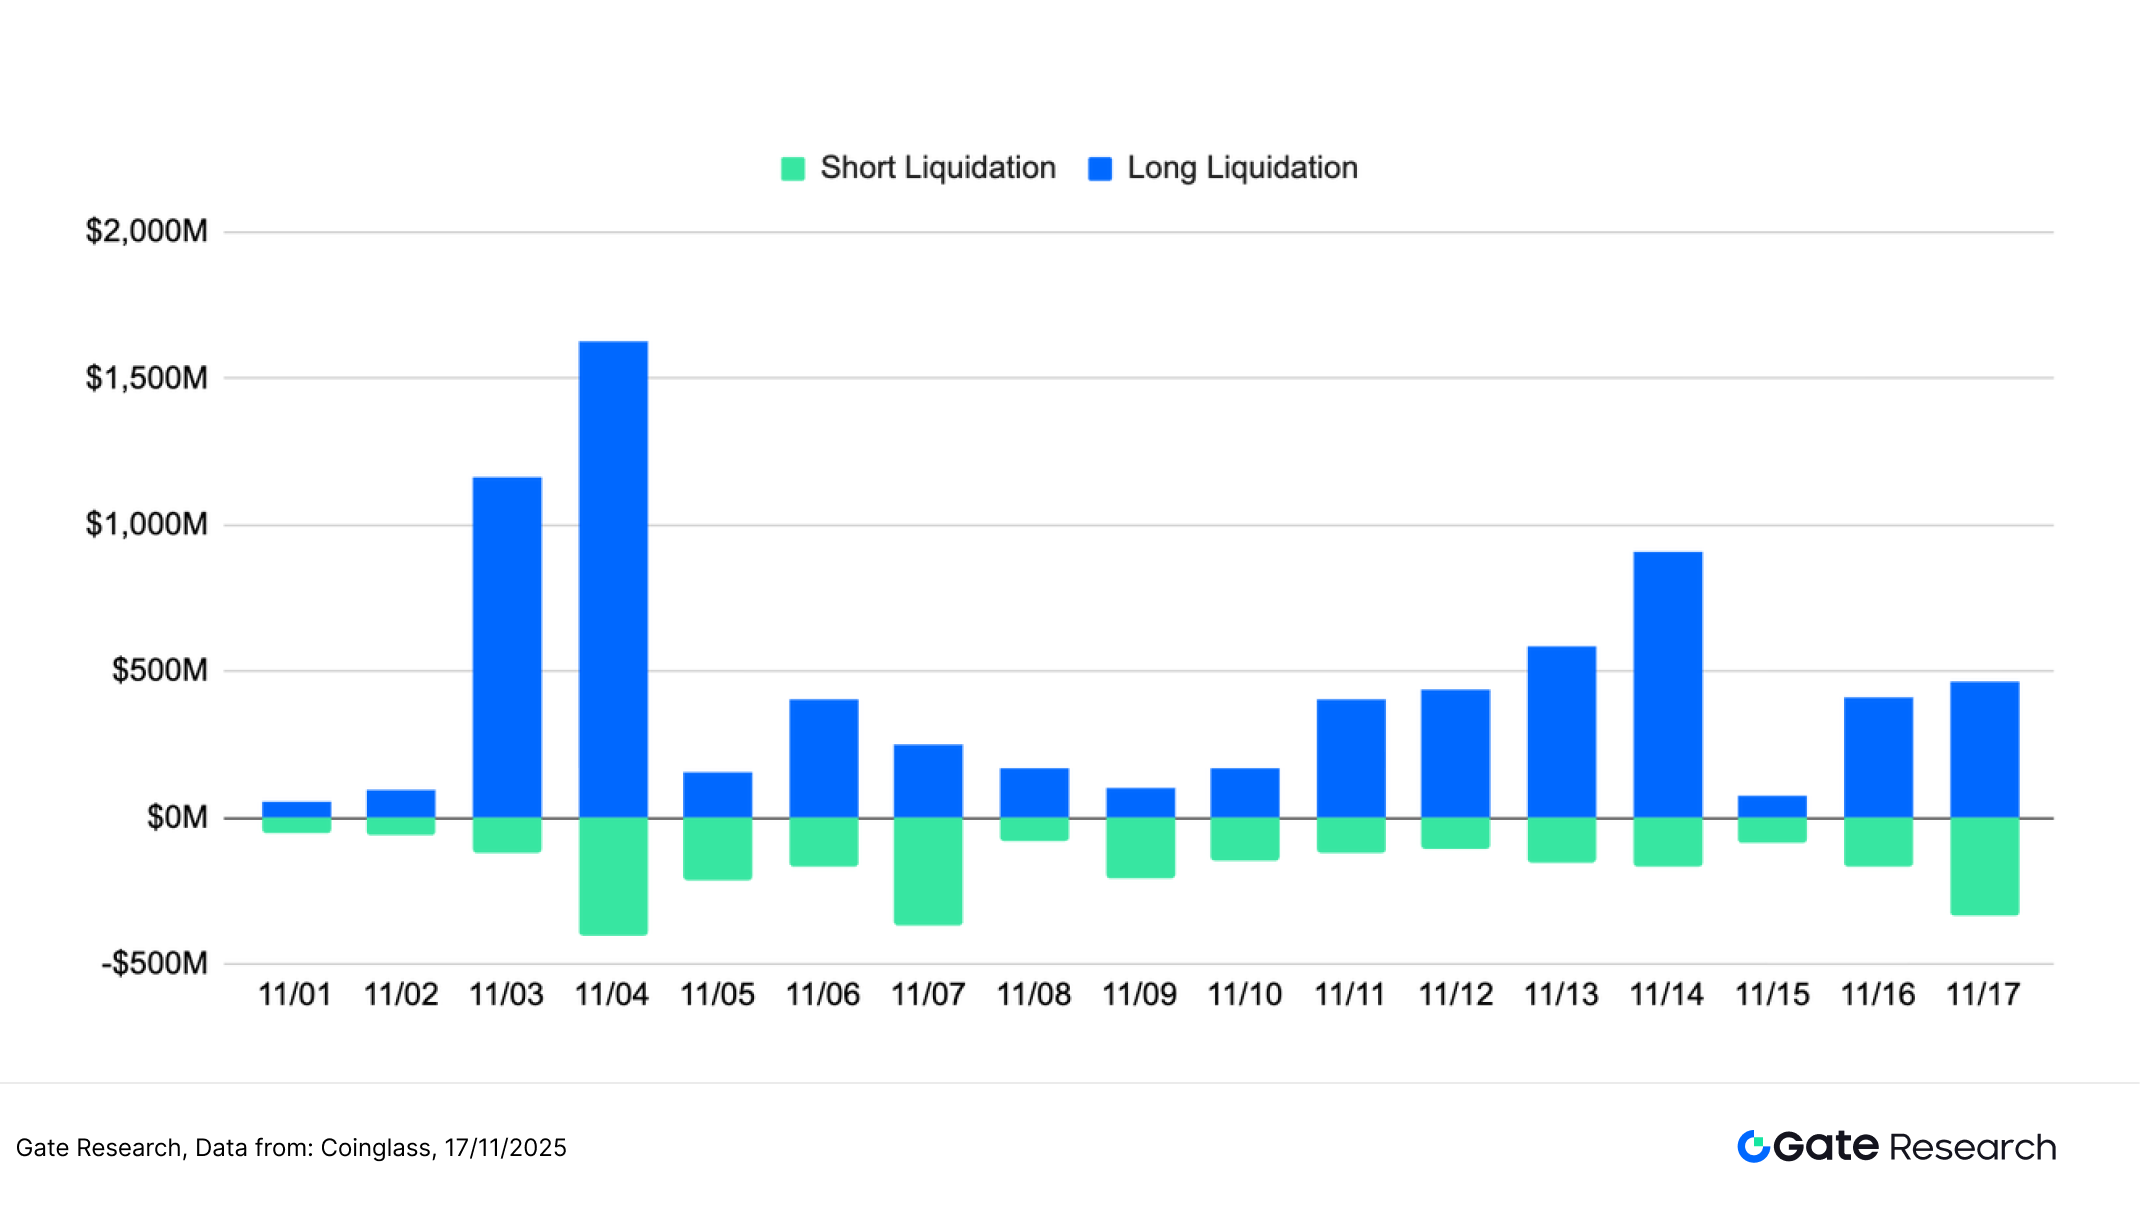
According to Coinglass data, the scale of long liquidations in the crypto market has been significantly higher than that of short liquidations in the past two weeks, indicating that highly leveraged long positions are under the heaviest pressure as the market continues to weaken. The largest wave of liquidations this month occurred on November 3rd and 4th, with single-day long liquidations rapidly escalating to over $1-1.5 billion, reflecting a concentrated and passive liquidation of long positions after the market broke through key support levels. [9]
In the following two trading weeks, although long position liquidations fell from their peak, there were still frequent liquidations of hundreds of millions of dollars, indicating that funds chasing the rally continued to encounter stop-loss orders as the rebound failed. Short position liquidations, on the other hand, were generally smaller in scale, only occasionally increasing during brief price rallies, but were not dominant overall.
Overall, the current liquidation structure exhibits characteristics of "fragile bulls and stable bears," indicating that downward pressure from leverage has not yet been fully released. If prices fail to stabilize or volatility continues to increase, the market may face another round of concentrated liquidations in the short term; conversely, if the scale of liquidations continues to narrow, it will help the market complete the deleveraging and sentiment stabilization process.
Figure 8: In early November, long positions experienced a concentrated surge in liquidation, and subsequent liquidation of long positions remained higher than that of short positions, indicating that downward pressure in the market had not been fully released.
Amidst the current weak and volatile market with continued price declines, overall fund behavior in the crypto market is cautious, with a neutral to weak trend becoming increasingly apparent. In terms of price, BTC and ETH have continued to fall with limited rebound strength, indicating that the market has not yet formed a trend reversal. Volatility, on the other hand, has frequently surged, showing fragile sentiment and sensitivity to key price levels. The long/short trading volume ratio has been fluctuating around 1, indicating uncertain fund direction. Contract open interest has remained low since the significant deleveraging at the end of October, suggesting that leveraged funds have not re-entered the market. Funding rates have also fluctuated wildly around 0, switching between positive and negative multiple times, reflecting a lack of consistent market direction. Meanwhile, liquidation structures are mainly long liquidations, indicating that downward pressure has not yet been fully released.
Under the aforementioned structure, while market sentiment has not systematically deteriorated, short-term support has weakened significantly, limiting the sustainability of the upward trend. The lack of trend-driven price action, weak leverage, and fluctuating sentiment make the current phase closer to a "trendless, weak rebound" consolidation range. In this environment of divergent bullish and bearish sentiment and converging leverage, the key to trading shifts to the accurate identification of trends and fluctuations. The following content will focus on the practical performance of the "Moving Average Trend Breakout Strategy" during weak consolidation and trend-switching phases, evaluating its effectiveness in capturing structural breakouts, filtering short-term noise, improving risk control efficiency, and reducing emotional chasing of highs and lows, as well as its stability and applicability under different market rhythms.
Quantitative Analysis - Moving Average Trend Breakout Strategy
( Disclaimer : All forecasts in this article are based on historical data and market trends and are for reference only. They should not be considered investment advice or a guarantee of future market performance. Investors should fully consider the risks and make prudent decisions before making any related investments.)
1. Strategy Overview
The moving average trend breakout strategy is a short-to-medium-term trading strategy based on moving average crossovers and price fluctuations to determine trends. It combines Simple Moving Averages (SMA) and Exponential Moving Averages (EMA) to monitor changes in price direction, using short-term moving averages crossing above or below long-term moving averages as buy or sell signals. The strategy also incorporates dynamic stop-loss and take-profit mechanisms to lock in profits or limit losses, making it suitable for volatile market environments with emerging trends.
2. Core parameter settings
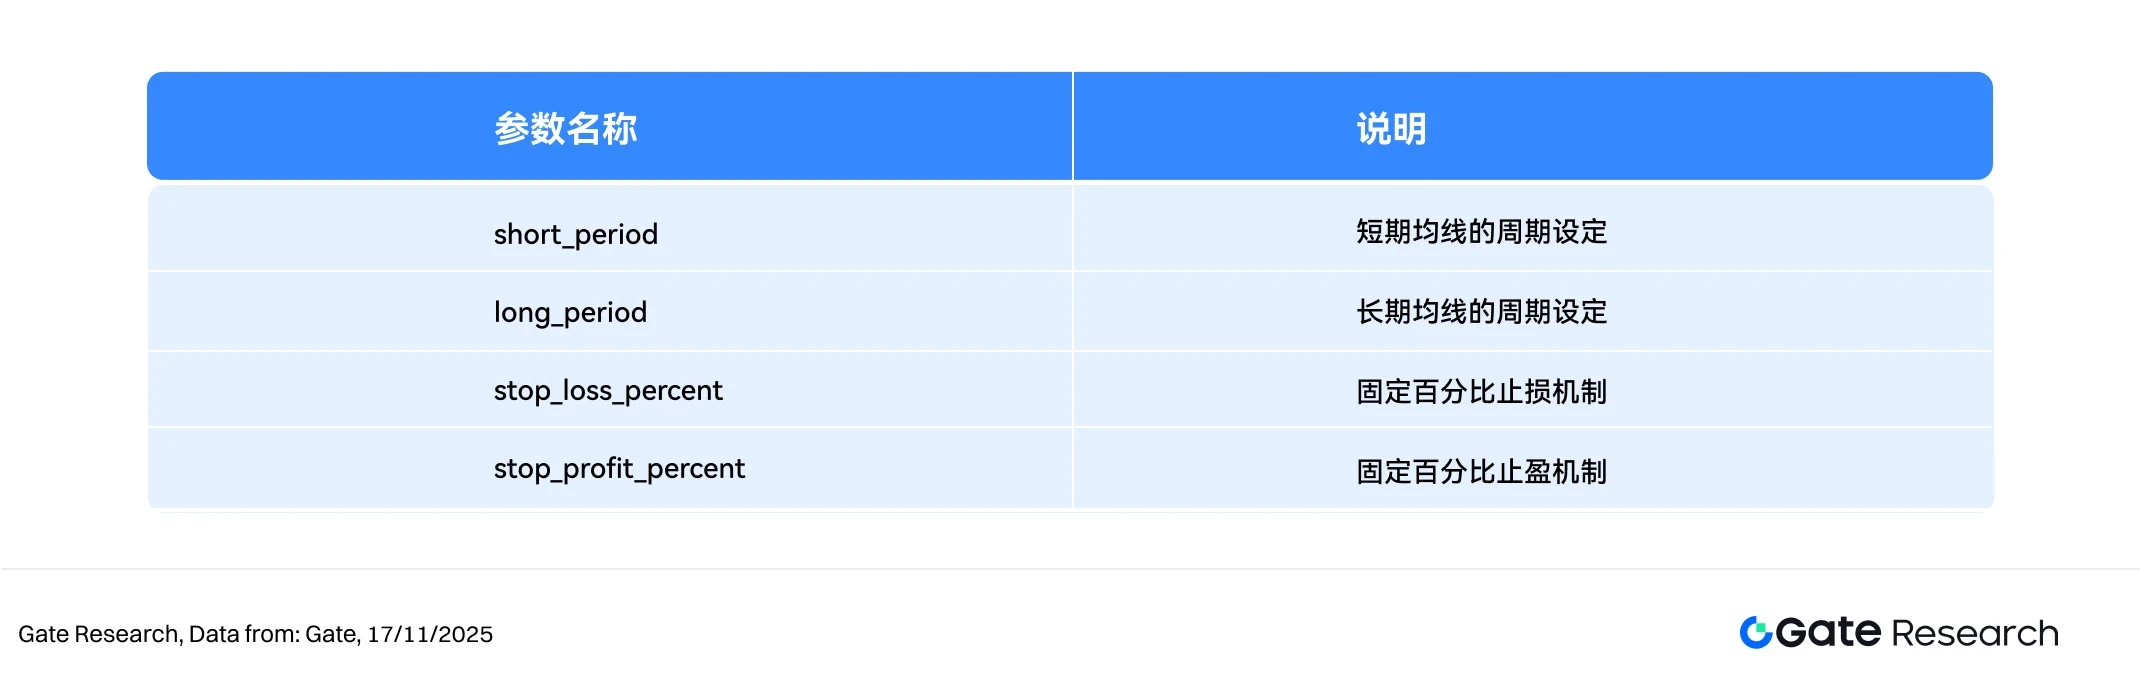
3. Strategy Logic and Operation Mechanism
- Entry requirements
When there are no open positions, the strategy triggers a buy order when the short-term moving average crosses above the long-term moving average.
- Conditions for participation:
When the short-term moving average crosses below the long-term moving average, it is considered a sign of weakening market conditions and triggers a closing signal.
Stop-loss closing : If the price falls back to the purchase price * (1 - stop_loss_percent), a forced stop-loss is triggered.
Take-profit closing : If the price rises to the purchase price * (1 + take_profit_percent), the take-profit closing is triggered.
- Practical Example Diagram
Trading signal triggered
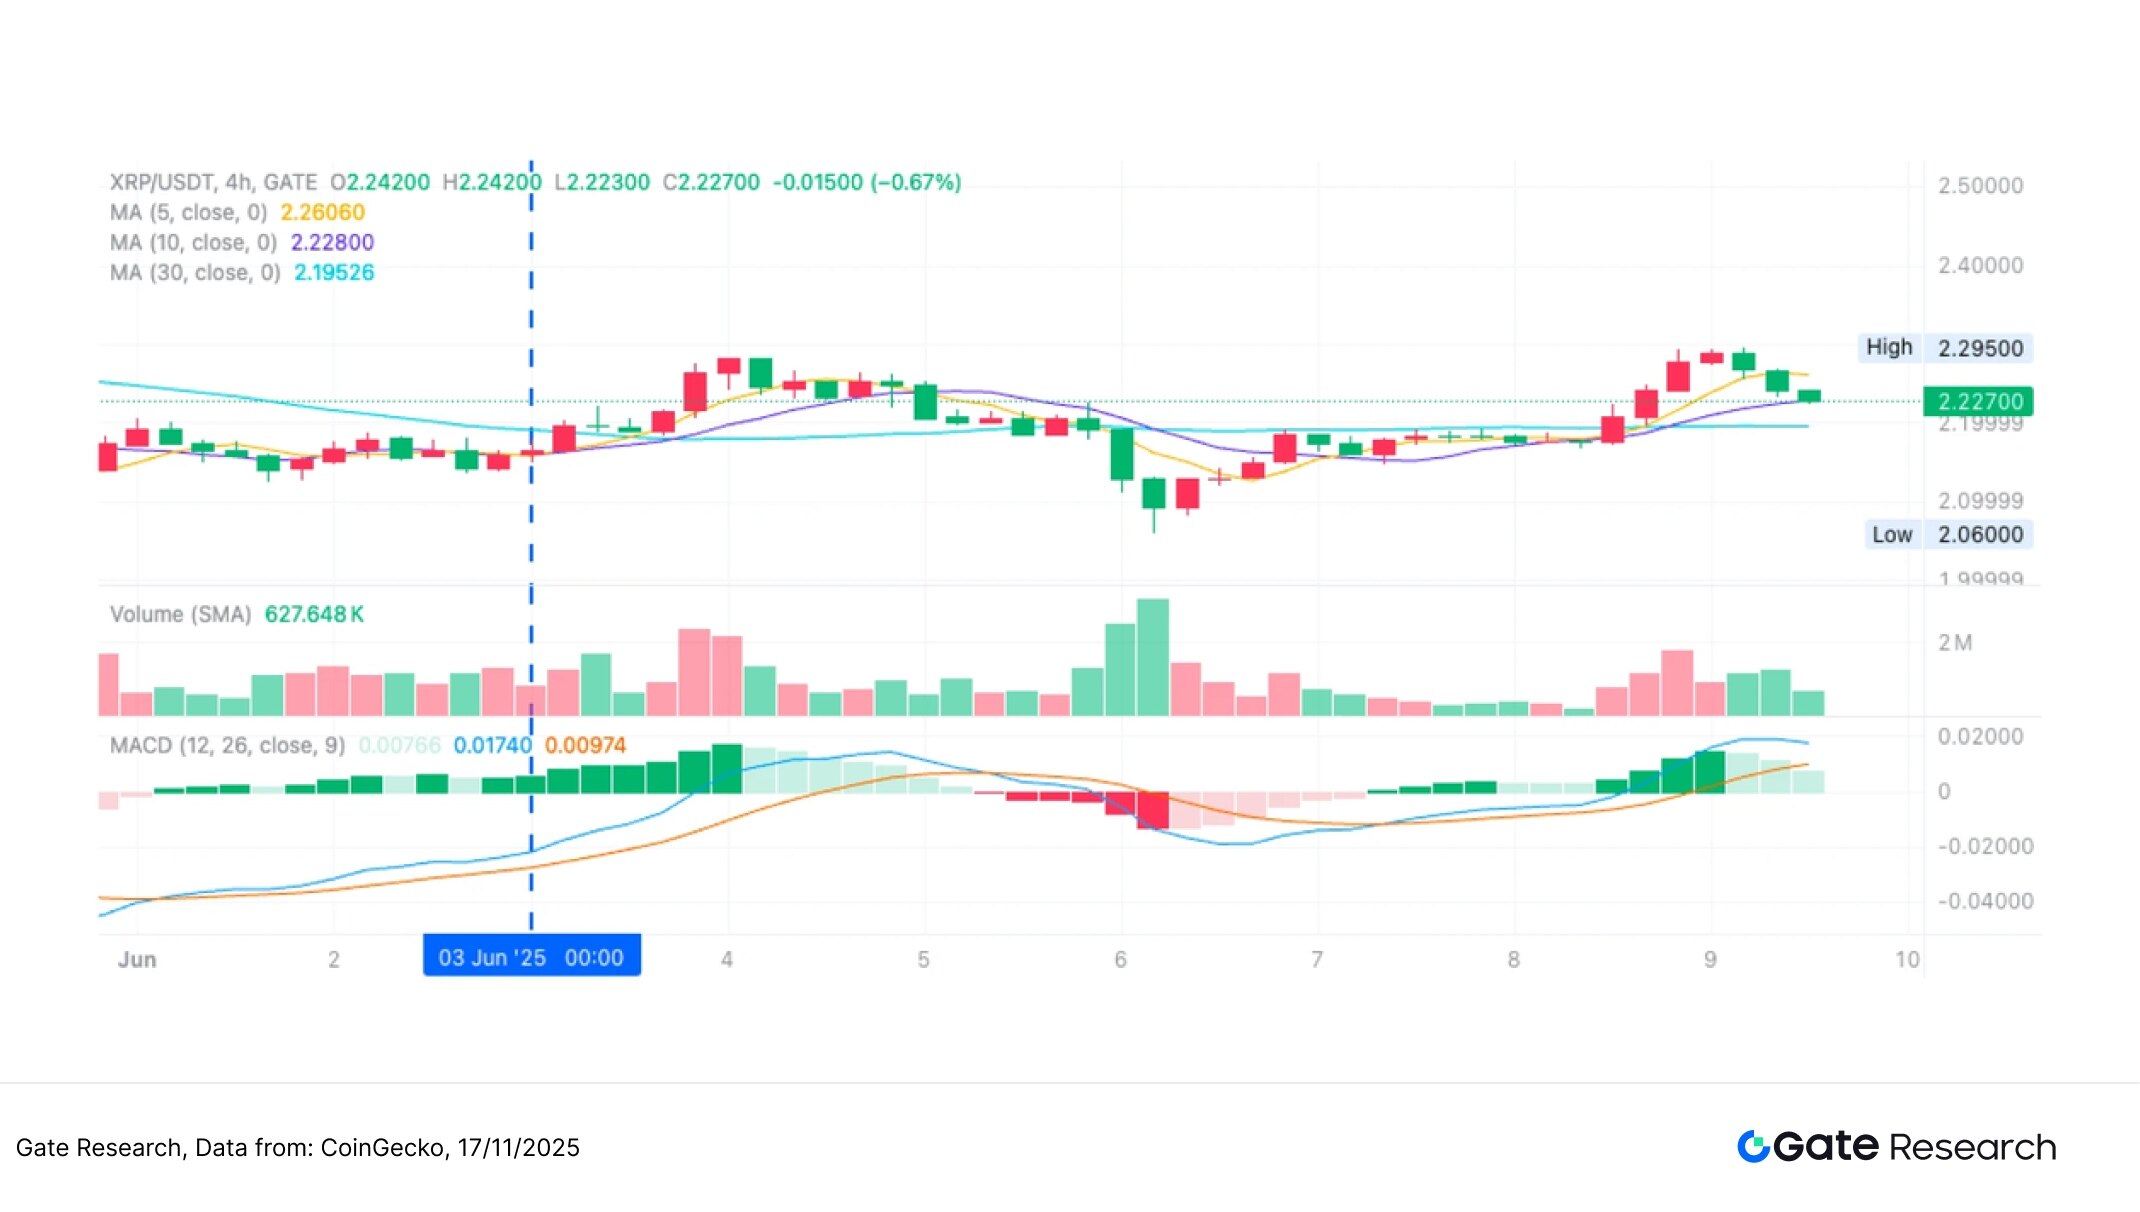
The chart below shows the 4-hour candlestick chart of XRP/USDT when the strategy was most recently triggered on June 3, 2025. After a brief pullback, the price showed a technical reversal signal in the early morning of June 3: the short-term moving average MA5 began to cross above the medium-to-long-term moving average MA10, the MACD fast line and slow line formed a golden cross, and the trading volume increased simultaneously, indicating strengthening bullish momentum. The strategy triggered a buy at this point, successfully capturing the subsequent significant rebound, which is consistent with the entry logic of a trend-following bullish strategy.
Figure 9: Schematic diagram of the actual entry position when the XRP/USDT strategy conditions are triggered (June 3, 2025)
Transaction Actions and Results
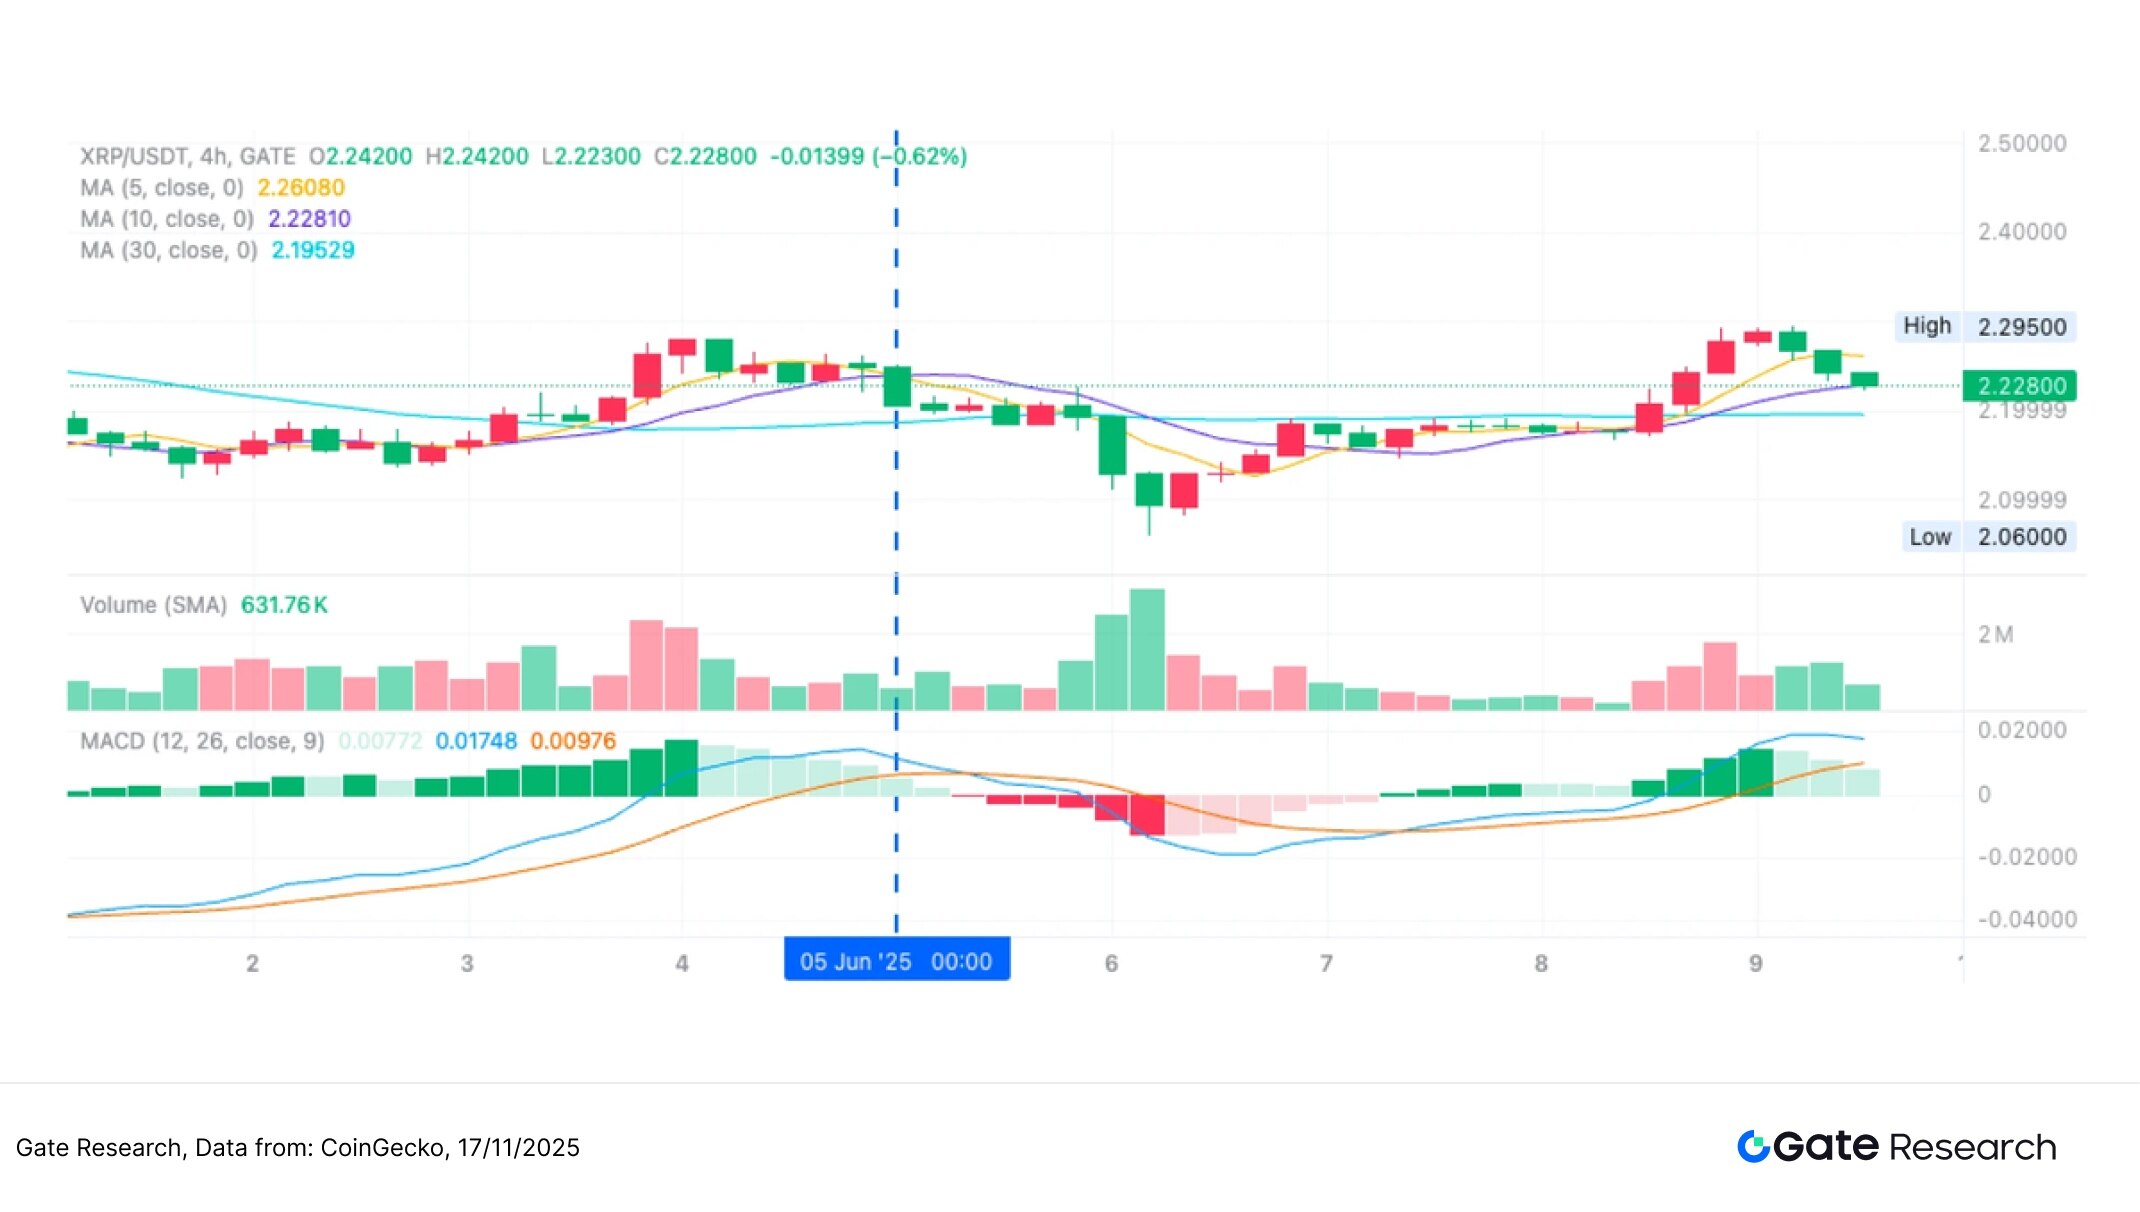
After a continuous upward trend, XRP showed signs of short-term weakness, with a MACD death cross forming and short-term moving averages starting to decline. The strategy executed a sell order at this point, successfully locking in profits from the previous rebound. Although the price subsequently only slightly retreated, this exit strategy adhered to the risk control logic of "exiting when momentum weakens," demonstrating good discipline in swing trading. In the future, combining dynamic profit-taking or trend-following mechanisms could further improve overall profitability and profit potential.
Figure 10: Exit Point Diagram for XRP/USDT Strategy (June 5, 2025)
Through the above practical examples, we have intuitively demonstrated the entry and exit logic and dynamic risk control mechanism of the trend strategy during price momentum changes. The strategy determines the trend direction based on the crossover of short-term and long-term moving averages, entering the market when the short-term moving average crosses above it to capture upward momentum; and exiting the market promptly when the short-term moving average crosses below it or momentum indicators weaken, effectively avoiding drawdown risk. While controlling profit and loss fluctuations, the strategy successfully locks in profits for the main price swings. This case study not only verifies the operability and disciplined execution of the trend strategy in actual market conditions but also demonstrates its strong profit-holding ability and defensive capabilities in highly volatile market environments, providing a reliable empirical foundation for subsequent parameter optimization and cross-product application.
4. Practical Application Examples
- Parameter backtesting settings
To find the optimal combination of parameters, we conducted a systematic grid search for the following range:
• short_period: 2 to 10 (step size is 1)
• long_period: 10 to 20 (step size 1)
• stop_loss_percent: 1% to 2% (step size 0.5%)
• take_profit_percent: 10% to 16% (in 5% increments)
Taking the top ten crypto projects by market capitalization (excluding stablecoins) as an example, this article backtested 2-hour candlestick chart data from October 2024 to October 2025. The system tested a total of 891 parameter combinations and selected the ten combinations with the best annualized return. The evaluation criteria included annualized return, Sharpe ratio, maximum drawdown, and ROMAD (return to maximum drawdown ratio) to comprehensively measure the stability and risk-adjusted performance of the strategy under different market conditions.
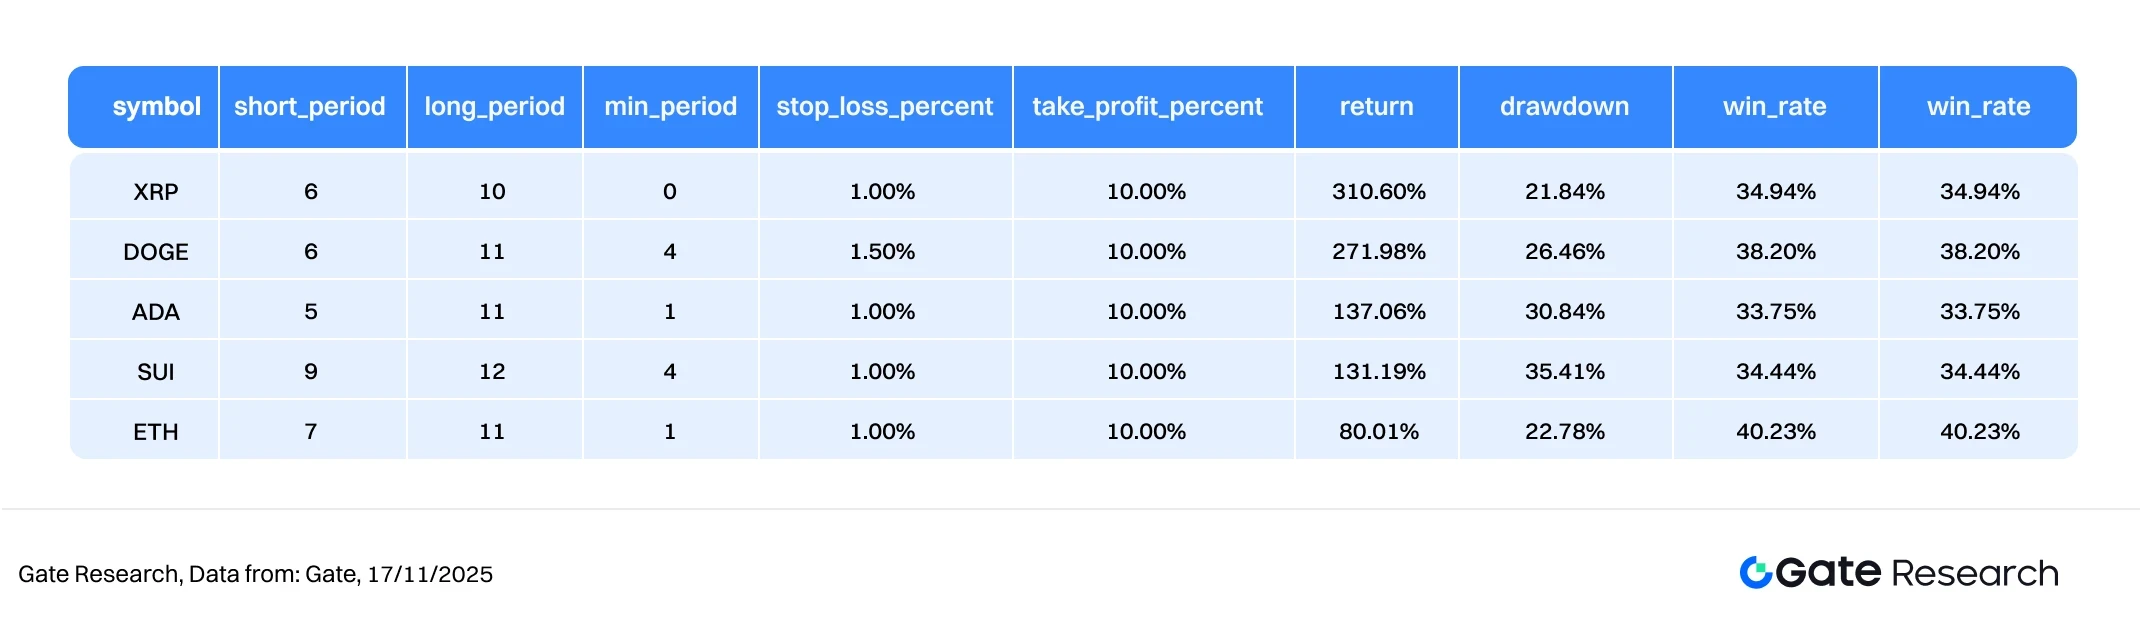
Figure 11: Performance Comparison Table of Five Optimal Strategies
- Strategy Logic Explanation
When the program detects a short-term moving average crossing above a long-term moving average, it is considered a trend initiation signal, and the strategy will immediately trigger a buy order. This structure aims to capture the initial strengthening phase of a market trend, identifying the price trend direction through moving average crossovers and combining them with a dynamic stop-loss and take-profit mechanism for risk control. If the short-term moving average subsequently crosses below the long-term moving average, or the price reaches the preset stop-loss or take-profit ratio, the system will automatically execute an exit order to achieve robust profit locking and risk control.
Taking XRP as an example, the settings used in this strategy are as follows:
• short_period = 6 (short-term moving average period, used to track price changes)
• long_period = 10 (long-term moving average period, used to determine trend direction)
• stop_loss_percent = 1%
• take_profit_percent = 10%
This logic combines trend breakout signals with fixed-ratio risk control rules, making it suitable for trading environments with clear market direction and well-defined wave structures. It effectively controls drawdowns while following the trend, improving trading stability and overall return quality.
- Performance and Results Analysis
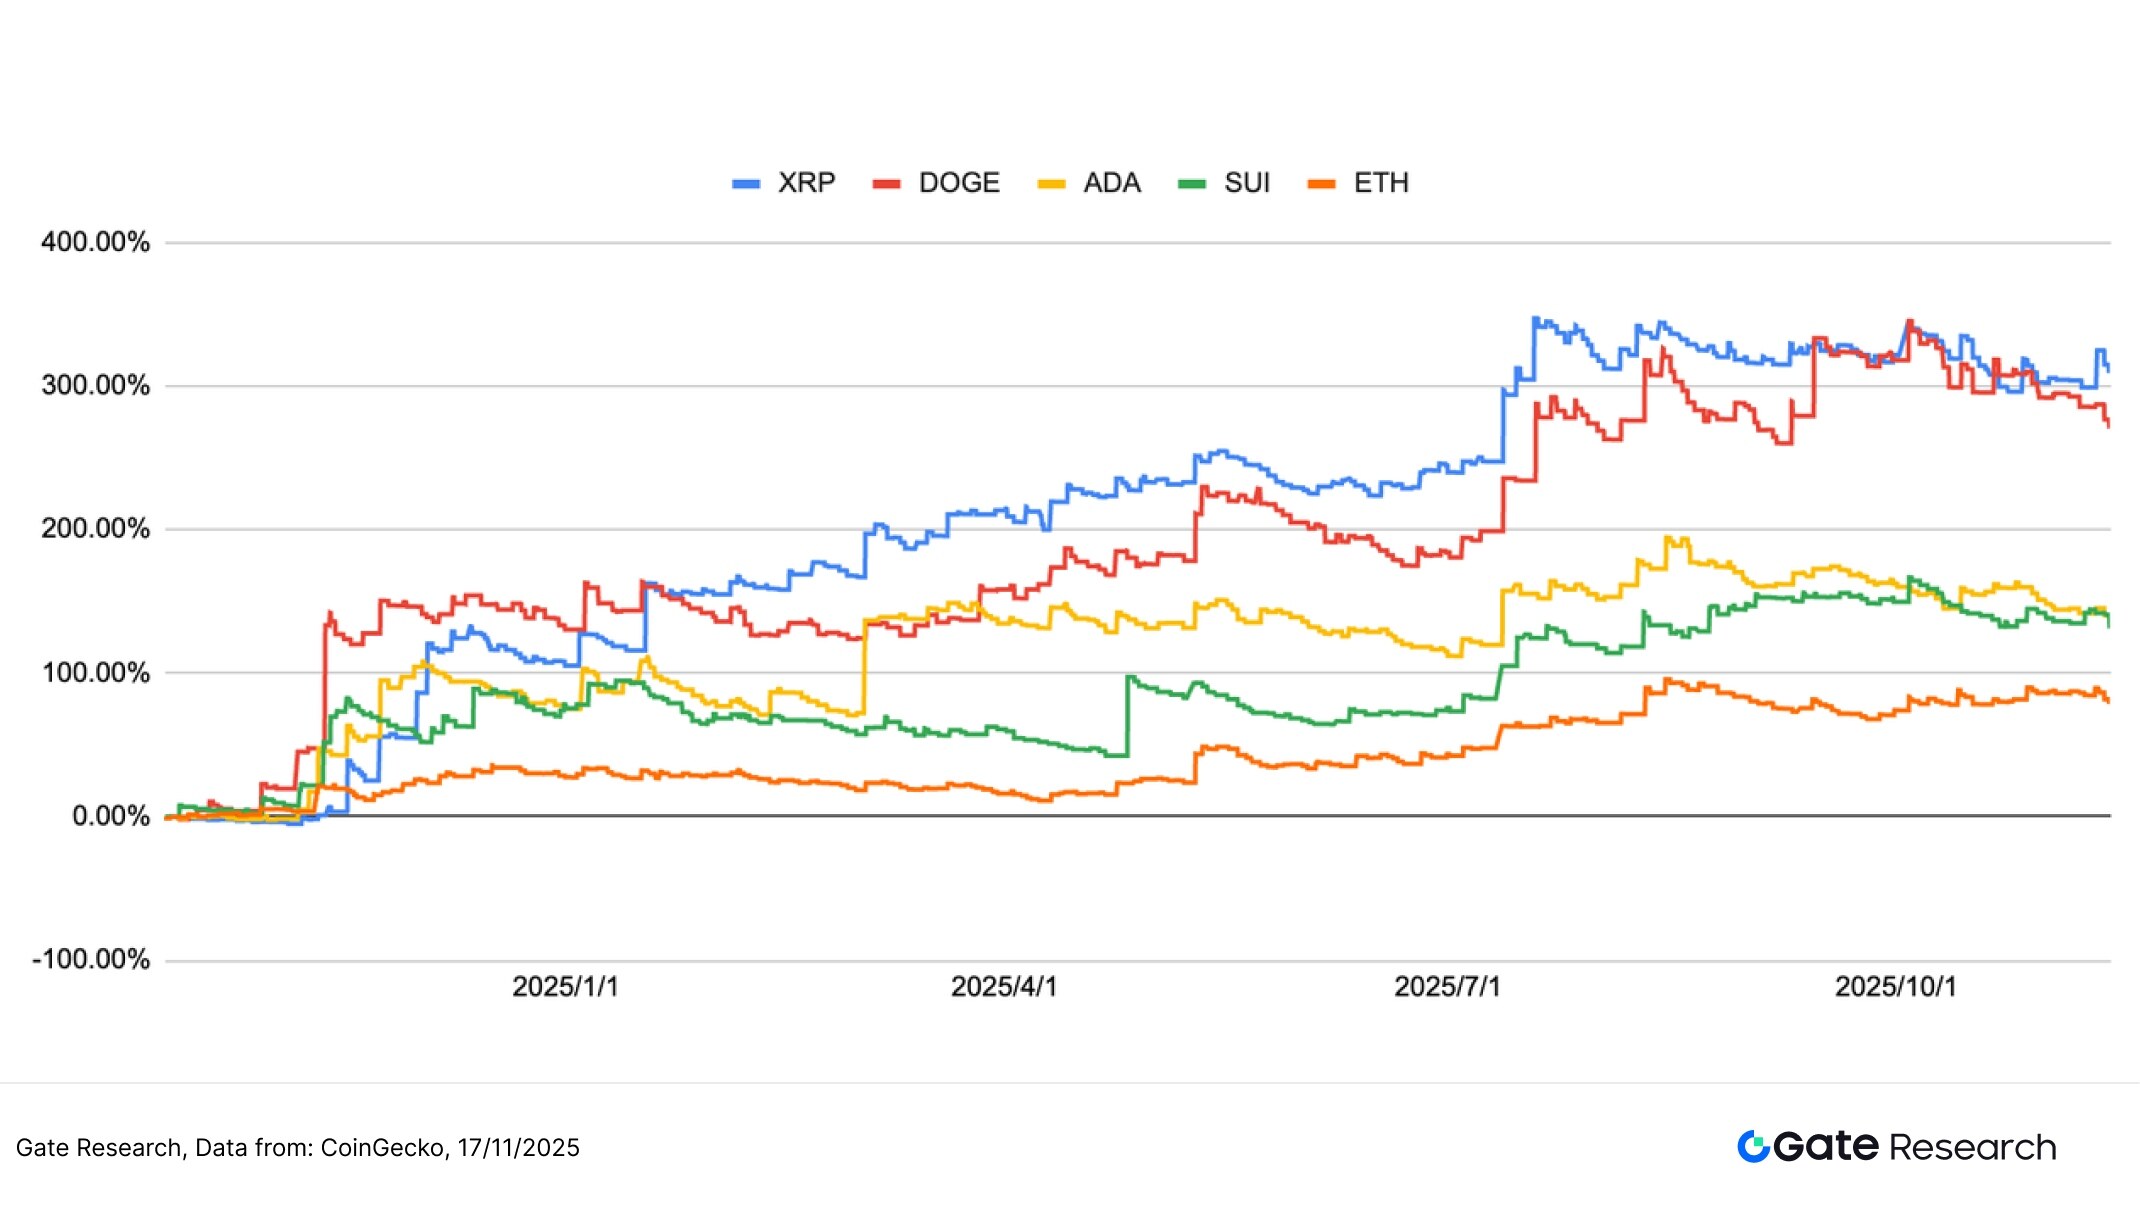
The backtesting period was from October 2024 to November 2025. Based on the cumulative return trend over the past year, the moving average trend breakout strategy showed significant divergence in performance across different mainstream and secondary asset classes, but maintained an overall stable upward structure. The return curves of the five assets in the chart mostly showed a stepped cumulative increase after the strategy triggered a bullish breakout signal. XRP, DOGE, and ADA performed the best, with the highest return rate exceeding 250%–330% at one point, demonstrating the strategy's significant ability to capture gains in strong sectors.
In contrast, while SUI and ETH saw relatively moderate gains, they maintained a steady upward trend overall. Several times, after market pullbacks, they stabilized and accumulated profits again, demonstrating that the moving average trend breakout strategy can maintain a certain trend-following ability across assets with varying volatility characteristics. The curve shows that most assets experience a period of accelerated upward movement after breaking through key moving averages. The strategy, through its dynamic stop-loss mechanism, effectively protects some realized profits during periods of increased volatility, resulting in a smooth overall upward climb in the profit line.
Overall, the strategy demonstrated strong trend-following capabilities and risk control during the period from the end of 2024 to 2025: strong assets amplified trend returns, while more volatile assets maintained a moderate accumulation, making the overall portfolio less susceptible to significant drawdowns due to fluctuations in a single asset. This characteristic complements neutral hedging quantitative strategies (such as the Gate Quantitative Fund); the latter focuses on stable, low-volatility returns, while the moving average trend breakout strategy is more suitable for enhancing the portfolio's excess returns during periods of intensified trend or structural rotation.
5. Summary of Trading Strategies
The moving average trend breakout strategy uses the arrangement and changes of short- and medium-term moving averages as the basis for trend judgment, combined with dynamic stop-loss and take-profit mechanisms, demonstrating robust and diversified returns across a variety of mainstream crypto assets. Performance results over the past year show that XRP, DOGE, and ADA exhibited significant stepped cumulative returns after trend breakouts, with peak gains exceeding 250%–330%, demonstrating the strategy's strong trend-capturing ability. While SUI and ETH saw more moderate gains, they also maintained a steady upward trend overall, reflecting the strategy's ability to maintain stable cumulative returns across assets with varying volatility.
Backtesting results show that the moving average breakout strategy performs particularly well in markets with clear trend structures and significant capital rotation, holding onto profits during multiple market pullbacks and resulting in a smooth upward trend in the cumulative return curve. However, in strong one-sided market conditions, because the strategy relies primarily on moving average confirmation, entry may be slightly delayed or some price increases may not be fully captured, causing the overall return performance to lag slightly behind that of the stronger beta asset strategy.
Based on long-term risk-return considerations, true quantitative asset allocation requires not only excess returns from trend-following strategies but also asset management methods with lower volatility and a stronger emphasis on risk control. For example, the Gate Quantitative Fund uses neutral arbitrage and hedging strategies as its core, enhancing portfolio stability across various market cycles and pursuing long-term compound returns while controlling drawdowns through a rigorous risk control system. Compared to the higher volatility and faster drawdown rebalancing frequency of trend-following strategies, neutral strategies offer a smoother return structure and are more suitable as a stable underlying allocation for an investment portfolio.
Summarize
From November 4th to November 17th, 2025, the cryptocurrency market continued its weak and volatile pattern, with both funding and sentiment weakening. BTC and ETH prices continued to decline with limited rebounds, and volatility repeatedly surged, indicating the market's sensitivity and fragility to key price levels. The long/short ratio fluctuated repeatedly around 1, and funding rates oscillated rapidly around 0, suggesting weak buying interest and a lack of consensus in short-term sentiment.
In terms of contract structure, the open interest of BTC and ETH has remained low since the significant deleveraging at the end of October, with no significant re-entry of funds; the overall leverage ecosystem is in a "wait-and-see" state after deleveraging. Liquidation structures are mainly long liquidations, with limited short liquidations, reflecting that downward pressure has not yet been fully released. Overall, the market is in the later stages of a weak consolidation, with structural clearing of positions and fluctuating sentiment alternating. Without a return of funds or a simultaneous increase in volatility and trading volume, the market should remain wary of further declines or the formation of a new round of liquidation pressure in the short term.
In the current market environment, the moving average trend breakout strategy has demonstrated strong potential in live trading. Backtesting shows that strong assets such as XRP, DOGE, and ADA saw significantly amplified returns after breaking out of their trends, with cumulative gains exceeding 250%–330% at one point. While ETH and SUI were relatively stable, they also maintained a smooth upward trend overall, reflecting the strategy's ability to consistently capture trends across assets with varying volatility levels. In strong one-sided market conditions, the strategy may not fully capture gains due to signal delays or pullback stop-loss orders. In the future, combining volatility filtering, slope factors, and volume indicators could further improve entry accuracy and cycle adaptability.
In contrast, Gate Quantitative Fund focuses on neutral arbitrage and hedging strategies, achieving low drawdowns and stable compounding through diversified allocation and strict risk control. It provides a more balanced quantitative option for investors seeking steady returns and complements trend-following strategies.
References:
1. CoinGecko, https://www.coingecko.com/
2. Gate, https://www.gate.com/trade/BTC_USDT
3. Gate, https://www.gate.com/trade/ETH_USDT
4. Sosovalue, https://sosovalue.com/assets/etf/us-btc-spot?from=moved
5. Coinglass, https://www.coinglass.com/LongShortRatio
6. Coinglass, https://www.coinglass.com/BitcoinOpenInterest?utm_source=chatgpt.com
7. Gate, https://www.gate.com/futures_market_info/BTC_USD/capital_rate_history
8. Gate, https://www.gate.com/futures/introduction/funding-rate-history?from=USDT-M&contract=ETH_USDT
9. Coinglass, https://www.coinglass.com/pro/futures/Liquidations
10. Gate, https://www.gate.com/institution/quant-fund
Gate Research is a comprehensive blockchain and cryptocurrency research platform that provides readers with in-depth content, including technical analysis, insights into hot topics, market reviews, industry research, trend forecasts, and macroeconomic policy analysis.
Disclaimer
Investing in the cryptocurrency market involves high risks. Users are advised to conduct independent research and fully understand the nature of any assets and products they intend to purchase before making any investment decisions. Gate assumes no responsibility for any loss or damage arising from such investment decisions.


