
Gate Research: BTC rebounds and stabilizes from lows, small and mid-cap themes heat up, privacy and AI sectors become the focus of investment.
- 核心观点:加密市场结构性调整,资金转向高叙事板块。
- 关键要素:
- BTC触底反弹,ETH遇阻回落。
- 稳定币供应创新高,达3015亿美元。
- 隐私与AI代币领涨,RAIL涨超125%。
- 市场影响:推动资金聚焦合规资产与高性能基础设施。
- 时效性标注:中期影响
Cryptocurrency Market Overview
According to CoinGecko data, from October 7th to October 20th, 2025, the crypto market exhibited characteristics of structural adjustment and accelerated infrastructure integration amidst sharp fluctuations. In terms of price action, BTC bottomed out at $102,100 on October 11th and then stabilized, exhibiting an overall pattern of "low-level consolidation and short-term rebound"; ETH rebounded from a low of approximately $3,680 on October 13th to above $3,980 before encountering resistance. [1]
At the ecosystem level, Ethereum added 16,181 new developers, continuing to hold the top spot in the Web3 ecosystem, followed by Solana and Bitcoin. Developers continue to concentrate on public chains with high compatibility and scalability. Macroeconomic risk aversion drove the market capitalization of tokenized gold to $3.28 billion, while stablecoins played a crucial role in providing liquidity support during market volatility. Tether and Circle issued approximately $74 billion in new tokens during the same period, bringing the total global stablecoin supply to over $301.5 billion, a record high.
In the DeFi sector, JustLend DAO's TVL rose to $7.82 billion, and Aave's stablecoin RLUSD reached a supply of 448 million, indicating an accelerated return of funds to leading protocols. The Starknet ecosystem saw a significant recovery, surpassing 3 million blocks and exceeding 600 million STRK in staking. It also launched a Bitcoin staking and institutional incentive program centered on "BTCFi," driving both TVL and stablecoin sizes to new highs. The prediction market sector continued to heat up, with Polymarket receiving $2 billion in investment from ICE and launching a stock "rise/fall" prediction market, surpassing 56,000 active wallets. Kalshi, in partnership with Robinhood, saw a record-breaking trading volume of $1.44 billion.
Meanwhile, Taiwanese company OwlTing listed on Nasdaq, and asset management giant Amundi launched a crypto ETF, indicating that the institutionalization process continues to accelerate. Overall, the market's risk exposure has significantly narrowed after deleveraging, and safe-haven funds remain active in the market. The focus of funds and narratives is gradually shifting towards the medium- to long-term theme of "high-performance infrastructure + compliant assetization," with BTCFi and prediction markets becoming the core focus of a new round of structural capital flows and market consensus.
A panoramic view of the price fluctuation data in this round.
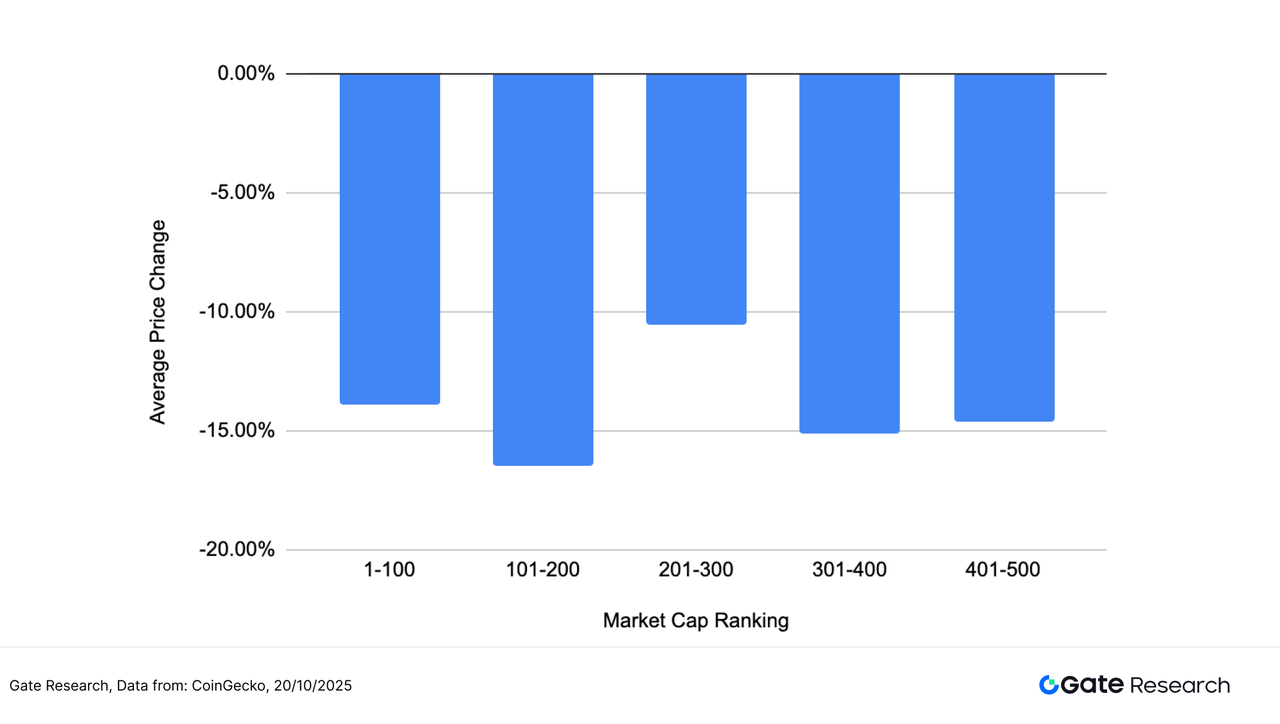
This article groups and analyzes the top 500 tokens by market capitalization, observing their average increase from October 7th to October 20th.
The overall average decline was -14.13%, indicating that the market is still in a correction phase after continuous pullbacks. Significant differences in performance exist between different market capitalization ranges, structurally exhibiting a pattern of "relative resilience in the middle range and deeper declines at the extremes." Among them, tokens ranked 201-300 by market capitalization saw the smallest decline, at only -10.51%, demonstrating the relative resilience of mid-sized assets in volatile markets. In contrast, the 101-200 range experienced the weakest decline, at -16.48%. Top-ranked assets (ranked 1-100) saw an average decline of -13.92%, while those in the mid-to-lower tiers (ranked 301-400 and 401-500) declined by -15.12% and -14.63% respectively, indicating that funds have not been significantly concentrated in specific tiers, and the overall market remains characterized by high volatility and cautious trading.
Overall, the market continued its consolidation pattern following deleveraging. Mid-cap tokens showed relative resilience, while top- and bottom-cap assets experienced deeper corrections due to greater volatility in liquidity and risk aversion. The market capitalization structure exhibited a phase of investor caution and sector differentiation, reflecting the market's awaiting new liquidity catalysts and macroeconomic signals.
Note: Market capitalization distribution is based on CoinGecko data. The top 500 tokens by market capitalization are grouped into groups of 100 (e.g., 1-100, 101-200, etc.). The price changes of tokens within each group from October 7th to October 20th, 2025 are calculated, and the average of each group is used as the average increase indicator for that market capitalization range. The overall average decrease (14.13%) is the average of the individual increases of the top 500 tokens by market capitalization, unweighted.
Figure 1: The overall average decline was -14.13%, with tokens ranked 201-300 by market capitalization showing relatively strong performance, declining by approximately -10.51%.
Top Gainers and Losers List
Over the past two weeks (October 7 to October 20), the crypto market has experienced significant volatility, with funds continuously rotating between different narrative sectors, leading to sharp rises and falls in individual tokens.
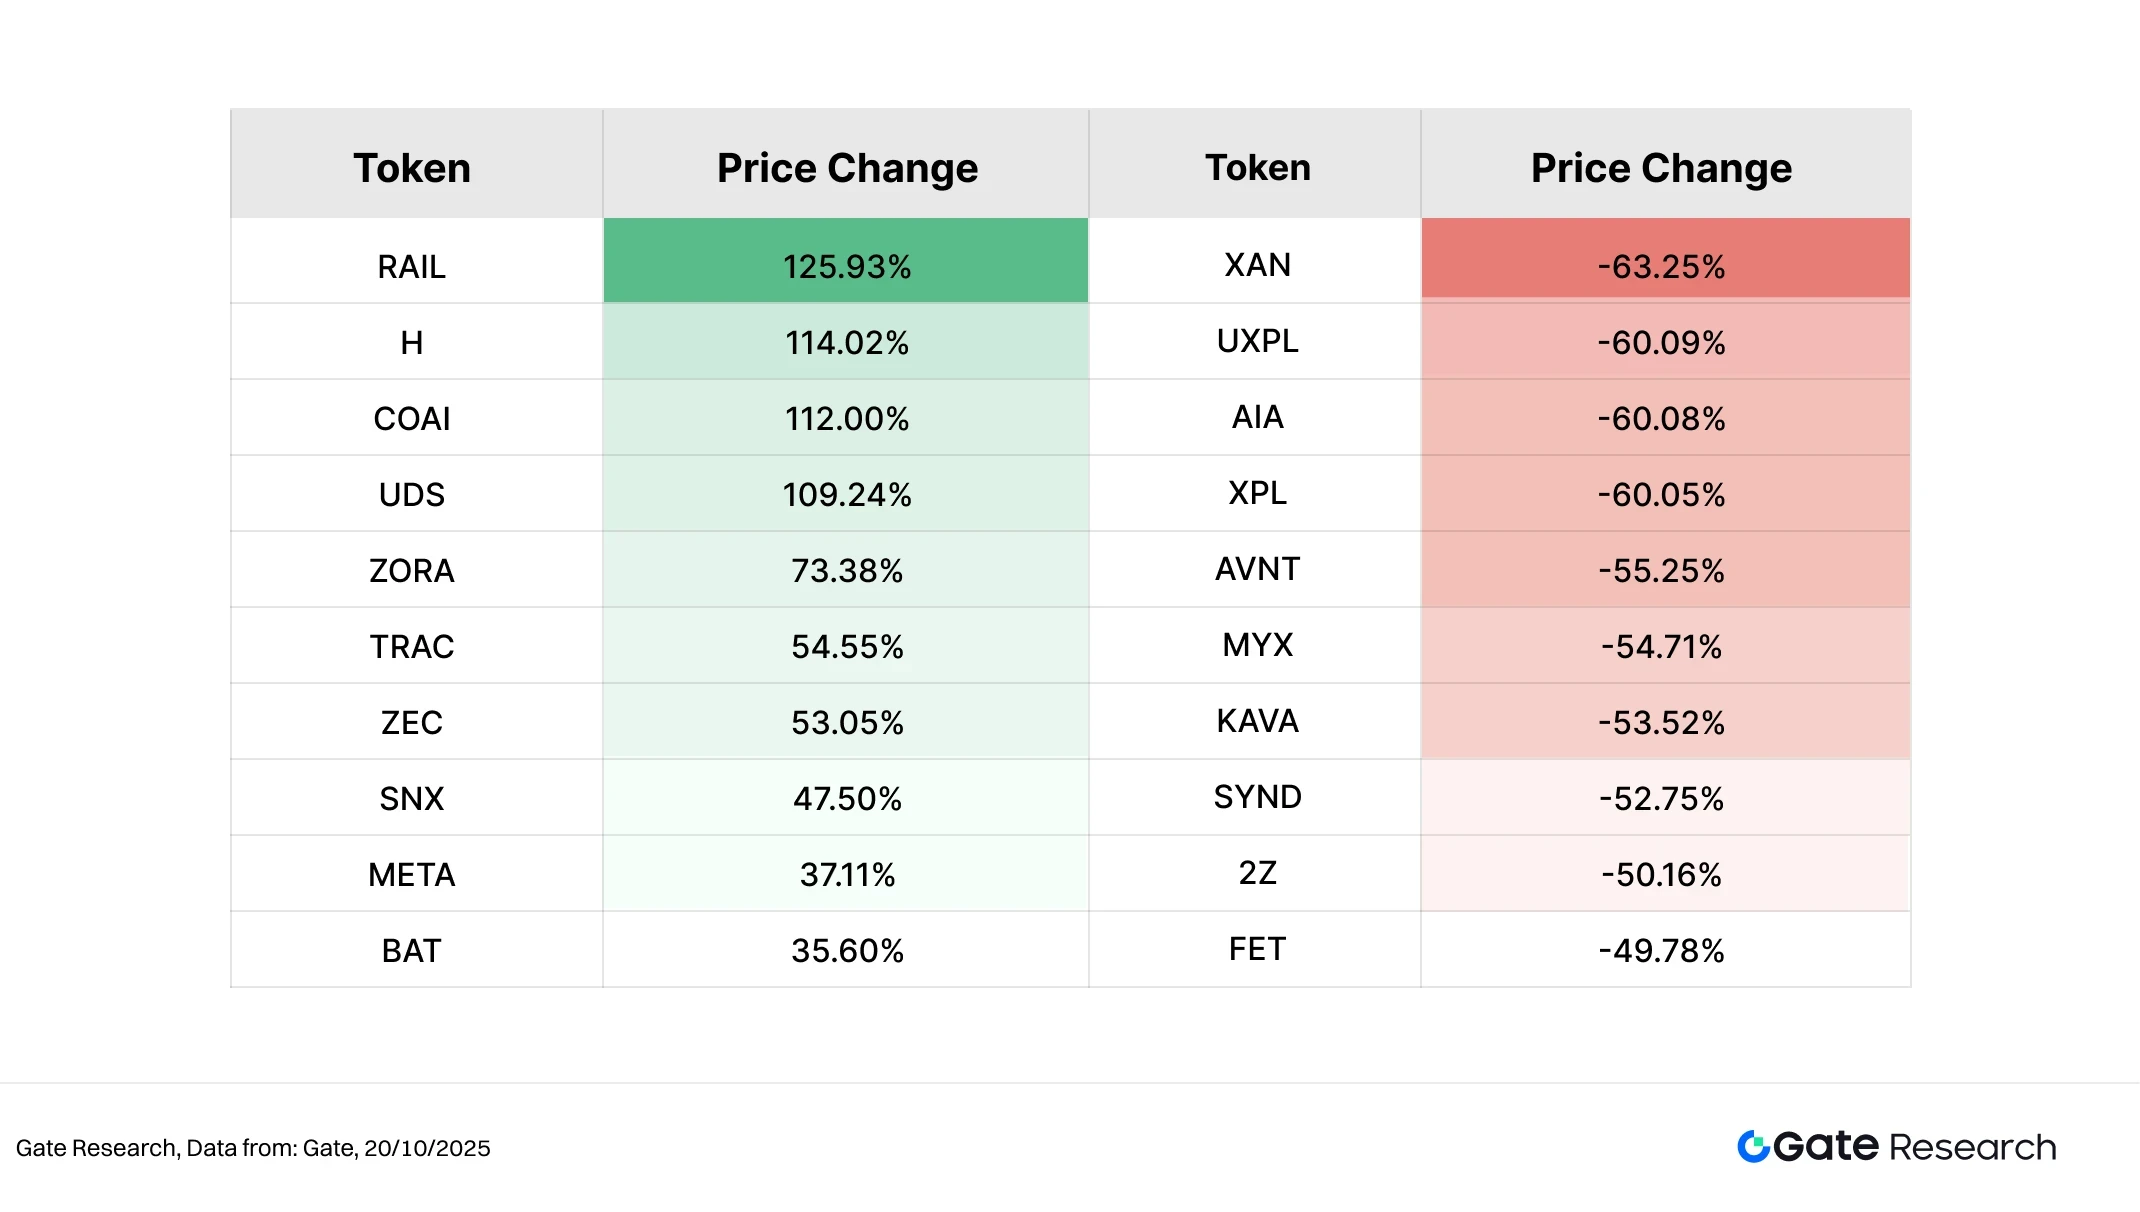
Top Gainers: Privacy Narrative Makes a Comeback, RAIL Leads the Rally
RAIL, the native token of the decentralized privacy protocol Railgun, has surged over 125% in the past two weeks. Railgun focuses on privacy transaction solutions centered on zero-knowledge proofs (ZK-SNARKs), allowing users to conduct completely private transfers and transactions on Ethereum and its compatible chains. In mid-October, the official team announced that its total privacy transaction volume had exceeded $4 billion (of which $1.6 billion is projected for 2025) and confirmed that it would host the Privacy & Compliance Summit 2025 on November 19, sparking strong market expectations for a resurgence of the privacy narrative. With intensifying discussions on regulatory compliance and accelerated capital inflows into the privacy sector, RAIL has become a leading representative of the privacy-focused sector.
In addition, H (+114.02%) and COAI (+112.00%) followed closely behind. The former benefited from the expansion of the on-chain game ecosystem, while the latter attracted capital attention with its AI + data computing concept, reflecting the capital preference for small and medium-sized projects with strong narratives.
On the list of biggest losers: XAN led the decline, with capital inflows and short-term profit-taking weighing on its price action.
In contrast, XAN (-63.25%) saw the most significant decline on the list of tokens with the largest drops. This token had previously experienced a rapid rise, but lacked sustained catalysts and trading volume support, leading to a gradual return of funds to mainstream assets and a noticeable price decline from its highs. As market risk aversion intensified and short-term profit-taking increased, XAN became the token with the largest pullback this period. Other tokens such as UXPL (-60.09%), AIA (-60.08%), and XPL (-60.05%) also experienced significant declines, largely due to excessive gains in the previous period and a decrease in market enthusiasm.
Overall, this market trend exhibited a structural characteristic of "privacy narratives and AI ecosystems advancing in tandem, while overheated themes experienced a correction." Privacy-related projects gained favor with investors due to discussions about compliance frameworks and increased on-chain transaction volume, while short-term speculative targets were quickly cleared out amidst volatility. Going forward, the market focus will likely continue to revolve around the long-term themes of "privacy compliance" and "the integration of AI applications."
Figure 2: RAIL rose 125.93%, benefiting from the resurgence of privacy narratives and expectations for the November privacy compliance summit.
Relationship between market capitalization ranking and price change
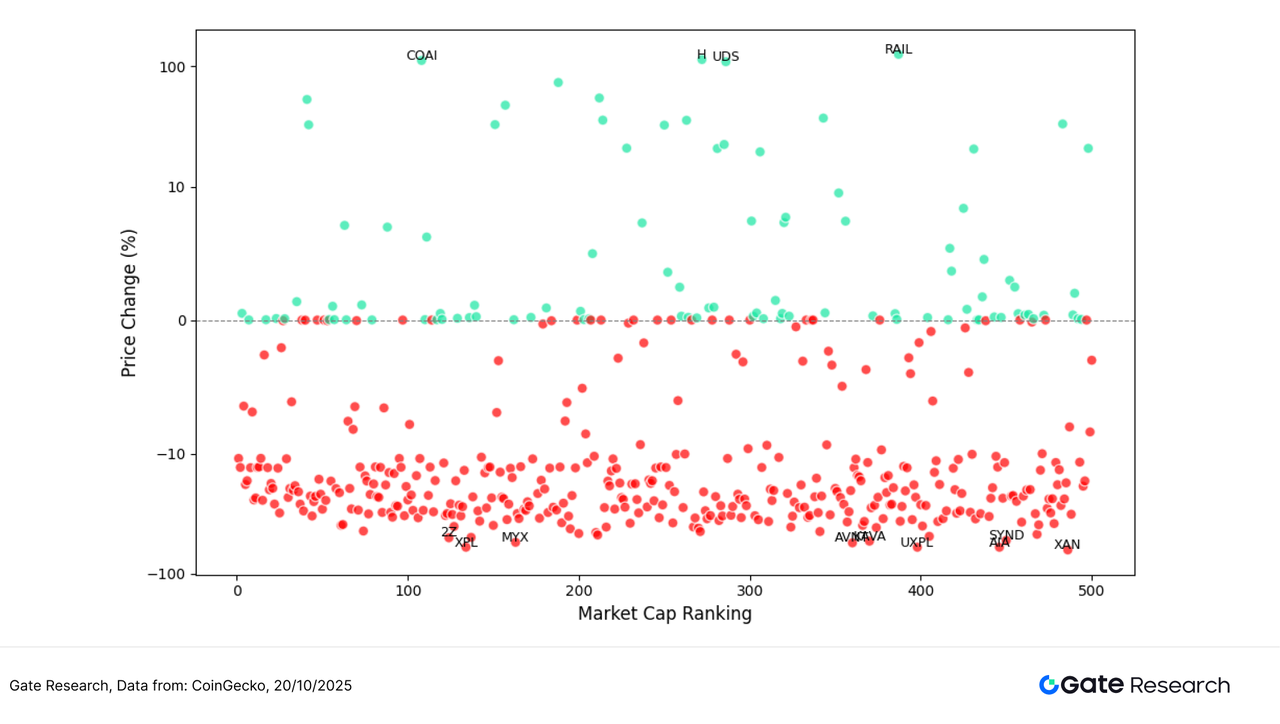
To observe the structural characteristics of token performance in this round of market activity, this article presents a scatter plot of the top 500 tokens by market capitalization. The horizontal axis represents market capitalization ranking (the further left, the larger the market capitalization), and the vertical axis represents the price change from October 7th to October 20th. Each dot in the plot represents a token, with green indicating an increase and red indicating a decrease.
From an overall distribution perspective, the number of declining tokens significantly exceeded the number of rising tokens, indicating that the market is still in a correction phase. Most tokens saw declines concentrated in the -10% to -20% range, while stocks with gains exceeding 50% were relatively rare and mostly located in the mid-to-late market capitalization range, reflecting that market funds are concentrated in more volatile small- and mid-cap assets.
Among the top gainers, RAIL (+125.93%), H (+114.02%), and COAI (+112.00%) performed the best. RAIL benefited from the growing emphasis on privacy and expectations surrounding the "Privacy & Compliance Summit 2025," becoming the leading stock in the privacy sector; H and COAI gained market favor due to their AI and innovative application concepts.
In contrast, tokens that experienced larger declines were mostly those from projects that had been overhyped or had low liquidity, including XAN (-63.25%), UXPL (-60.09%), and AIA (-60.08%), which generally saw profit-taking and capital withdrawal after a short-term surge.
Overall, market sentiment remains cautious, with funds favoring short-term speculation and thematic rotation. Small and mid-cap stocks exhibit particularly pronounced volatility and risk. Mainstream assets remain relatively stable, with a clear structural market trend.
Figure 3: Among the top 500 tokens by market capitalization, the number of declining tokens dominates, while the few projects with outstanding gains are mainly concentrated in the mid-to-late market capitalization range, indicating that funds prefer assets with high elasticity and strong narratives.
Top 100 Market Value Ranking
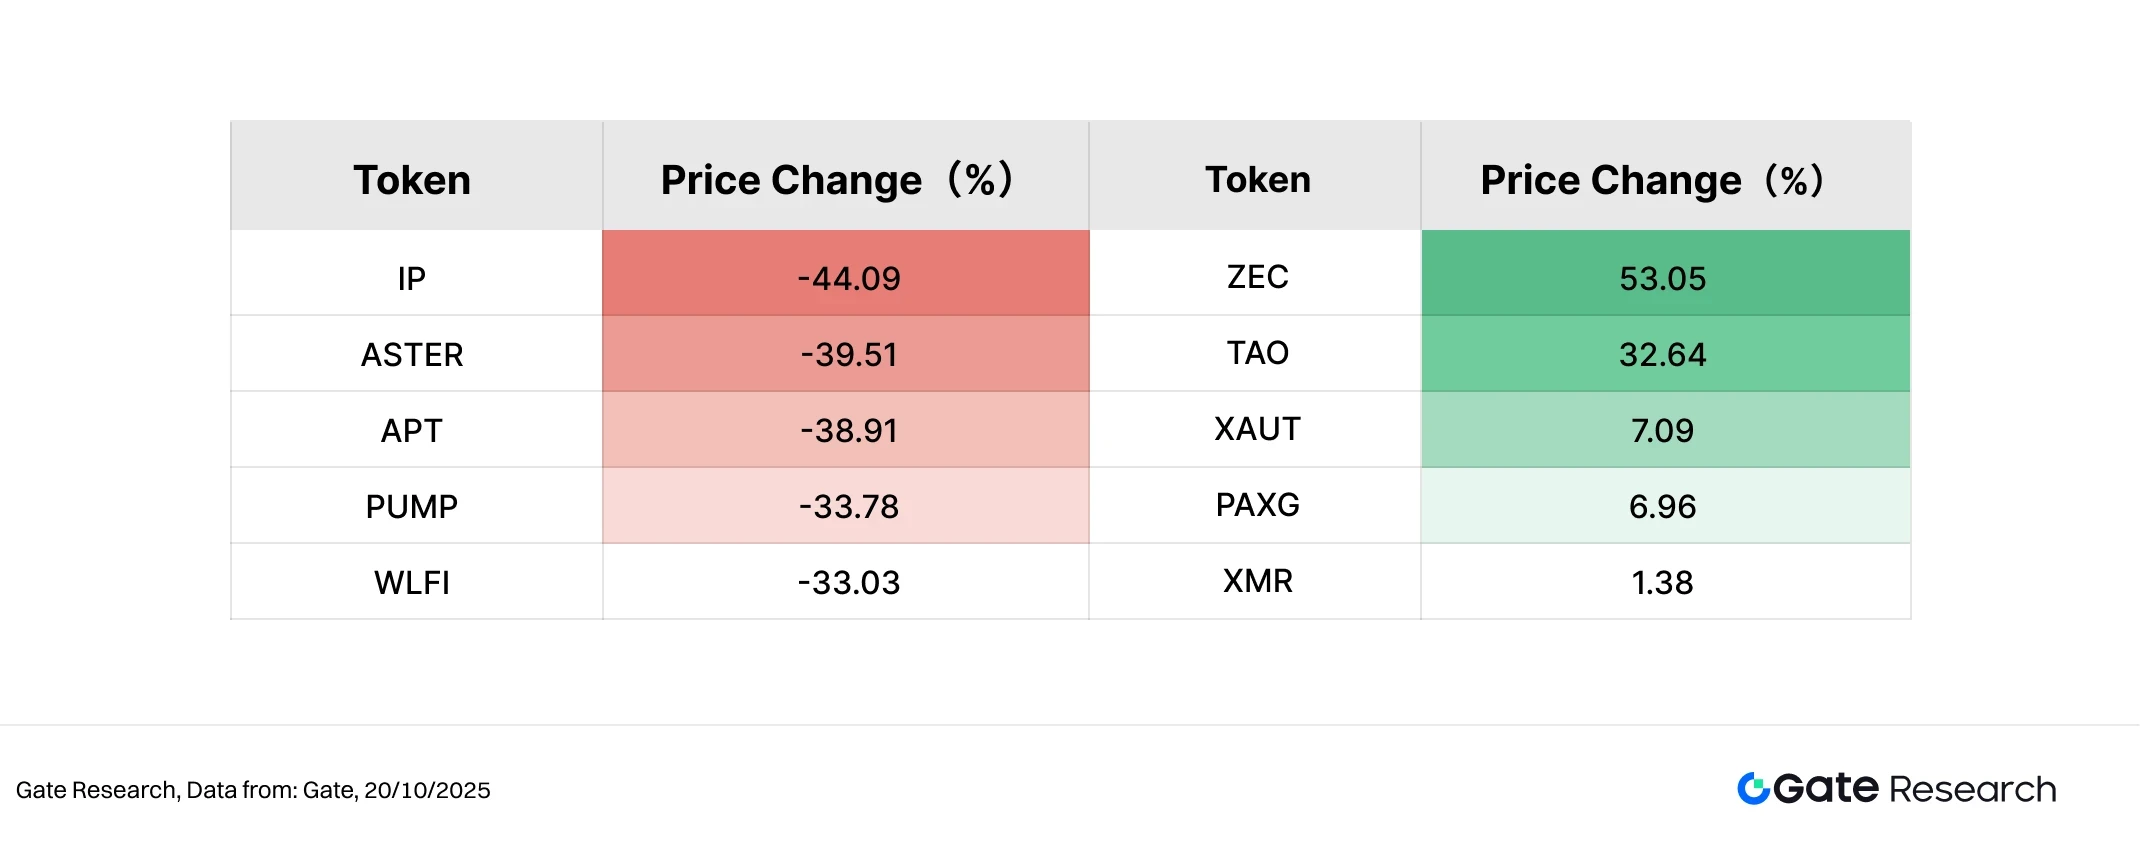
In this volatile market, the performance of the top 100 tokens by market capitalization showed significant divergence. While mainstream assets generally remained stable, some projects with compelling narratives or safe-haven appeal stood out. Among the top five gainers, ZEC (+53.05%) led the gains, driven by the recovery in the privacy sector and increased market attention to decentralized privacy protocols. As a representative project of decentralized AI networks, it continued its high popularity. PAXG (+6.96%) and XAUT (+7.09%) were driven by rising gold prices and increased safe-haven sentiment, becoming representatives of stable returns. XMR (+1.38%) maintained a slight upward trend thanks to its privacy narrative. Overall, the top-performing projects were mostly concentrated on two main themes: "privacy + anchoring to real-world assets."
In contrast, some popular projects on the decliners list experienced significant pullbacks. IP (-44.09%) saw the largest drop, mainly due to the waning hype and capital outflows. ASTER (-39.51%) and APT (-38.91%) both saw significant adjustments, indicating weakening momentum in the mainstream public chain sector. PUMP (-33.78%) and WLFI (-33.03%) were dragged down by the retreat of community speculation, putting pressure on their short-term performance. Overall, among the top 100 tokens, funds favored assets with safe-haven appeal and long-term narratives, while high-beta projects and meme-based tokens saw significantly increased volatility.
Figure 4: Among the top 100 tokens by market capitalization, ZEC and TAO led the gains, while PAXG and XAUT rose slightly, supported by risk aversion; IP, ASTER, and APT saw the largest declines, reflecting a temporary drop in market risk appetite.
Analysis of this round of increased trading volume
Analysis of transaction volume growth
Beyond price performance, this article further analyzes the changes in trading volume for some tokens to observe market activity and the level of capital participation. Using the trading volume before the price surge as a benchmark, the growth rate is calculated and compared with the price rebound during the same period to assess market attention and short-term capital flows.
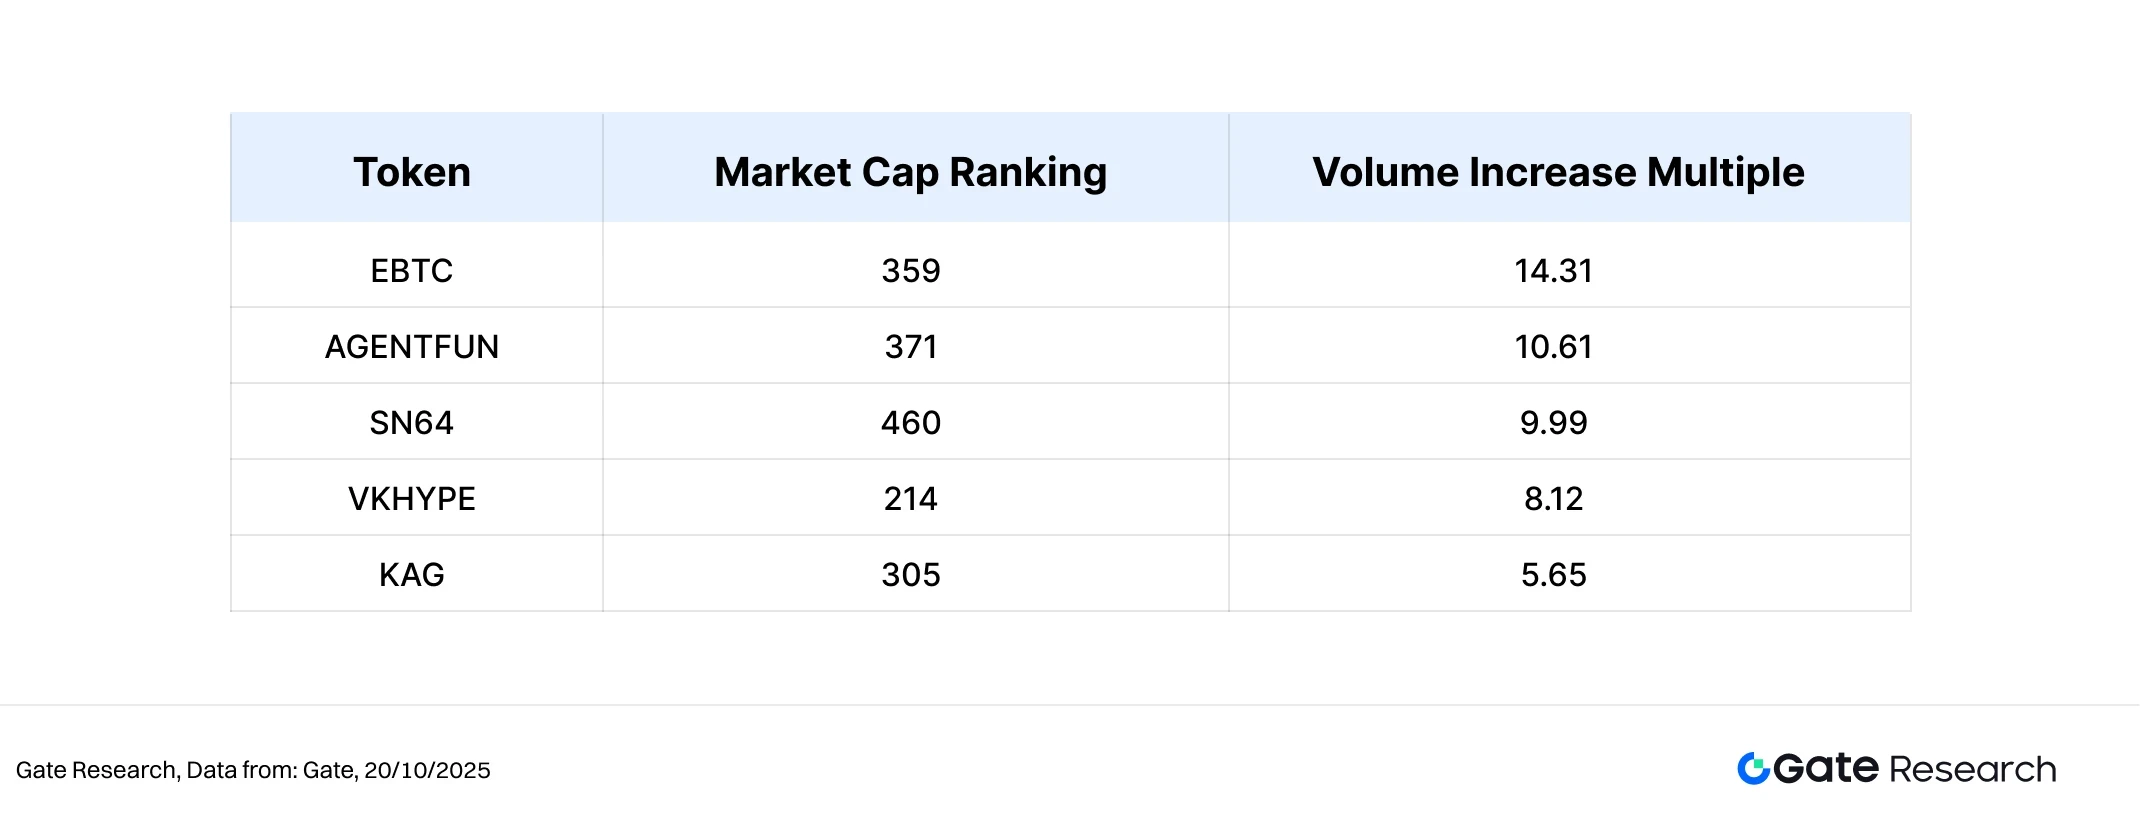
Data shows that EBTC, AGENTFUN, SN64, VKHYPE, and KAG were the five projects with the most significant increases in trading volume this period. Among them, EBTC's trading volume increased by 14.31 times. Although the price still fell by -9.72%, the increase in volume indicates a significant warming of market sentiment and active short-term trading. AGENTFUN also recorded a 10.61-fold increase in volume, but the price fell by -27.52%, indicating that funds were concentrated on short-term speculation and lacked sustained support.
In comparison, SN64 performed the best, with trading volume increasing 9.99 times and price rebounding 33.18% simultaneously, showing a typical "volume-price resonance" structure, indicating that it has gained strong market consensus and is driven by sentiment; KAG also saw a slight rebound of 7.30% while trading volume increased 5.65 times, with capital inflows stabilizing; VKHYPE saw a volume increase of 8.12 times, but the price still fell by -17.57%, indicating that capital quickly retreated after a brief period of participation.
Overall, the projects with increased trading volume this period were mostly concentrated in the low to mid-market capitalization range, indicating a significant increase in market activity. However, price performance varied, reflecting that the market is still in a phase of short-term rotation and sentiment-driven trading. While a sustained increase in trading volume does not necessarily lead to a synchronized rise, it often foreshadows potential investor interest and opportunities for thematic development.
Figure 5: EBTC, AGENTFUN, SN64, and other tokens saw a significant increase in trading volume during this period. Among them, SN64 achieved a resonance between volume and price, becoming a representative project attracting attention from investors in the mid-to-late stage of market capitalization.
Trading volume changes and price analysis
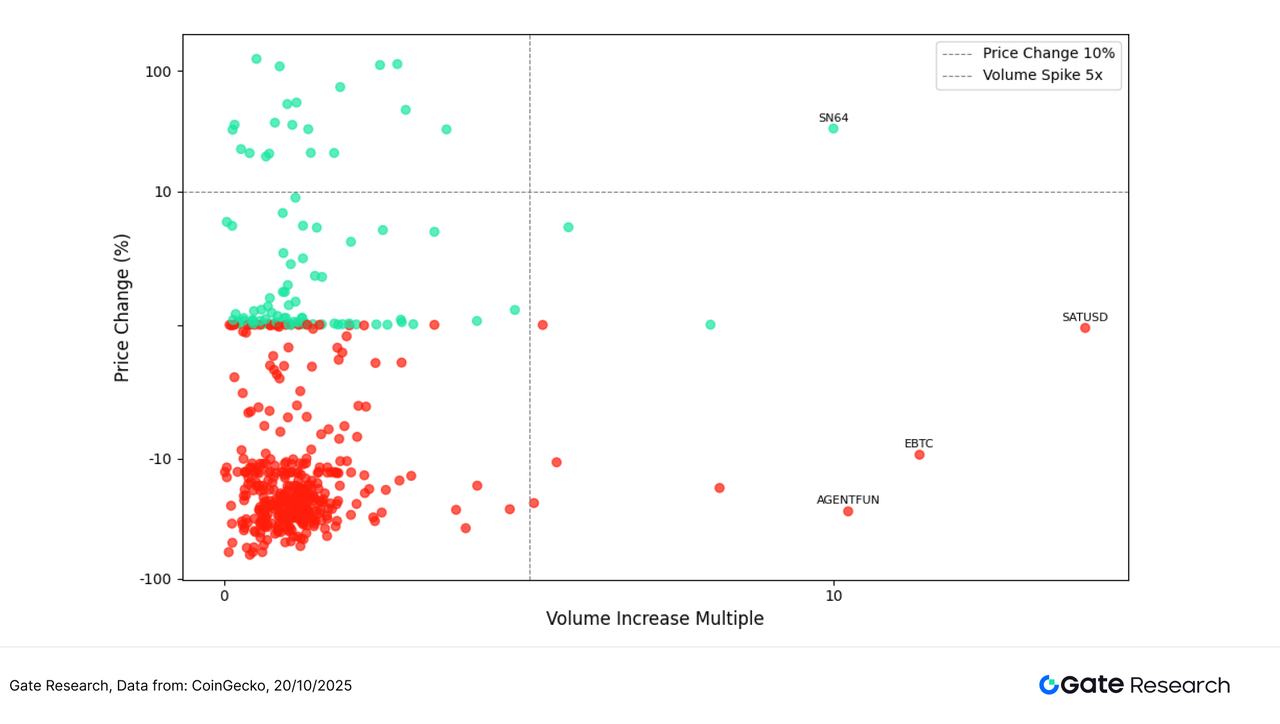
Building upon our observations of projects exhibiting unusual trading volume, this article further incorporates price performance to create a scatter plot of volume increase multiple and price change percentage. The horizontal axis represents the multiple by which the token's trading volume has increased over the past two weeks compared to the baseline period, while the vertical axis represents the percentage change in price during the same period. A symmetrical logarithmic coordinate axis is used to clearly illustrate the structural relationship between "volume increase" and "price change".
As shown in the chart, the upper right quadrant is home to core stocks with significantly increased trading volume and rising prices, representing the main focus of funds during the market's structural rotation. Among them, SN64 stands out, with trading volume increasing nearly tenfold and prices rising by over 30%. This is likely due to the news that Chutes AI has become the largest open-source inference service provider on OpenRouter, drawing significant market attention to its ecosystem narrative and creating a volume-price resonance structure driven by the popularity of "AI + decentralized inference".
In contrast, although EBTC and AGENTFUN saw trading volumes increase by 14.31 times and 10.61 times respectively, their prices still fell by -9.72% and -27.52%, indicating that the increase in trading volume failed to drive a price reversal, and the market was dominated by short-term trading. SATUSD also recorded high trading volume but weak price performance, reflecting that some funds were concentrated on arbitrage or short-term hedging operations.
Overall, projects in the upper right quadrant generally possess clear information catalysts, strong community support, and good liquidity, making them key targets for concentrated capital rotation in this round of market activity. In contrast, the lower right quadrant reflects a pattern of "high volume but no price increase," indicating insufficient willingness among investors to follow the trend. The market as a whole remains in a phase of competition driven primarily by events and the popularity of specific themes.
Figure 6: SN64 is located in the upper right quadrant, forming a significant volume-driven upward structure stimulated by AI infrastructure narratives and ecosystem news; although EBTC and AGENTFUN showed significant volume increases, their prices failed to rebound in tandem.
Correlation analysis
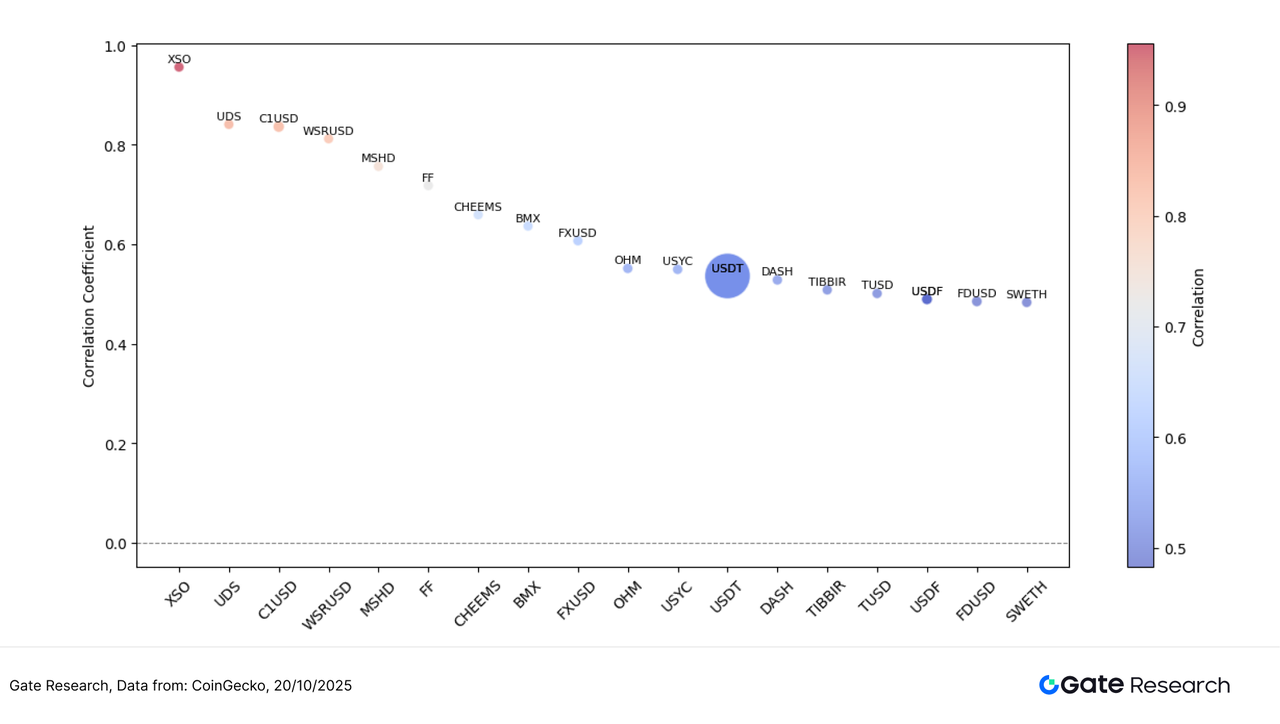
After exploring the correlation between trading volume and price performance, this paper further analyzes the systematic correlation between the two from a statistical perspective. To measure the impact of capital activity on price fluctuations, the "trading volume growth rate / market capitalization" is used as a relative activity indicator, and its correlation coefficient with price fluctuations is calculated to identify the token types most susceptible to capital-driven fluctuations in the current market.
As shown in the chart, the correlation coefficients of most tokens are concentrated in the range of 0.7–0.9, exhibiting a strong positive correlation overall, indicating a general linkage between increased trading volume and price fluctuations. The color of the bubbles represents the strength of the correlation (higher red, lower blue), while the size of the bubbles reflects the market capitalization of the tokens.
Among them, XSO, UDS and C1 USD have the highest correlation coefficients, close to 0.9–1.0, indicating that these small and medium-sized market capitalization assets are very likely to trigger synchronous price fluctuations when trading volume increases, and are typical highly elastic “volume-price linkage” tokens; in contrast, stablecoin assets such as USDT, TUSD and FDUSD have relatively low correlations (about 0.7–0.75), mainly due to their price anchoring characteristics which result in limited volatility, but they still show structural influence in the liquidity cycle.
Overall, the market exhibits a clear "correlation stratification" structure: small and mid-cap tokens show strong price-volatility correlation and high volatility, while large-cap or stablecoin assets show low correlation and stable performance. This characteristic reflects that funds prefer highly volatile assets for short-term trading, while stablecoins and mainstream assets primarily serve as liquidity and hedging tools.
Figure 7: Trading volume and price fluctuations of small- and mid-cap tokens such as XSO and UDS show the highest correlation, exhibiting a strong volume-price linkage; stablecoins such as USDT, TUSD, and FDUSD show a lower correlation, reflecting a more robust market structure.
The current crypto market continues its structural rotation pattern, with market sentiment gradually recovering amidst fluctuations, and the correlation between volume and price significantly strengthened. Smaller-cap tokens such as RAIL, COAI, and H have rebounded strongly due to narrative catalysts and increased trading volume, becoming the focus of short-term speculation. SN64, on the other hand, has attracted investment due to Chutes AI's ranking as an open-source inference service provider on OpenRouter, showing a clear resonance between volume and price. In contrast, while EBTC and AGENTFUN recorded significant increases in volume, their price performance was weak, indicating increasingly concentrated fund flows.
In addition to trading data, several potential airdrop projects are ongoing, covering popular areas such as AI modular chains, Web3 community incentives, stablecoin deposits, and decentralized node networks. By keeping abreast of the pace and actively participating, users can potentially gain a competitive edge in a volatile market and secure token incentives and airdrop eligibility. The following section outlines four noteworthy projects and participation methods to help users systematically capitalize on Web3 opportunities.
Airdrop Hot Projects
This article compiles a list of key airdrop potential projects to watch between October 7th and October 20th, 2025, covering several early-stage projects such as OpenSea (the world's largest NFT trading platform), Momentum DEX (a decentralized trading platform deployed on the Sui network), Gopher (a decentralized AI data infrastructure based on the Cosmos ecosystem), and Fraction AI (a Web3 platform combining artificial intelligence and NFT creation). Users can accumulate participation records by connecting their wallets, completing tasks, engaging in interactive transactions, and staking operations to gain eligibility for subsequent airdrops or token allocations.
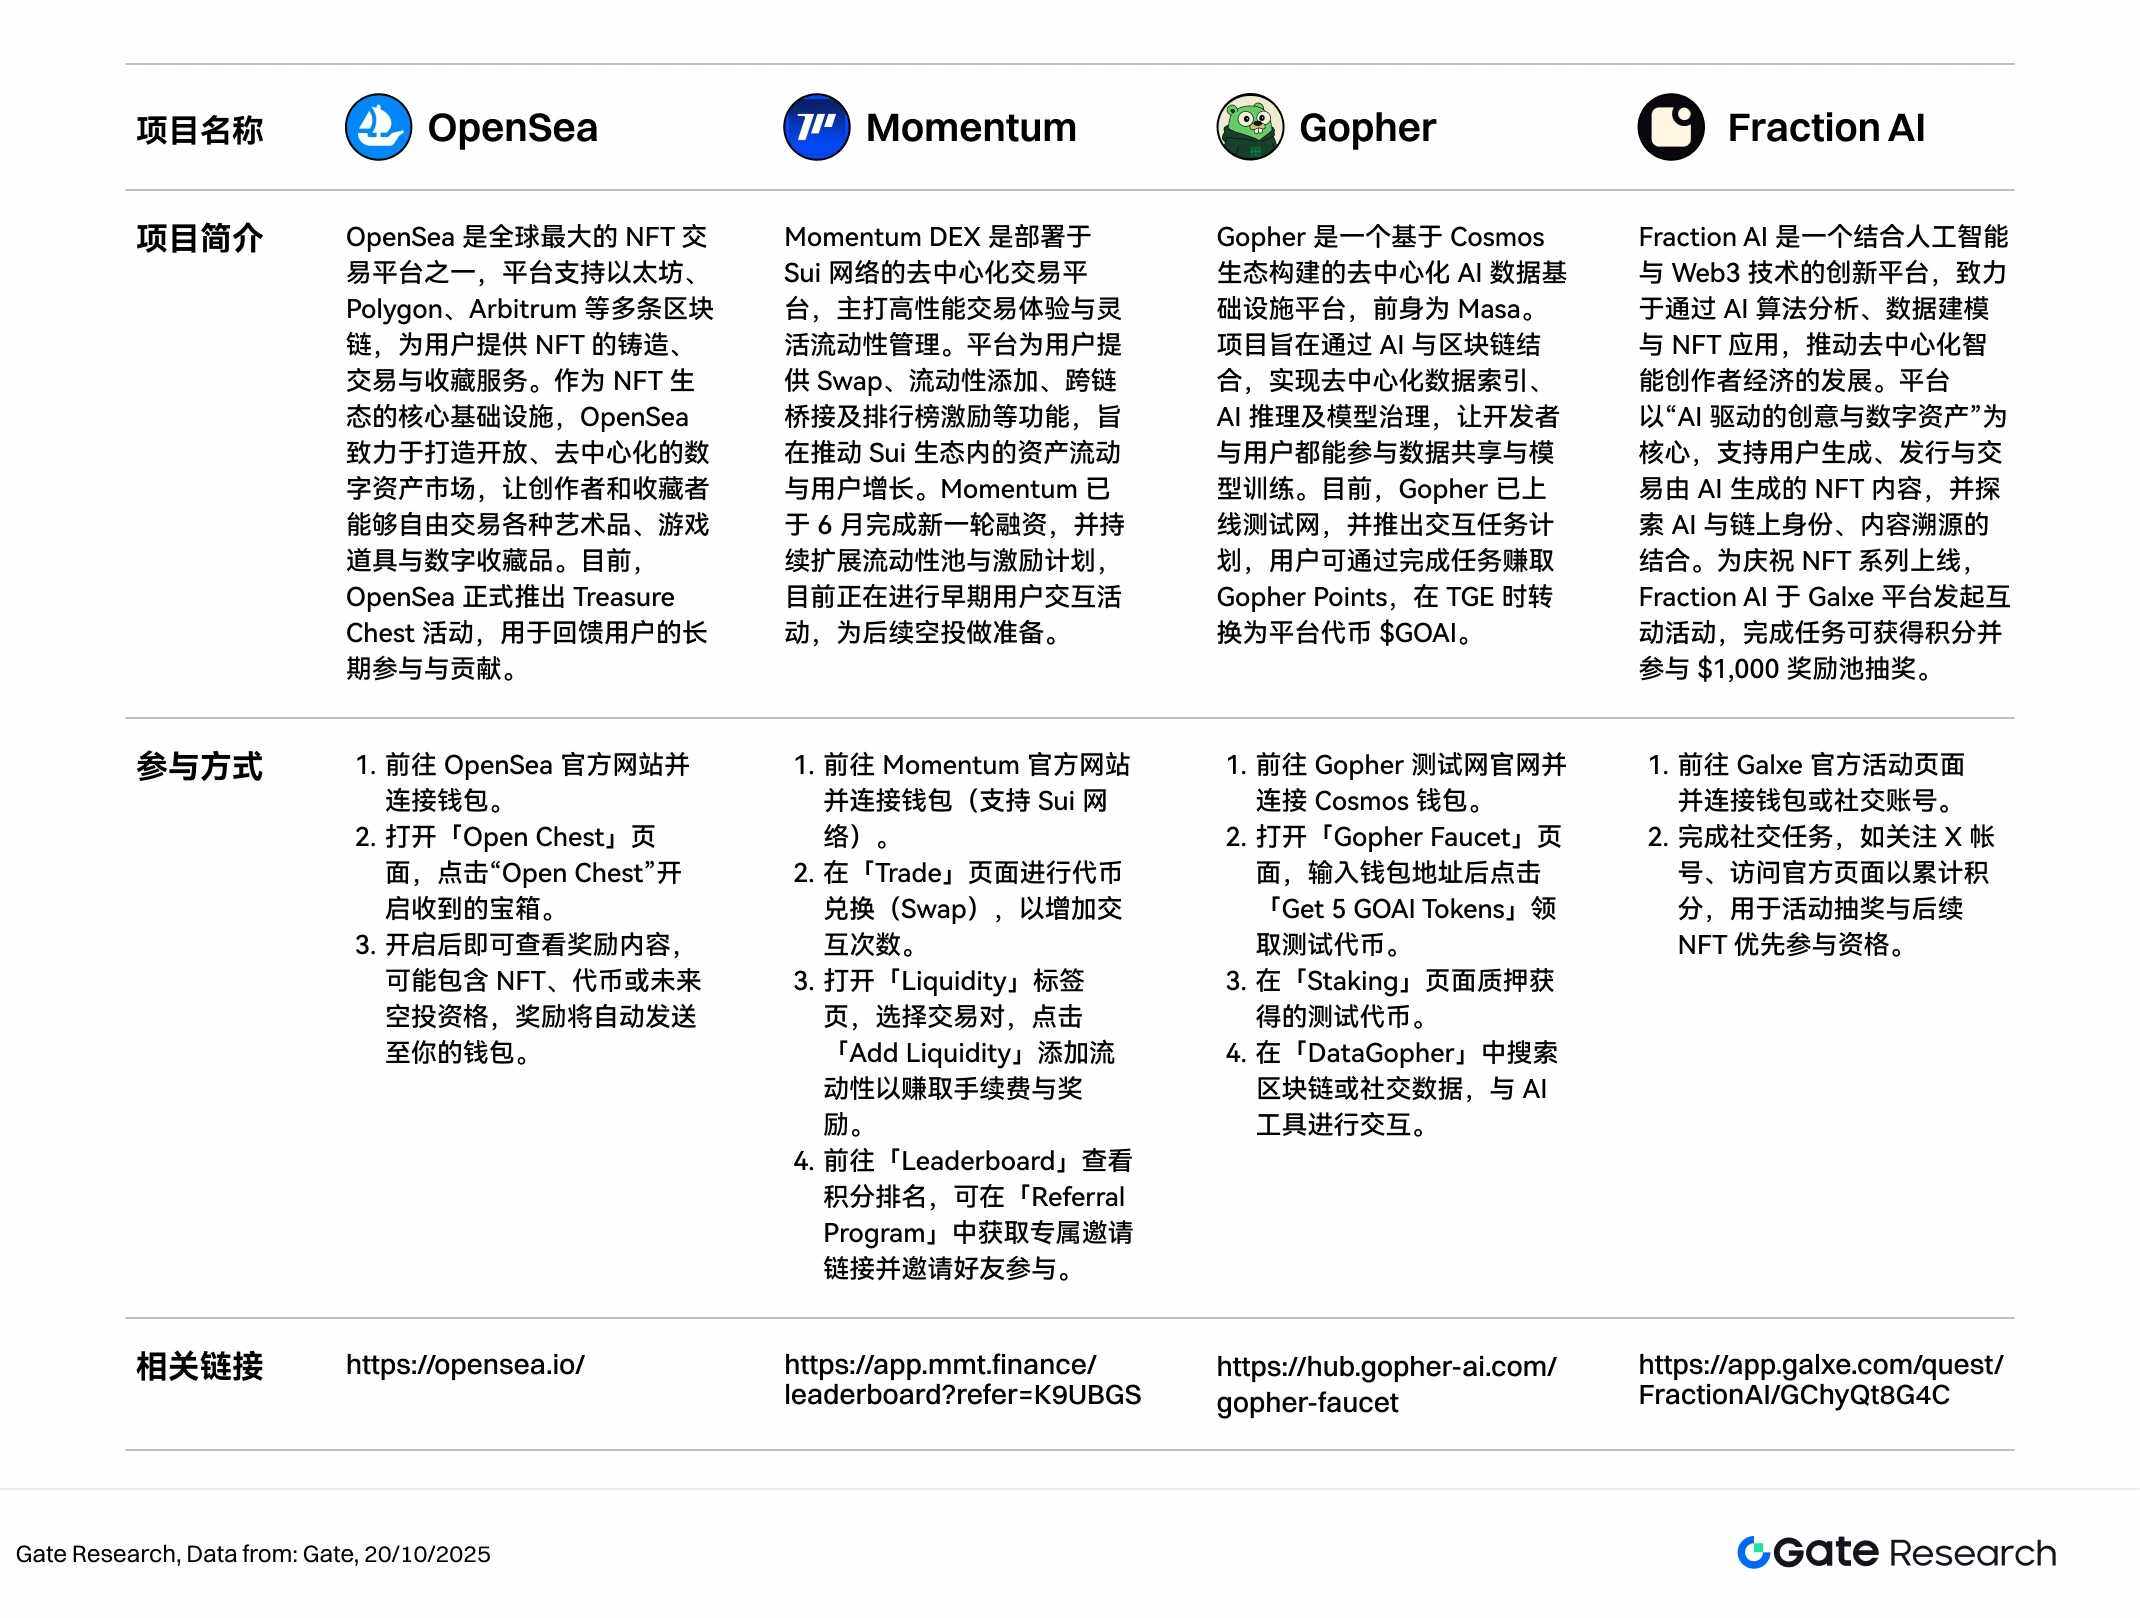
OpenSea
OpenSea is one of the world's largest NFT trading platforms, supporting multiple blockchains such as Ethereum, Polygon, and Arbitrum, providing users with NFT minting, trading, and collection services. As the core infrastructure of the NFT ecosystem, OpenSea is committed to building an open and decentralized digital asset market, allowing creators and collectors to freely trade various artworks, game items, and digital collectibles. Currently, OpenSea has officially launched the Treasure Chest program to reward users for their long-term participation and contributions. [2]
How to participate:
1. Go to the OpenSea official website and connect your wallet.
2. Open the "Open Chest" page and click "Open Chest" to open the received treasure chest.
3. Once activated, you can view the rewards, which may include NFTs, tokens, or future air investment opportunities. The rewards will be automatically sent to your wallet.
Momentum
Momentum DEX is a decentralized trading platform deployed on the Sui network, focusing on high-performance trading experience and flexible liquidity management. The platform provides users with functions such as swap, liquidity addition, cross-chain bridging and leaderboard incentives, aiming to promote asset flow and user growth within the Sui ecosystem. [3] Momentum completed a new round of financing in June and continues to expand its liquidity pool and incentive program. It is currently conducting early user interaction activities in preparation for subsequent airdrops.
How to participate:
1. Go to the Momentum official website and connect your wallet (Sui network supported).
2. Use the "Trade" page to perform token swaps to increase interaction frequency.
3. Open the "Liquidity" tab, select the trading pair, and click "Add Liquidity" to add liquidity to earn transaction fees and rewards.
4. Go to "Leaderboard" to check your points ranking. You can get a unique invitation link in "Referral Program" and invite your friends to participate.
Gopher
Gopher is a decentralized AI data infrastructure platform built on the Cosmos ecosystem, formerly known as Masa. The project aims to combine AI and blockchain to achieve decentralized data indexing, AI inference, and model governance, allowing developers and users to participate in data sharing and model training. Currently, Gopher has launched its testnet and introduced an interactive task program, where users can earn Gopher Points by completing tasks, which can be converted into the platform token $GOAI during TGE. [4]
How to participate:
1. Go to the Gopher testnet website and connect your Cosmos wallet.
2. Open the "Gopher Faucet" page, enter your wallet address, and click "Get 5 GOAI Tokens" to claim test tokens.
3. Test tokens obtained by staking on the "Staking" page.
4. Search for blockchain or social data in "DataGopher" and interact with AI tools.
Fraction AI
Fraction AI is an innovative platform combining artificial intelligence and Web3 technology, dedicated to promoting the development of a decentralized intelligent creator economy through AI algorithm analysis, data modeling, and NFT applications. The platform focuses on "AI-driven creativity and digital assets," supporting users in generating, issuing, and trading AI-generated NFT content, and exploring the integration of AI with on-chain identity and content traceability. To celebrate the launch of its NFT series, Fraction AI launched an interactive event on the Galxe platform, where completing tasks earns points and a chance to win a $1,000 reward pool. [5]
How to participate:
1. Go to the official Galxe event page and connect your wallet or social media account.
2. Complete social tasks, such as following the X account and visiting the official page, to accumulate points for event raffles and priority access to future NFTs.
hint
Airdrop plans and participation methods may be updated at any time. Users are advised to follow the official channels of the above projects for the latest information. Users should also participate cautiously, be aware of the risks, and conduct thorough research before participating. Gate does not guarantee the distribution of subsequent airdrop rewards.
Summarize
Looking back at the market performance from October 7th to October 20th, 2025, the overall market trend continued the pattern of "structural rotation + theme-driven," with a significant increase in the correlation between trading volume and price. BTC rebounded after stabilizing at $102,100, while ETH started its upward attack at $3,680, with mainstream assets providing a anchor for market confidence. The top 100 tokens by market capitalization performed steadily, with ZEC and TAO leading the privacy and AI sectors respectively; small and mid-cap projects were more active, with tokens such as RAIL, COAI, and SN64 seeing gains of over 100% and trading volume multiplying, becoming the main beneficiaries of this round of capital rotation.
From a data structure perspective, the correlation coefficient between trading volume/market capitalization and price increases is concentrated in the range of 0.7–0.9, indicating a market preference for assets with "high activity + strong narrative." In the scatter plot distribution, projects with significant volume increases are concentrated in the upper right quadrant, exhibiting clear structural strength, while stablecoins and mainstream assets are in the low correlation range, maintaining a relatively stable trend. Overall, the market is currently in a phase of "theme-driven, structurally differentiated" development. Short-term funds are focusing on the rotation of hot sectors, while long-term funds are observing macro liquidity and technical signals, awaiting the catalyst for the next round of trend-driven market movements.
In addition, OpenSea, Momentum, Gopher, and Friction AI, which we are tracking this period, are all in active incentive phases, focusing on the NFT market ecosystem, on-chain DEX trading, AI data networks, and AI content economy, respectively. Their ecosystem positioning is complementary, and their incentive paths are clear. Users can participate in tasks based on project characteristics, such as opening treasure chests, adding liquidity, staking test tokens, or completing Galxe social tasks to increase their points and potential TGE reward weight. We recommend continuously monitoring the official announcements and interactive activities of each project to seize airdrop distribution and early benefit windows.
References:
1. CoinGecko, https://www.coingecko.com/
2. OpenSea, https://opensea.io/
3. Momentum, https://app.mmt.finance/leaderboard?refer=K9 UBGS
4. Gopher, https://hub.gopher-ai.com/gopher-faucet
5. Fraction AI, https://app.galxe.com/quest/FractionAI/GChyQt8G4C
Gate Research is a comprehensive blockchain and cryptocurrency research platform that provides readers with in-depth content, including technical analysis, insights into hot topics, market reviews, industry research, trend forecasts, and macroeconomic policy analysis.
Disclaimer
Investing in the cryptocurrency market involves high risks. Users are advised to conduct independent research and fully understand the nature of any assets and products they intend to purchase before making any investment decisions. Gate assumes no responsibility for any loss or damage arising from such investment decisions.


