






Glassnode:加密市場進入築底後期階段


- 核心觀點:比特幣市場呈現熊市末期特徵,價格已連續五個月處於深度低估區間,長期持有者止損拋壓創2022年12月以來新高,但市場築底所需條件已基本具備,反轉需等待關鍵訊號出現。
- 關鍵要素:
- 價格現狀:比特幣當前價格(約64400美元)顯著低於76600美元的真實市場均值和72200美元的短期持有者成本線,折價持續近五個月,處於歷史性深度低估區間。
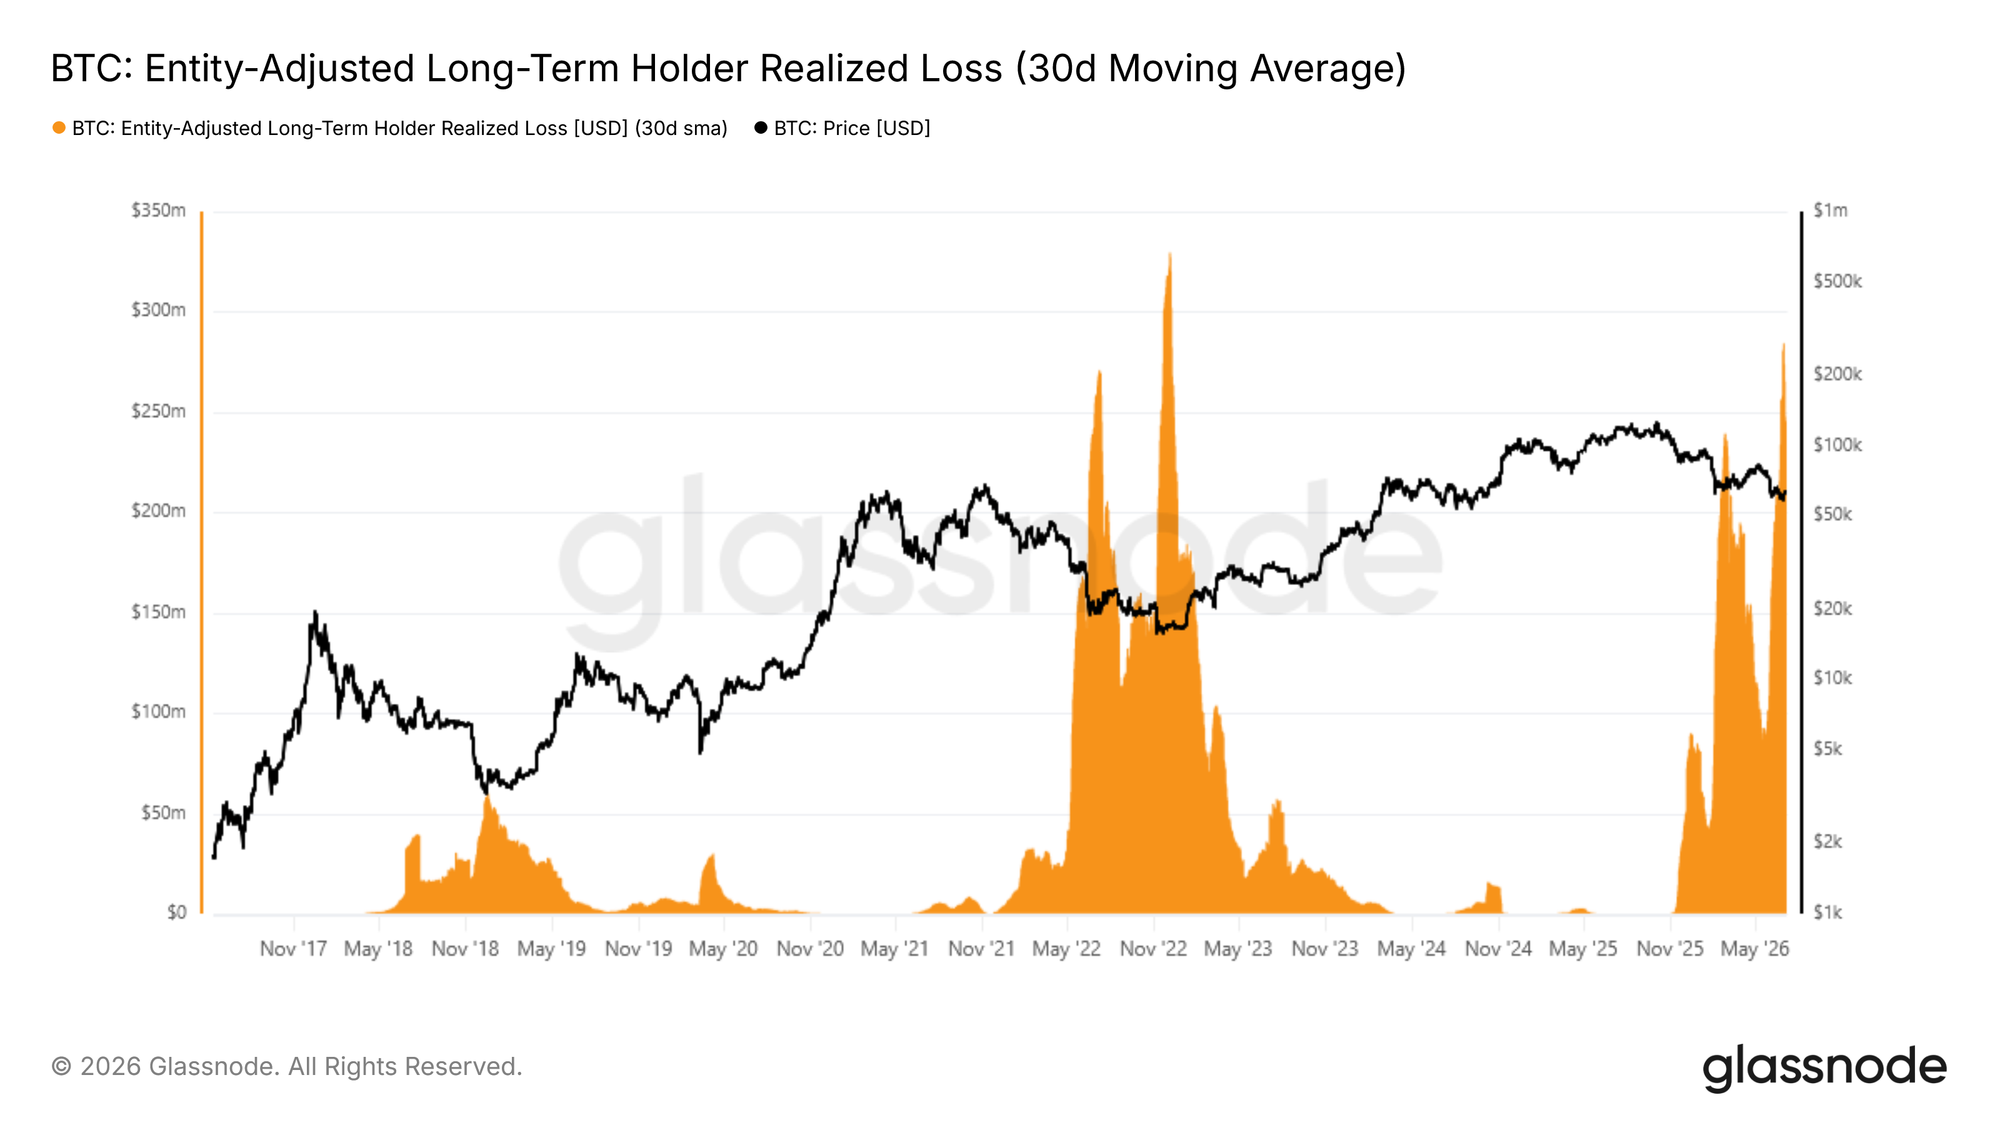
- 長期持有者拋壓:長期持有者虧損兌現占鏈上總虧損比例升至43%,單日虧損兌現峰值達2.8億美元,為2022年12月以來最高,且拋壓尚未出現衰減訊號。
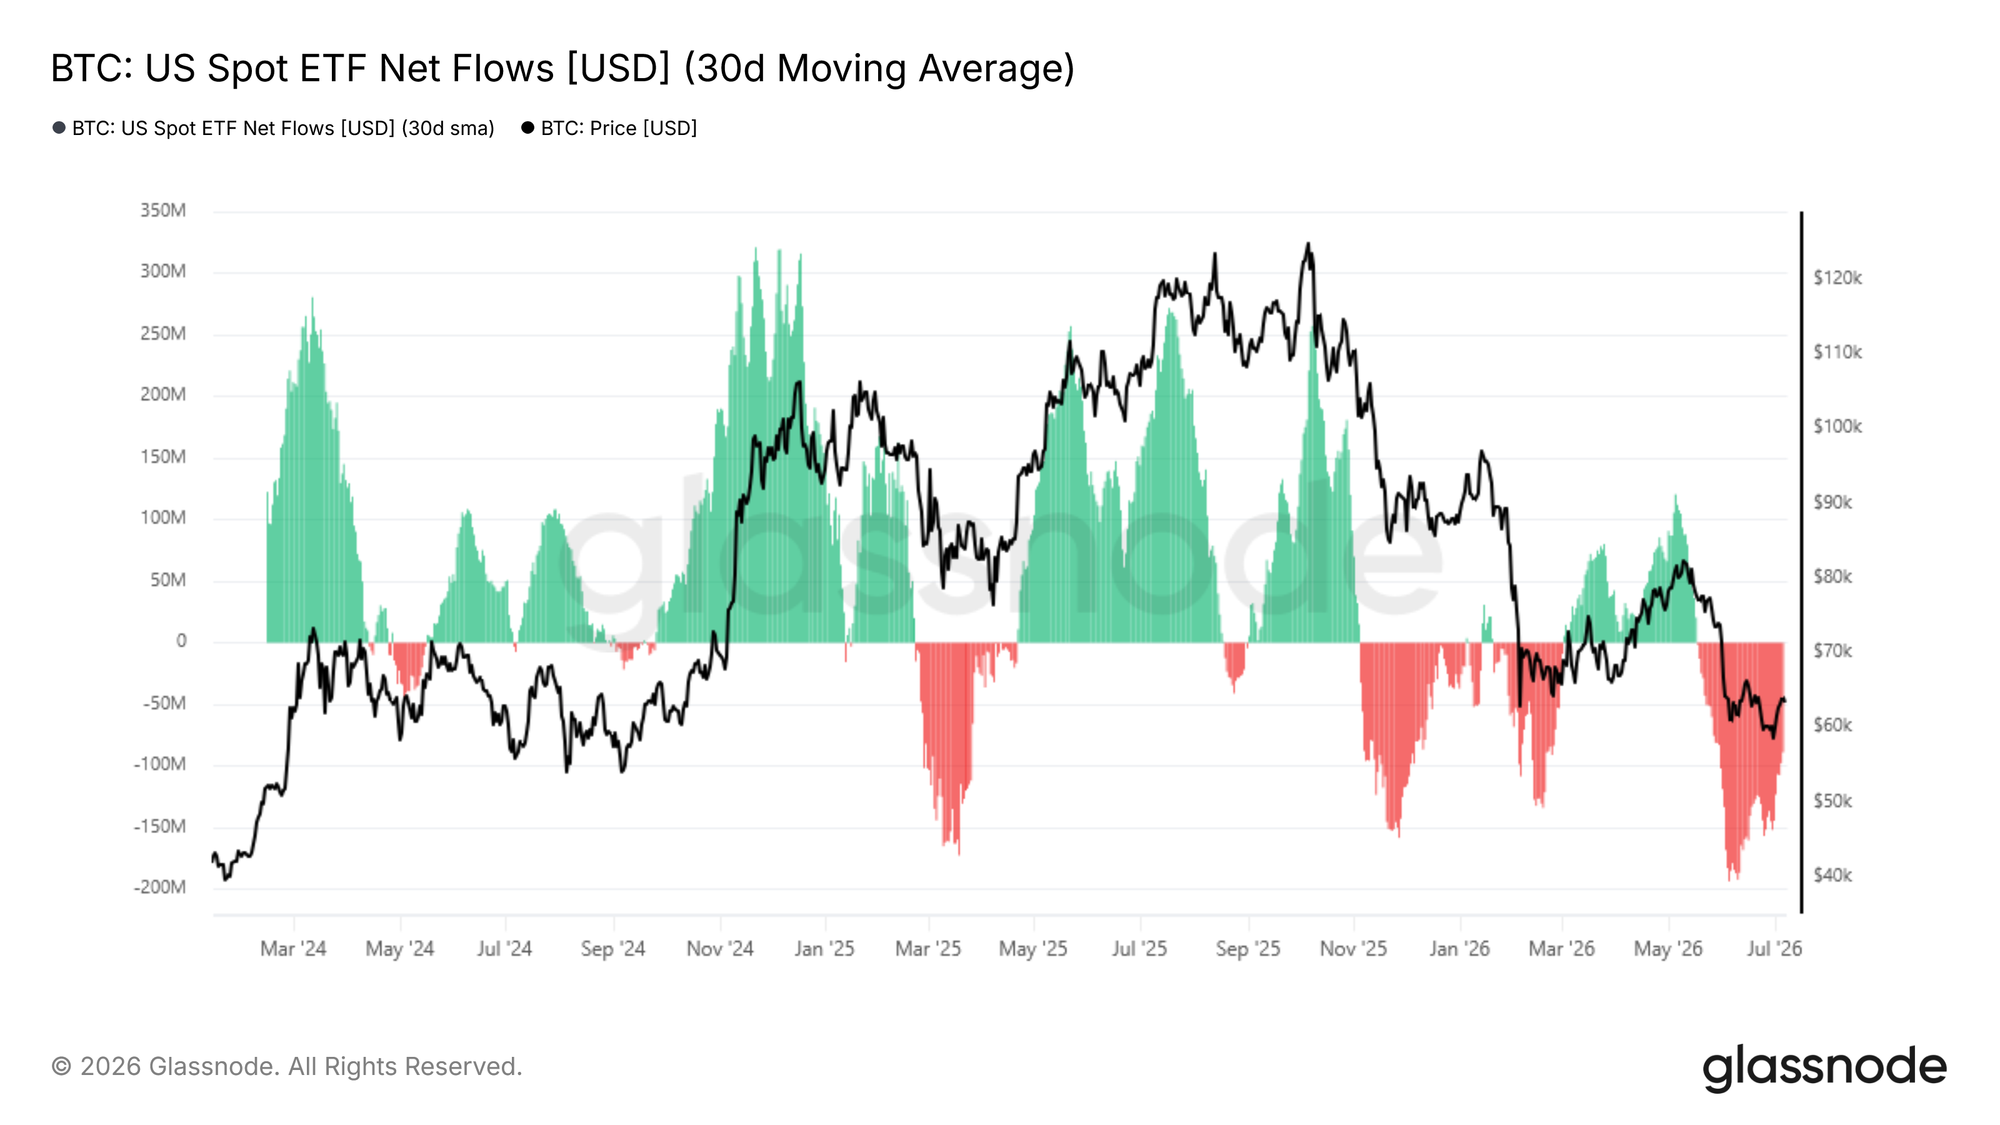
- ETF資金流向:現貨ETF資金流出規模較6月初峰值(1.93億美元/日)緩和至8890萬美元/日,但仍維持月度淨流出,機構買盤需求未企穩;日均成交額較2025年10月峰值縮水約80%。
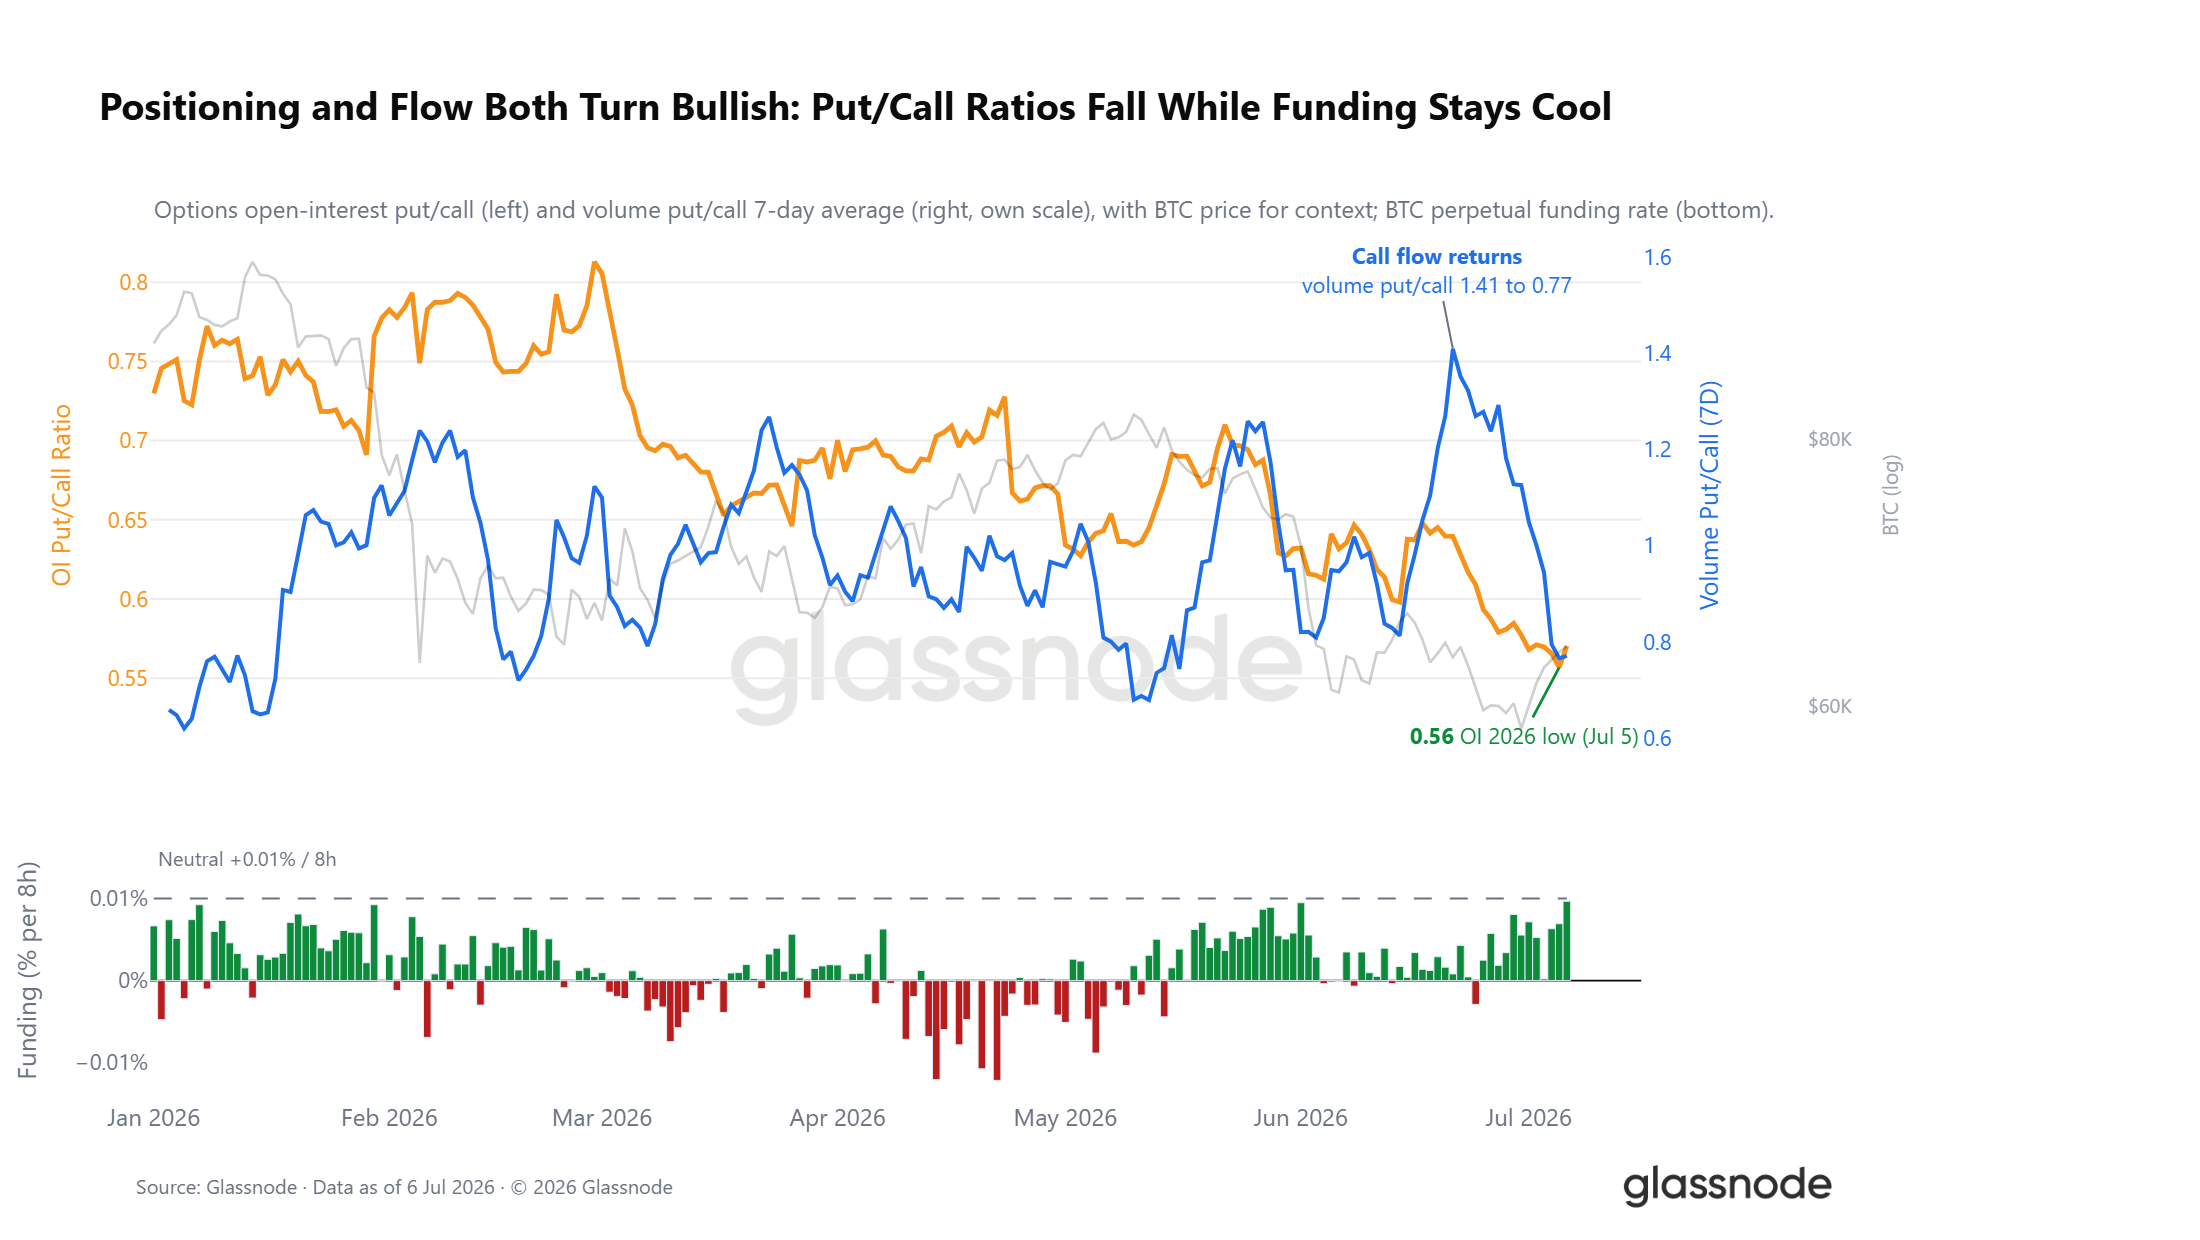
- 衍生品持倉:期權看跌/看漲比率跌至0.56,為年內低點;永續合約資金費率低於0.01%平衡線,市場已從擁擠做空轉為謹慎偏多。
- 波動率與對沖成本:期權曲面仍定價下行風險,25delta波動率傾斜維持溢價;但實際對沖成本下降,DVOL波動率指數跌至12個月低位,對沖需求逐步消退。
Original Authors: CryptoVizArt, Frederik Theissen, Glassnode
Original Translation: Luffy, Foresight News
Bitcoin's price has been below both the Realized Price and the Short-Term Holder cost basis for five consecutive months, positioning it deep within an undervalued zone.
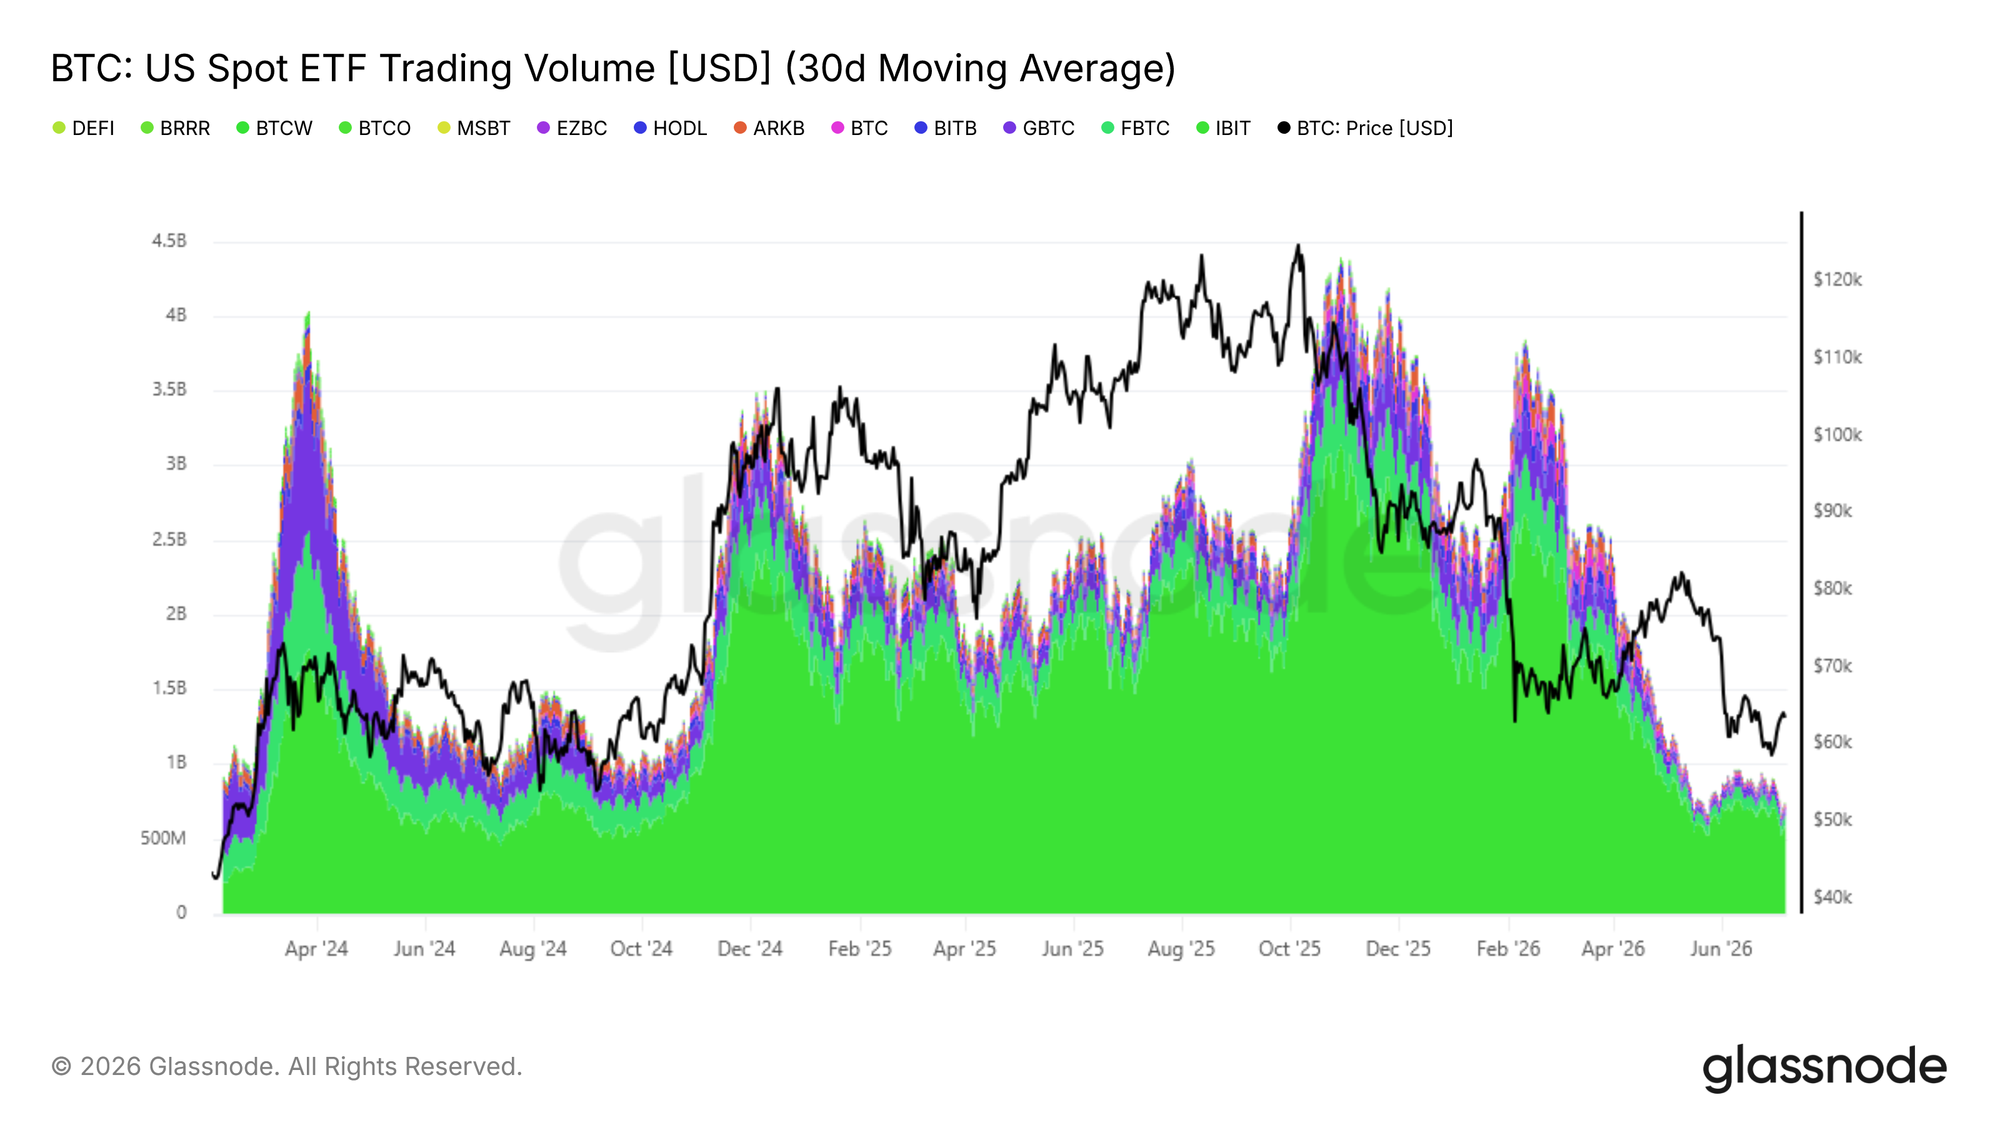
The proportion of losses realized by long-term holders (LTHs) relative to total on-chain realized losses has surged to 43%. The peak daily realized loss from LTHs reached $280 million, the highest level since December 2022. Spot ETF outflow velocity has moderated but remains in a net monthly outflow state. The average daily trading volume of ETFs hovers between $650 million and $950 million, roughly 80% below the cyclical peak seen in October 2025, indicating that institutional buying demand has yet to stabilize.
Derivatives positioning has shifted to cautiously bullish, with the put/call ratio hitting a year-to-date low. However, the options volatility surface still maintains a defensive premium, and the spot price is significantly below the Max Pain point. The market appears to be in a late-stage bottoming process, with the continued contraction of sell-side pressure from long-term holders being a crucial prerequisite for a trend reversal and recovery.
Macro Perspective
Crude Oil Surges, Risk Assets Under Broad Pressure
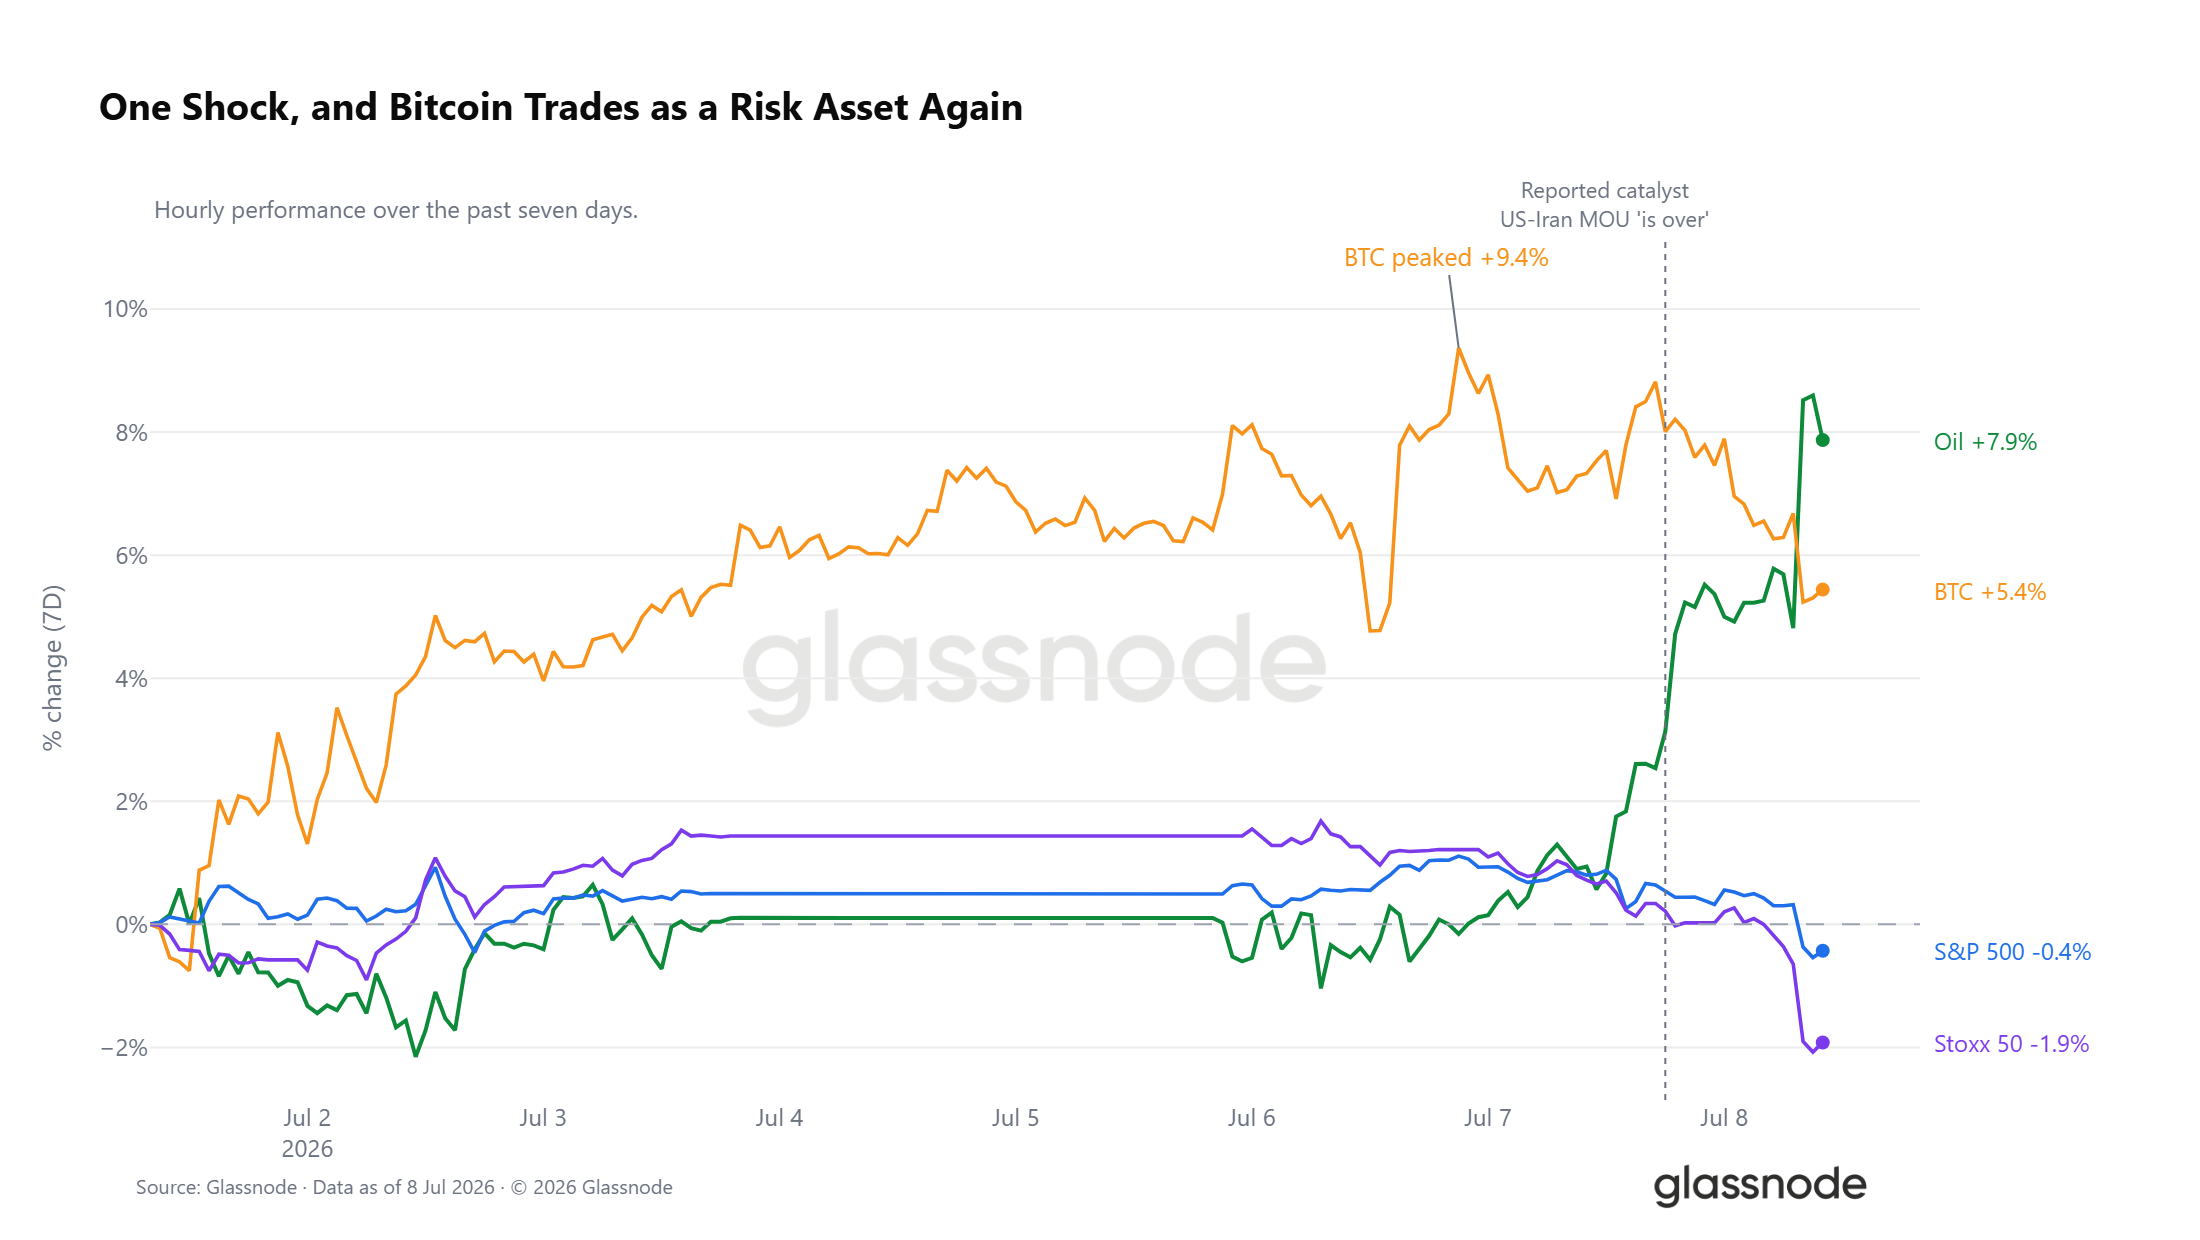
Over the past seven trading days, WTI crude oil has accumulated a gain of 7.9%, with most of the increase concentrated recently. News of the expiration of the US-Iran memorandum of understanding has impacted all asset markets. Bitcoin saw a peak weekly gain of 9.4% but has since retraced to a weekly increase of 5%. The S&P 500 and Euro Stoxx indices have both turned negative, with European stocks leading the decline among global risk assets. Currently, Bitcoin's price action is highly correlated with risk assets.
Liquidity Landscape: Intensifying Bull-Bear Contradictions
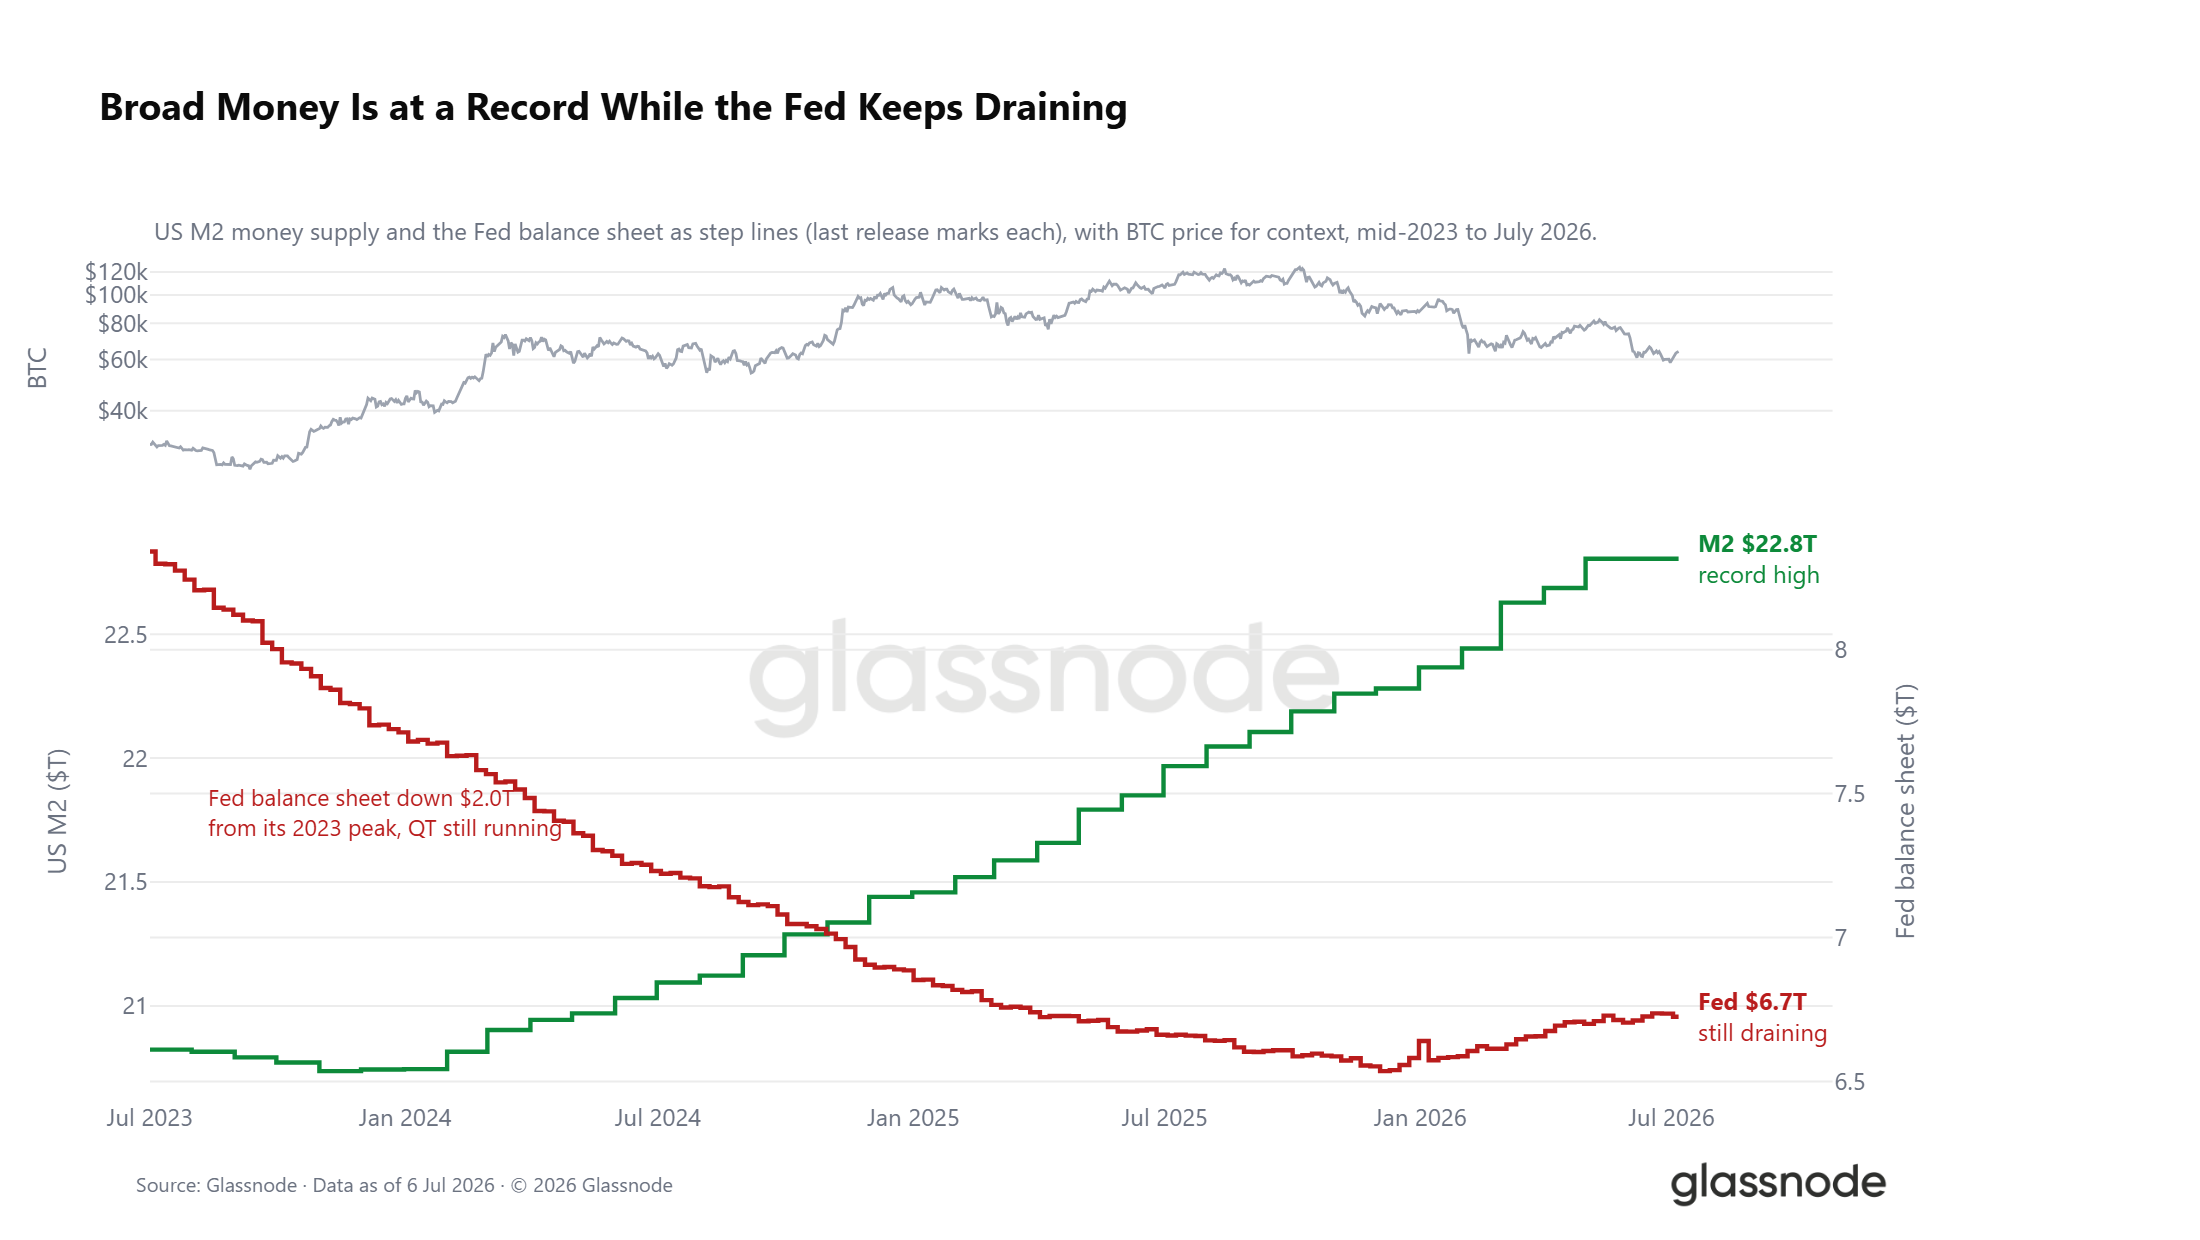
Amidst the external shock from crude oil, the market liquidity environment presents a fragmented picture. US broad money supply (M2) has climbed to a new all-time high of $22.8 trillion. Historically, periods of broad money expansion often boost market risk appetite. However, the Federal Reserve's balance sheet continues to shrink, now $2 trillion below its 2023 peak. These two liquidity signals form a strong hedge: the broad money supply continues to rise, while quantitative tightening persists, with real interest rates hovering around 1%. This keeps the opportunity cost of holding non-yielding digital assets high. The macro window for bullish catalysts isn't entirely closed, but neither has it formed a clear easing support.
On-Chain Data
A Five-Month Period of Deep Undervaluation
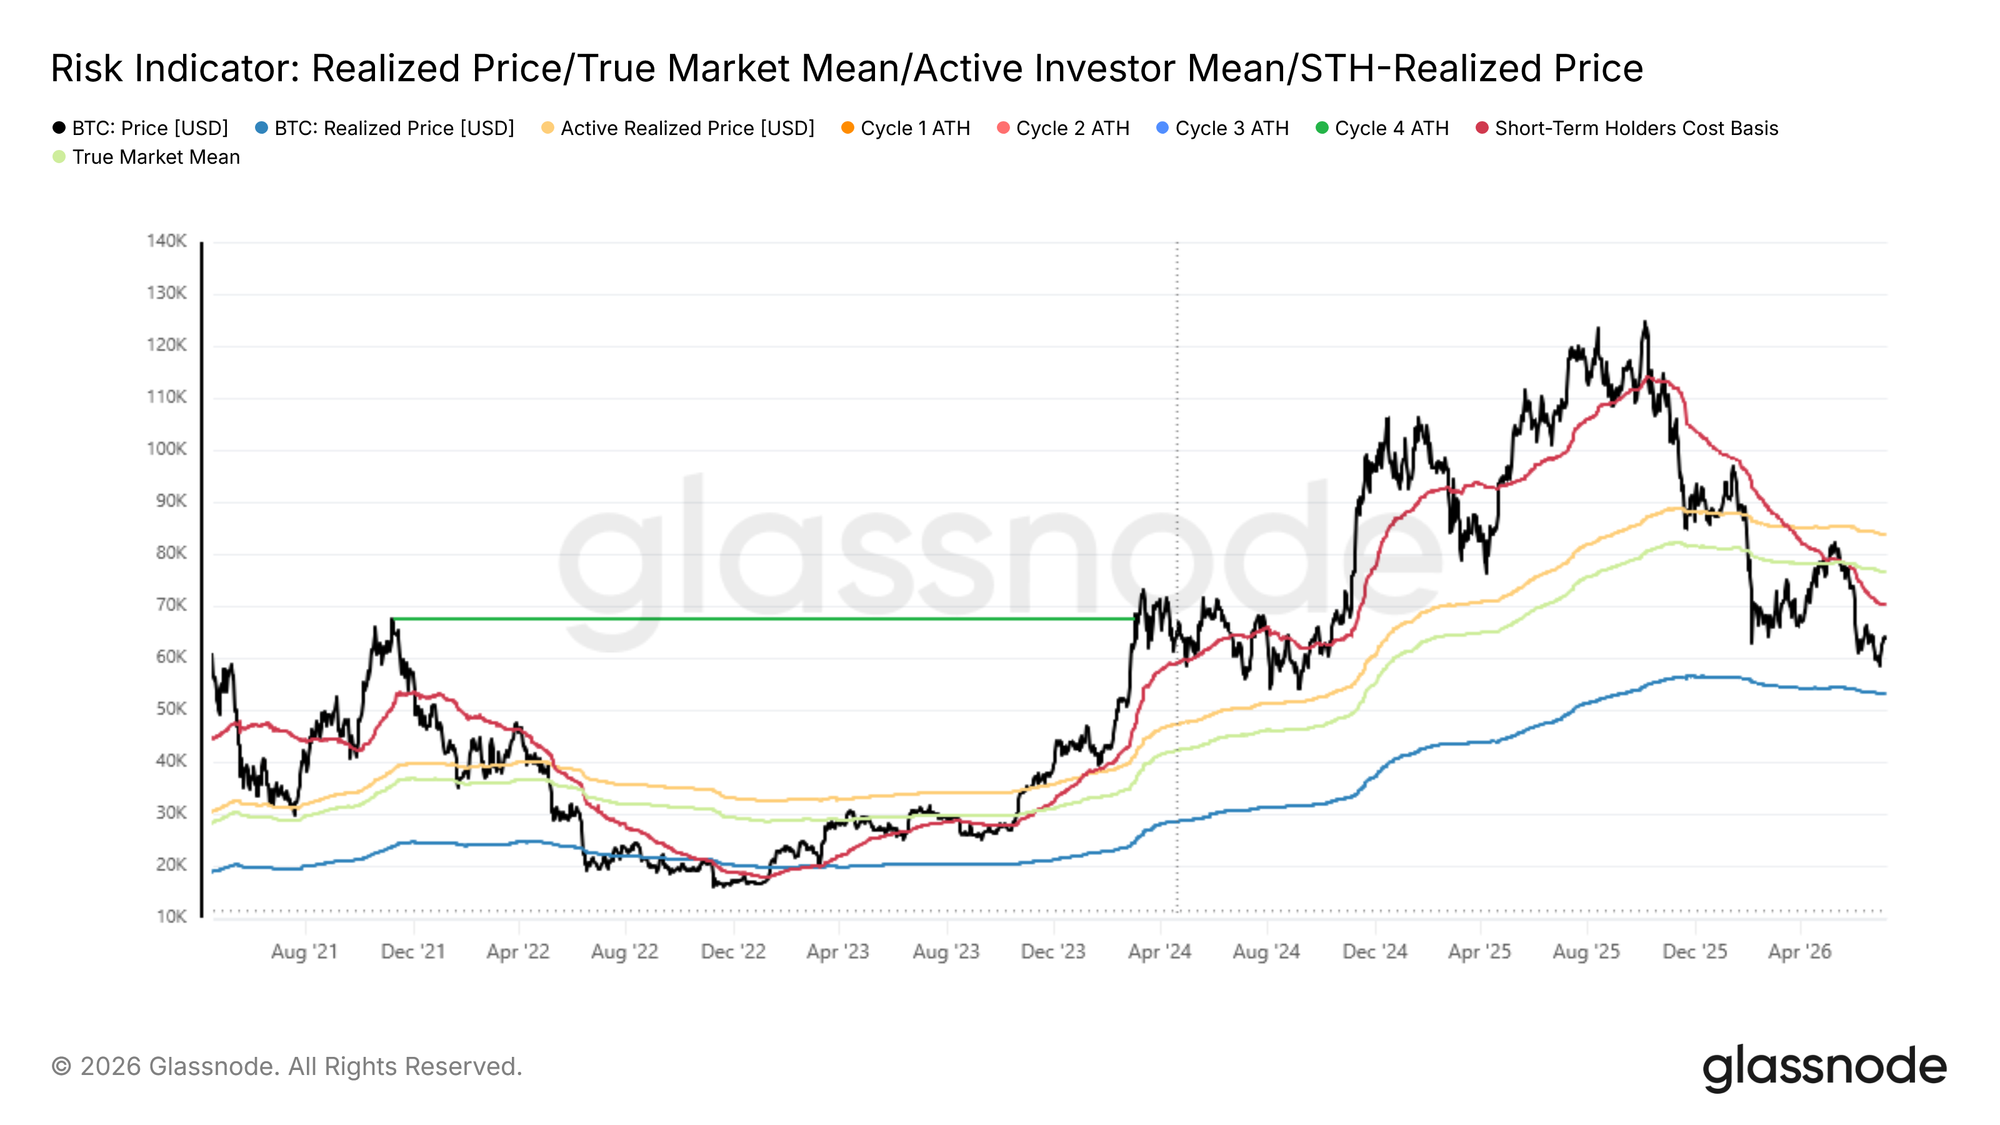
Over the past week, Bitcoin rebounded from $58,300 to $64,400, showing some short-term price repair. However, the price remains significantly below the Realized Price of $76,600 and the Short-Term Holder cost basis of $72,200. Only when the price reclaims these two key levels can the market exit the deep undervaluation zone; otherwise, the market remains susceptible to downside catalysts from external shocks.
The duration of this discount is noteworthy. Since early February 2026, the price has consistently traded below both the Active Investor Cost Basis and the breakeven level for recent entrants. This period, approaching five months, represents one of the longest sustained deep discount cycles in Bitcoin's history.
Continued coin redistribution within this prolonged discount zone, with new capital accumulating below the cost basis of previous buyers and the aggregate market active cost basis, has historically been a foundation for cyclical market bottoms, offering attractive long-term value for fundamental investors. While various indicators suggest the bottoming process is in its latter half, the possibility of a retest to $53,000 cannot be entirely ruled out.
Concentrated Stop-Losses from High-Cost-Basis Long-Term Holders
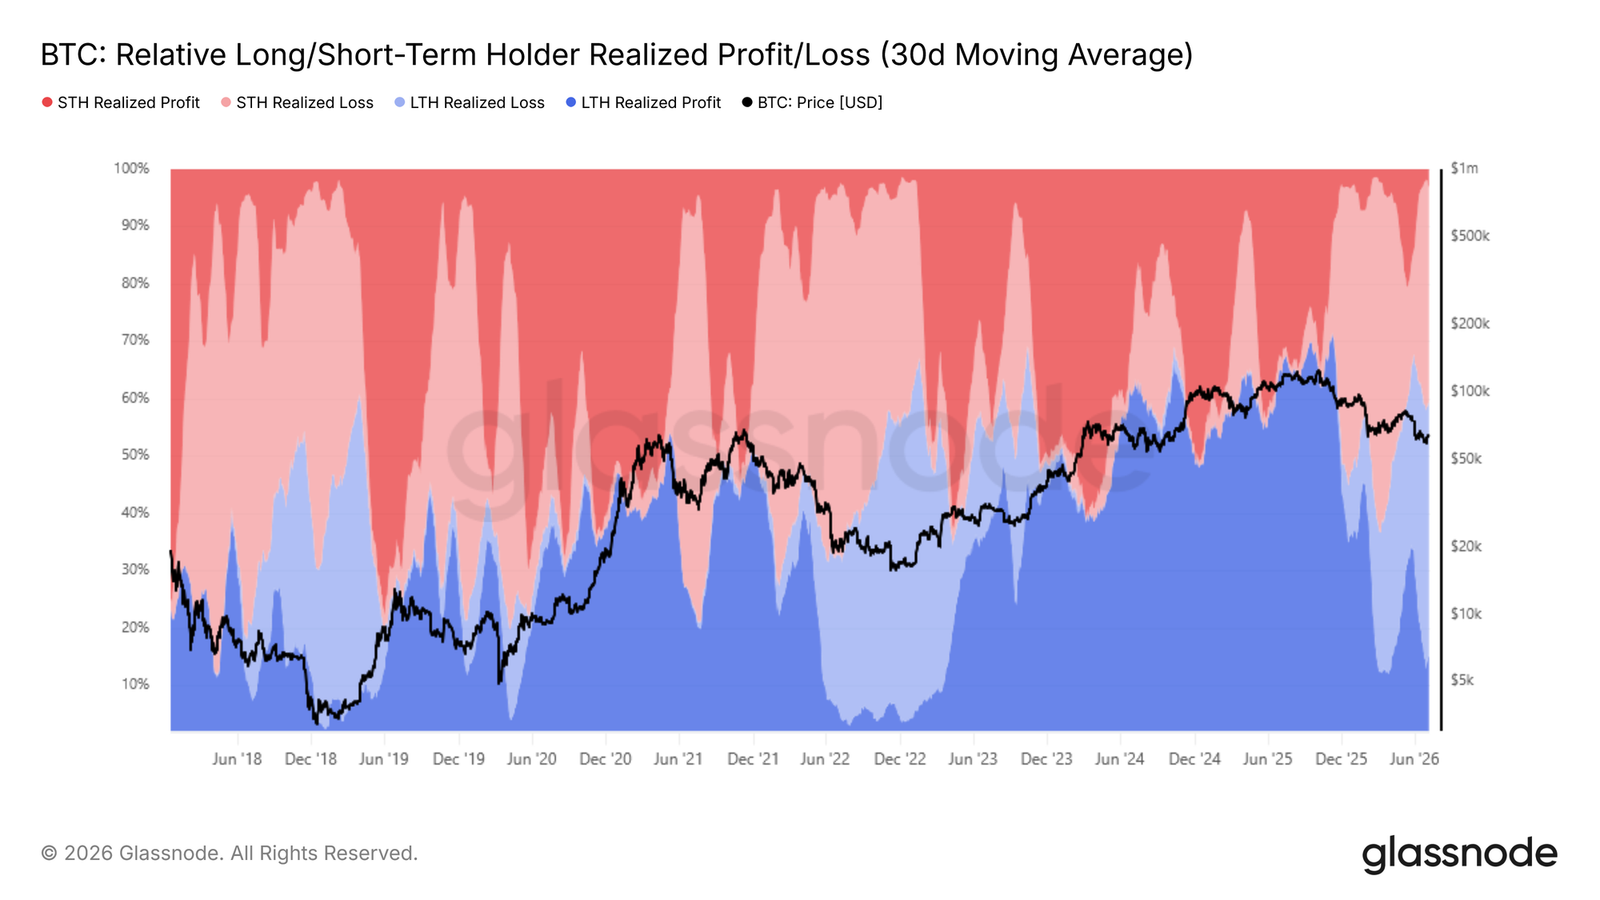
The market is in the process of forming a cyclical bottom. The core question now is identifying the primary source of downward selling pressure. The LTH-STH Profit/Loss Realization Ratio tracks the allocation of total on-chain realized profits and losses between long-term and short-term holder cohorts, clearly showing the proportion of gains or losses being booked by each group.
Since Bitcoin's price broke below the Realized Price, the 30-day moving average of losses realized by long-term holders as a percentage of total realized losses has climbed from 15% in early February 2026 to its current 43%. The selling pressure from this cohort, driven by stop-losses due to unrealized losses, has become the most dominant bearish force suppressing the price.
These investors mostly entered near the cyclical highs. After months of deep drawdowns, their holding conviction has gradually eroded, leading to a concentrated exit. This on-chain structure directly explains why each relief rally encounters concentrated selling from deeply underwater holders, making it difficult for the price to sustain levels near the upper bound of the current range.
Stop-Loss Selling Pressure Shows No Signs of Abating
Loss realization by long-term holders has become the market's primary downward pressure. The next key observation point is whether this selling pressure begins to fade.
The entity-adjusted LTH Realized Loss indicator (30-day smoothed moving average) measures the USD value of losses realized when coins held for over 155 days are spent, filtering out internal wallet transfers to accurately reflect genuine stop-loss behavior. This indicator recently spiked to a new daily peak, with realized losses hitting approximately $280 million in a single day. This is the highest level since December 2022 and marks the second major wave of long-term holder capitulation in this bear market.
The critical difference is that after the first wave of capitulation peaked, selling pressure subsided cyclically. In contrast, this current wave of selling has yet to show any contraction in scale. Only when this indicator shows a clear downward trend will the foundational conditions for a bullish market shift be met. Over the coming weeks and months, the trajectory of this indicator will be the core signal for determining whether the market has truly completed its sell-off.
Off-Chain Markets
ETF Outflows Slow, But Trend Not Reversed
Shifting from on-chain to off-chain markets, the capital flow of spot ETFs provides a direct view of institutional capital behavior. The 30-day moving average of ETF net flows smooths out daily fluctuations in net inflows or outflows for US spot Bitcoin ETFs, revealing underlying trends in institutional positioning.
Since mid-May 2026, this metric has turned into a monthly net outflow regime. The daily outflow peaked at $193 million in early June and has since moderated to $88.9 million per day. The slowdown in outflow pace is a mildly positive signal, but the market continues to experience a monthly net capital drain, and institutional buying demand has not stabilized. Only when capital flows consistently narrow to a neutral range can one reasonably anticipate a sustained expansionary rally in the short term.
Institutional Trading Volume Remains Depressed
Beyond net flow data, the trading volume of US spot ETFs helps gauge the degree of institutional confidence recovery. The 30-day moving average of daily ETF volume currently fluctuates between $650 million and $950 million. This level is comparable to Q4 2024 but is roughly 80% lower than the daily average peak of $4.4 billion set in October 2025.
Current volume levels represent baseline institutional participation. They remain extremely depressed compared to bull market peaks, indicating that medium-to-long-term bullish conviction from ETF investors has not meaningfully returned. Only when daily trading volume consistently expands alongside a narrowing of net capital outflows—both signals appearing synchronously—can institutional demand recovery be confirmed. Until both types of indicators improve concurrently, off-chain data corroborates on-chain signals, suggesting the market remains predominantly within a bearish regime.
Derivatives Market
Short Squeeze, Positioning Turns Cautiously Bullish
Despite weakening risk sentiment, derivatives positioning has already shown a counter-trend shift. The put/call ratio for open interest in options dropped to 0.56, its lowest level in 2026, implying roughly two call options for every put option in the market. Options flow data corroborates this trend: two weeks ago, during Bitcoin's double-bottom retest of lows, there was a frenzy of put buying for hedging, causing the put/call volume ratio to spike sharply. As call order flow has since returned, the ratio has rapidly declined, even though the spot price has only partially recovered its losses.
Perpetual swap funding rates also confirm this shift in positioning. The average funding rate has consistently remained below the 0.01% bull-bear equilibrium line, far from levels seen in crowded long markets. The derivatives market has completed its short-risk clearance. Amidst external negative shocks, the overall posture has turned cautiously bullish, a complete reversal from the crowded short positioning observed before the previous major sell-off.
Options Skew Continues to Price Downside Risk
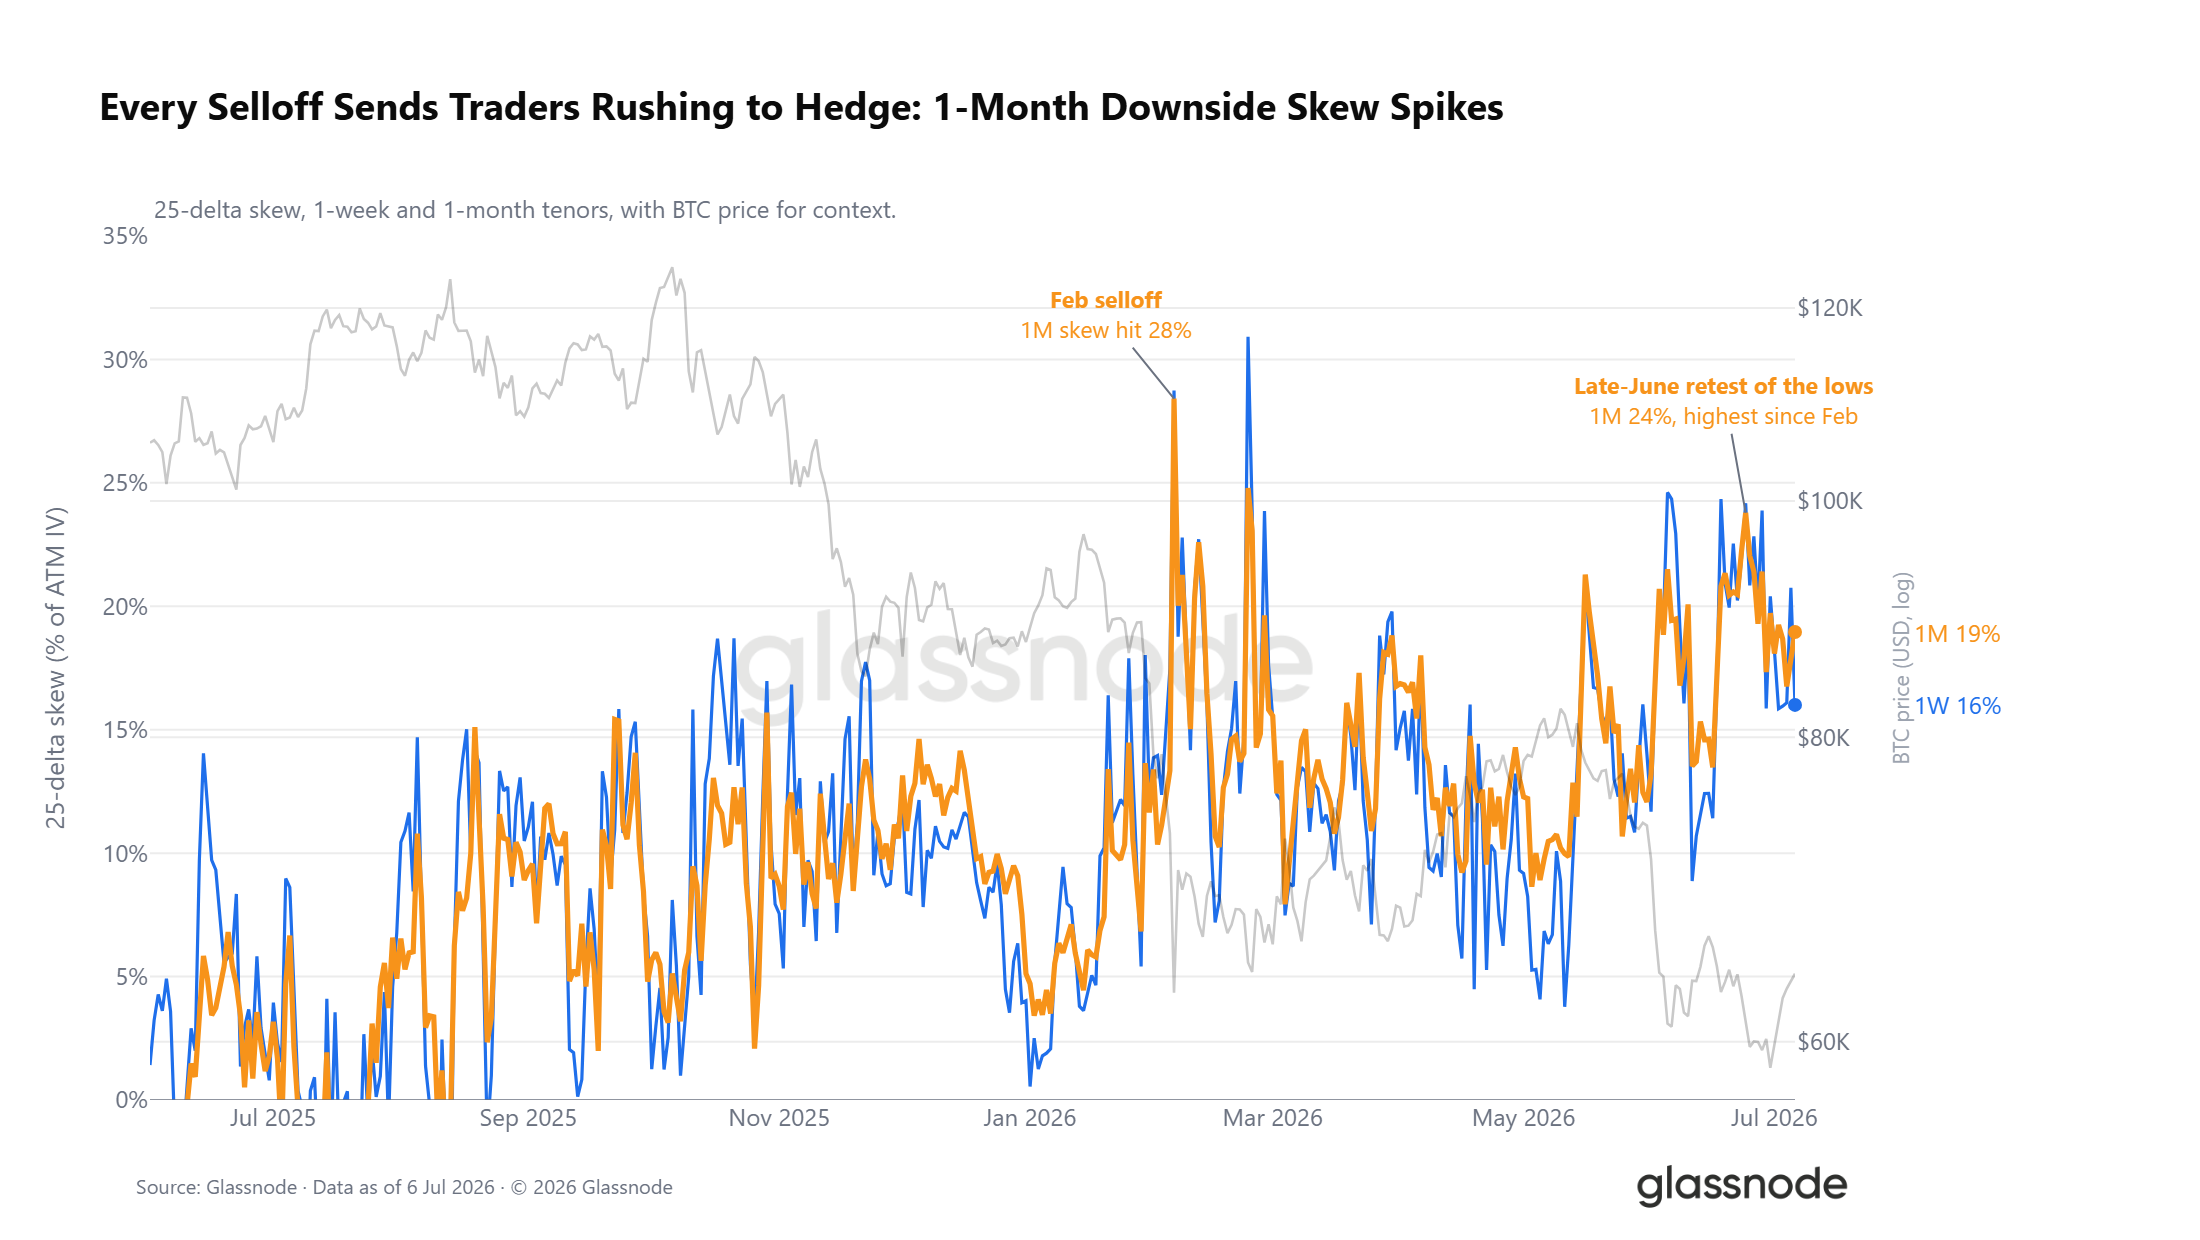
Despite the overall bullish bias in positioning, the options volatility surface gives a different signal. The 25-delta risk reversal skew (premium for downside protection relative to upside upside) remains in premium territory across all tenors. Each corrective wave this year has pushed this premium higher. Late June saw the metric surge to 24%, marking the strongest defensive sentiment for near-term contracts since the February sell-off. Even with market positioning leaning bullish, traders remain willing to pay a premium for downside hedging instruments.
Spot Price Deviates from Max Pain Level
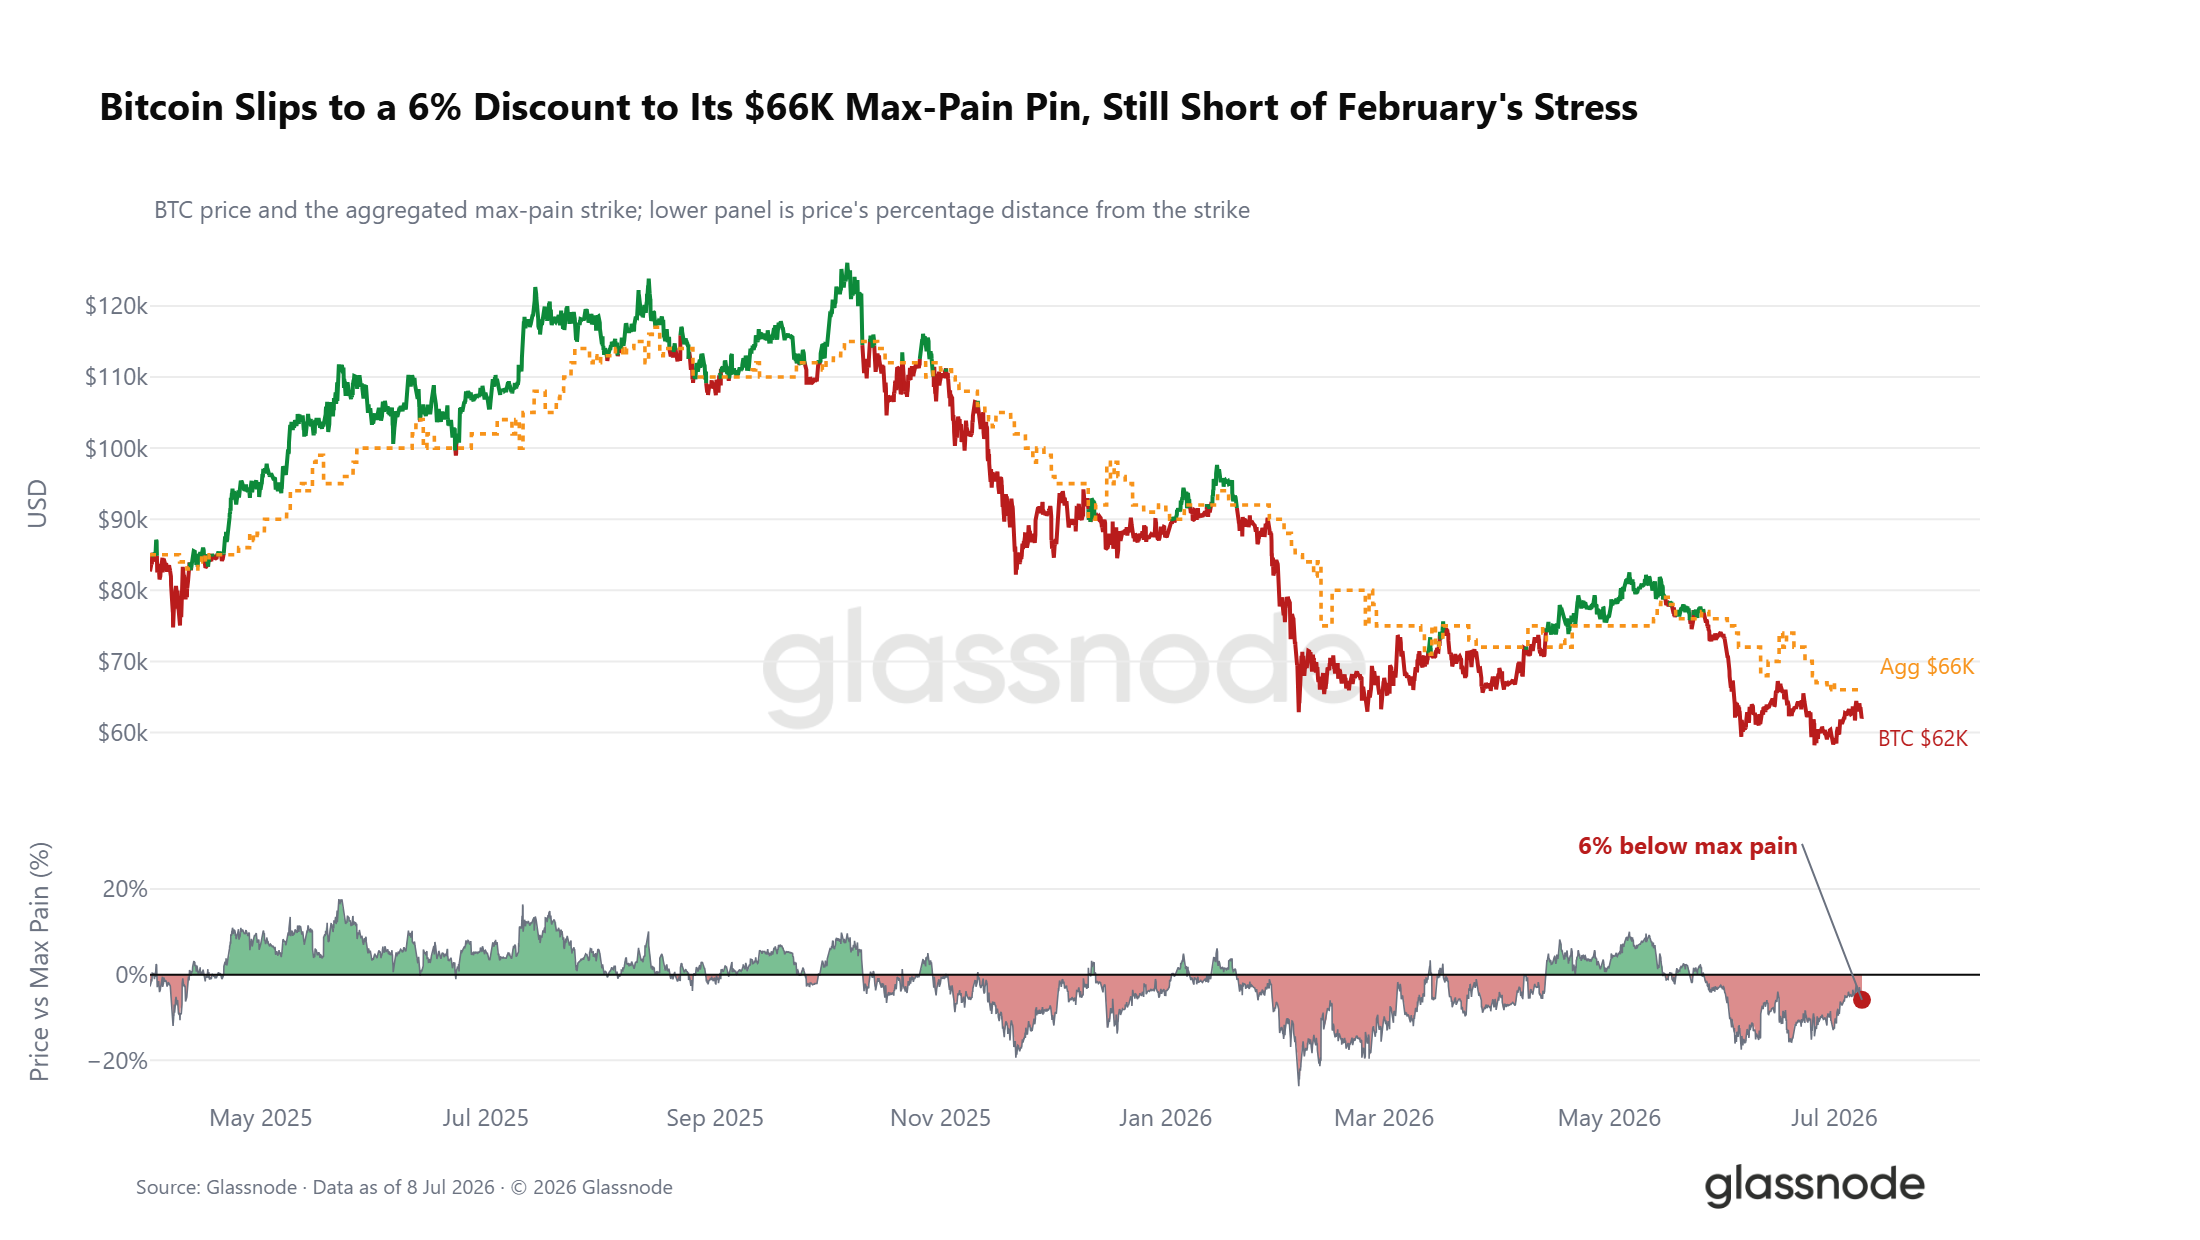
Beyond positioning and skew, the relative position of the spot price to the options market structure offers further clues. The current Bitcoin spot price is approximately 6% below the aggregate Max Pain price of $66,000. The Max Pain price is the strike price at which the maximum number of open options contracts would expire worthless, and the price often tends to gravitate towards this level near expiration.
This week's decline widened the gap between spot and Max Pain, but the deviation is far less extreme than during the February sell-off, placing it roughly in the middle of the 2026 trading range. Throughout the year, the Max Pain price has acted as a gravitational center for price action, with the spot price oscillating around it and rarely maintaining large or prolonged deviations. If the price can stabilize above $66,000, it would be a constructive short-term signal. Conversely, a further widening of the gap would reinforce the overall defensive trading sentiment evident in the options market.
Cost of Crash Hedging Continues to Decline
While volatility skew and positioning signals present a mixed picture, the absolute cost of hedging downside risk has a clear trend. Following the modest market rebound, the put-side of the one-month volatility curve has seen its overall pricing shift lower. The implied volatility for put options 5% below the spot price has dropped significantly. The cheapest points on the volatility curve are currently concentrated in out-of-the-money call options.
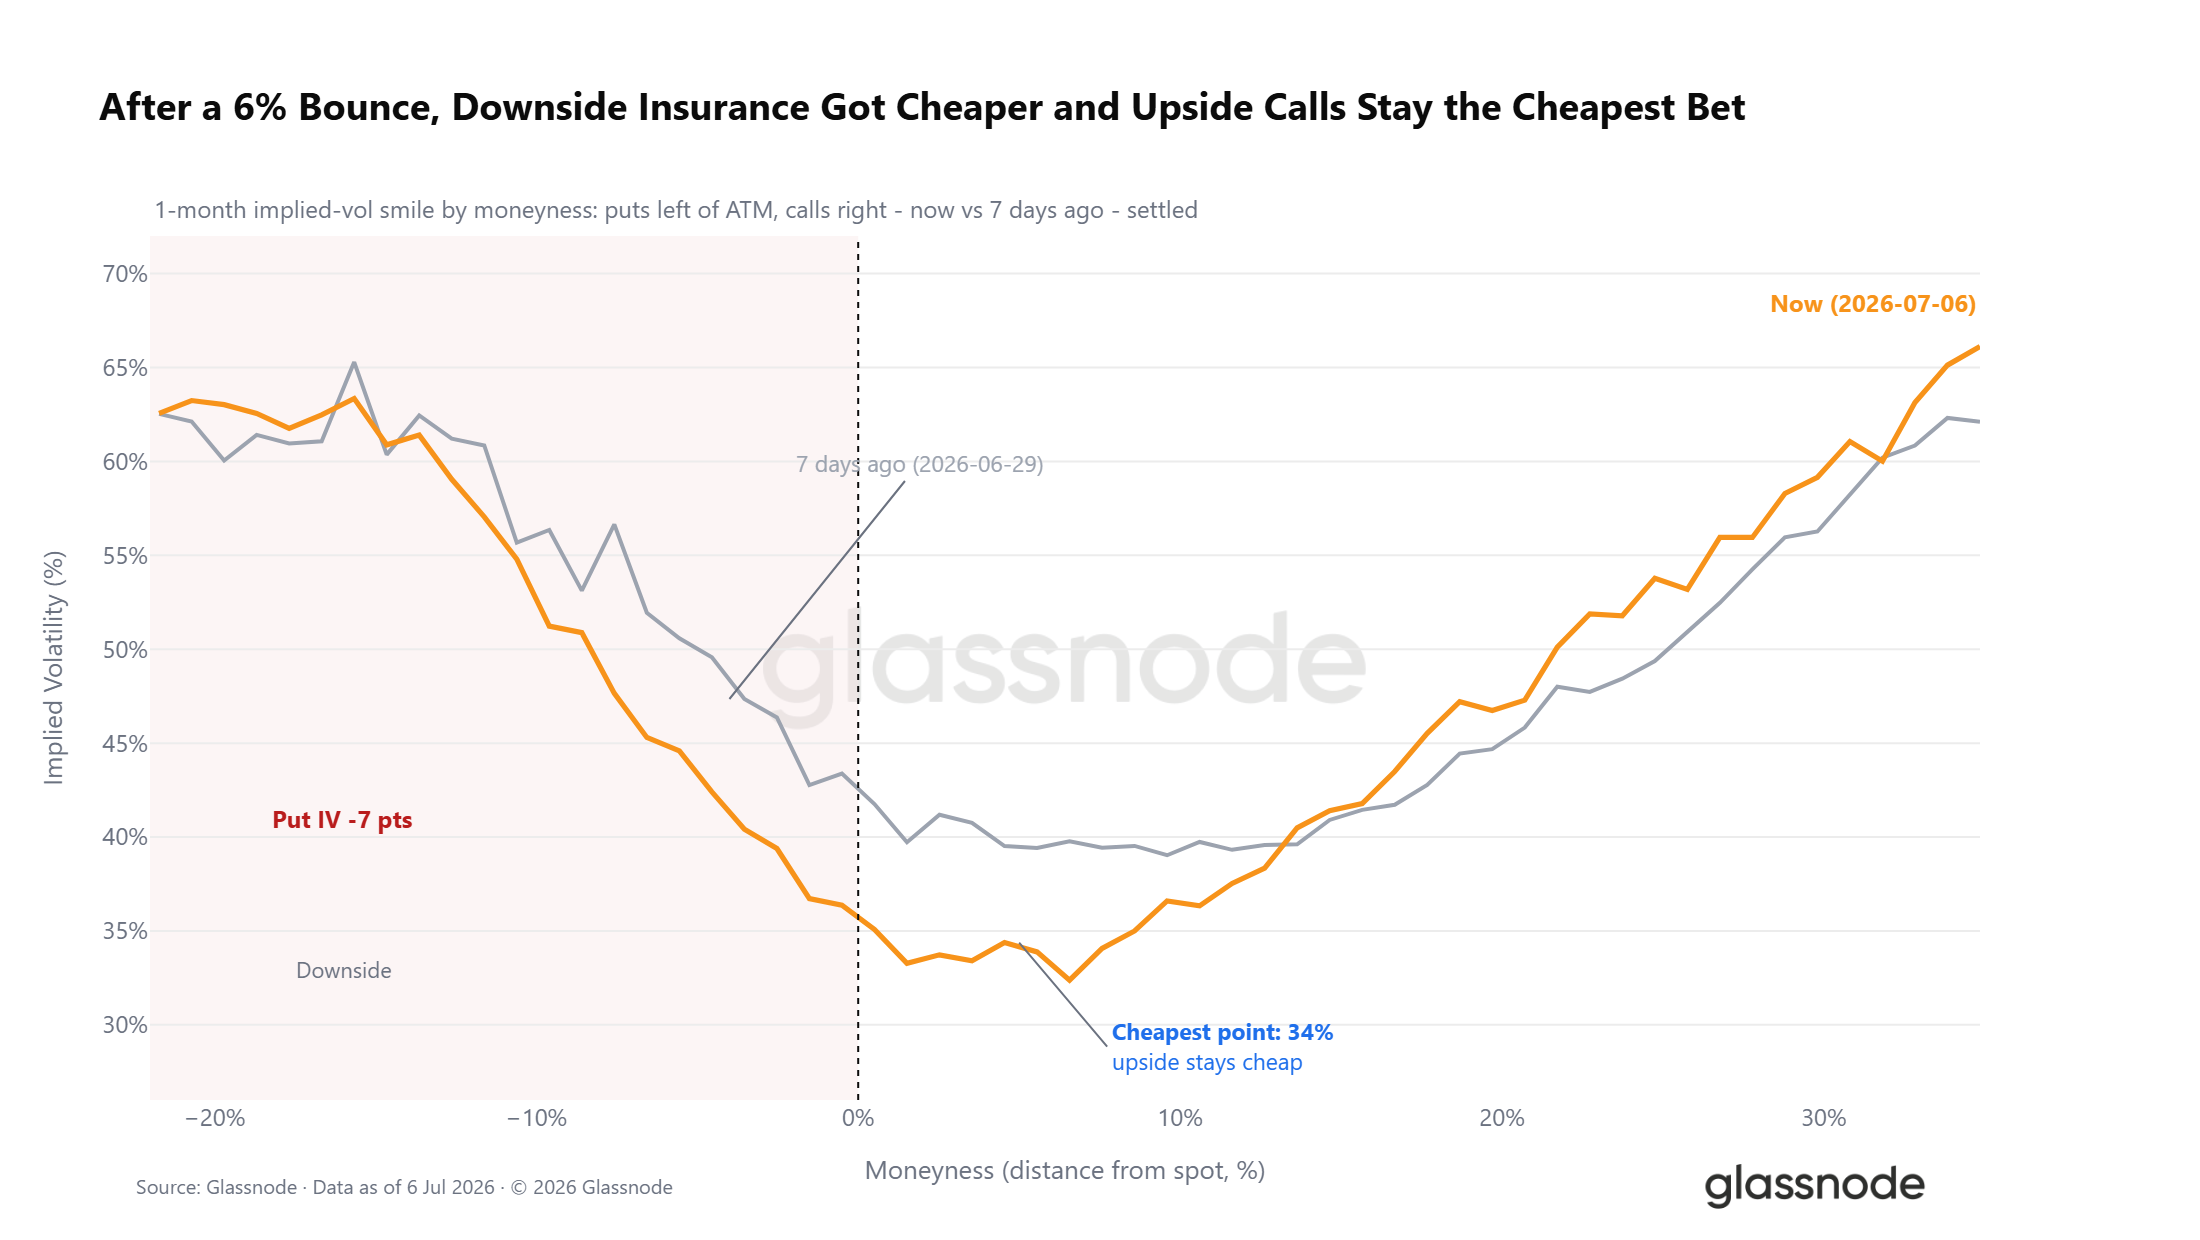
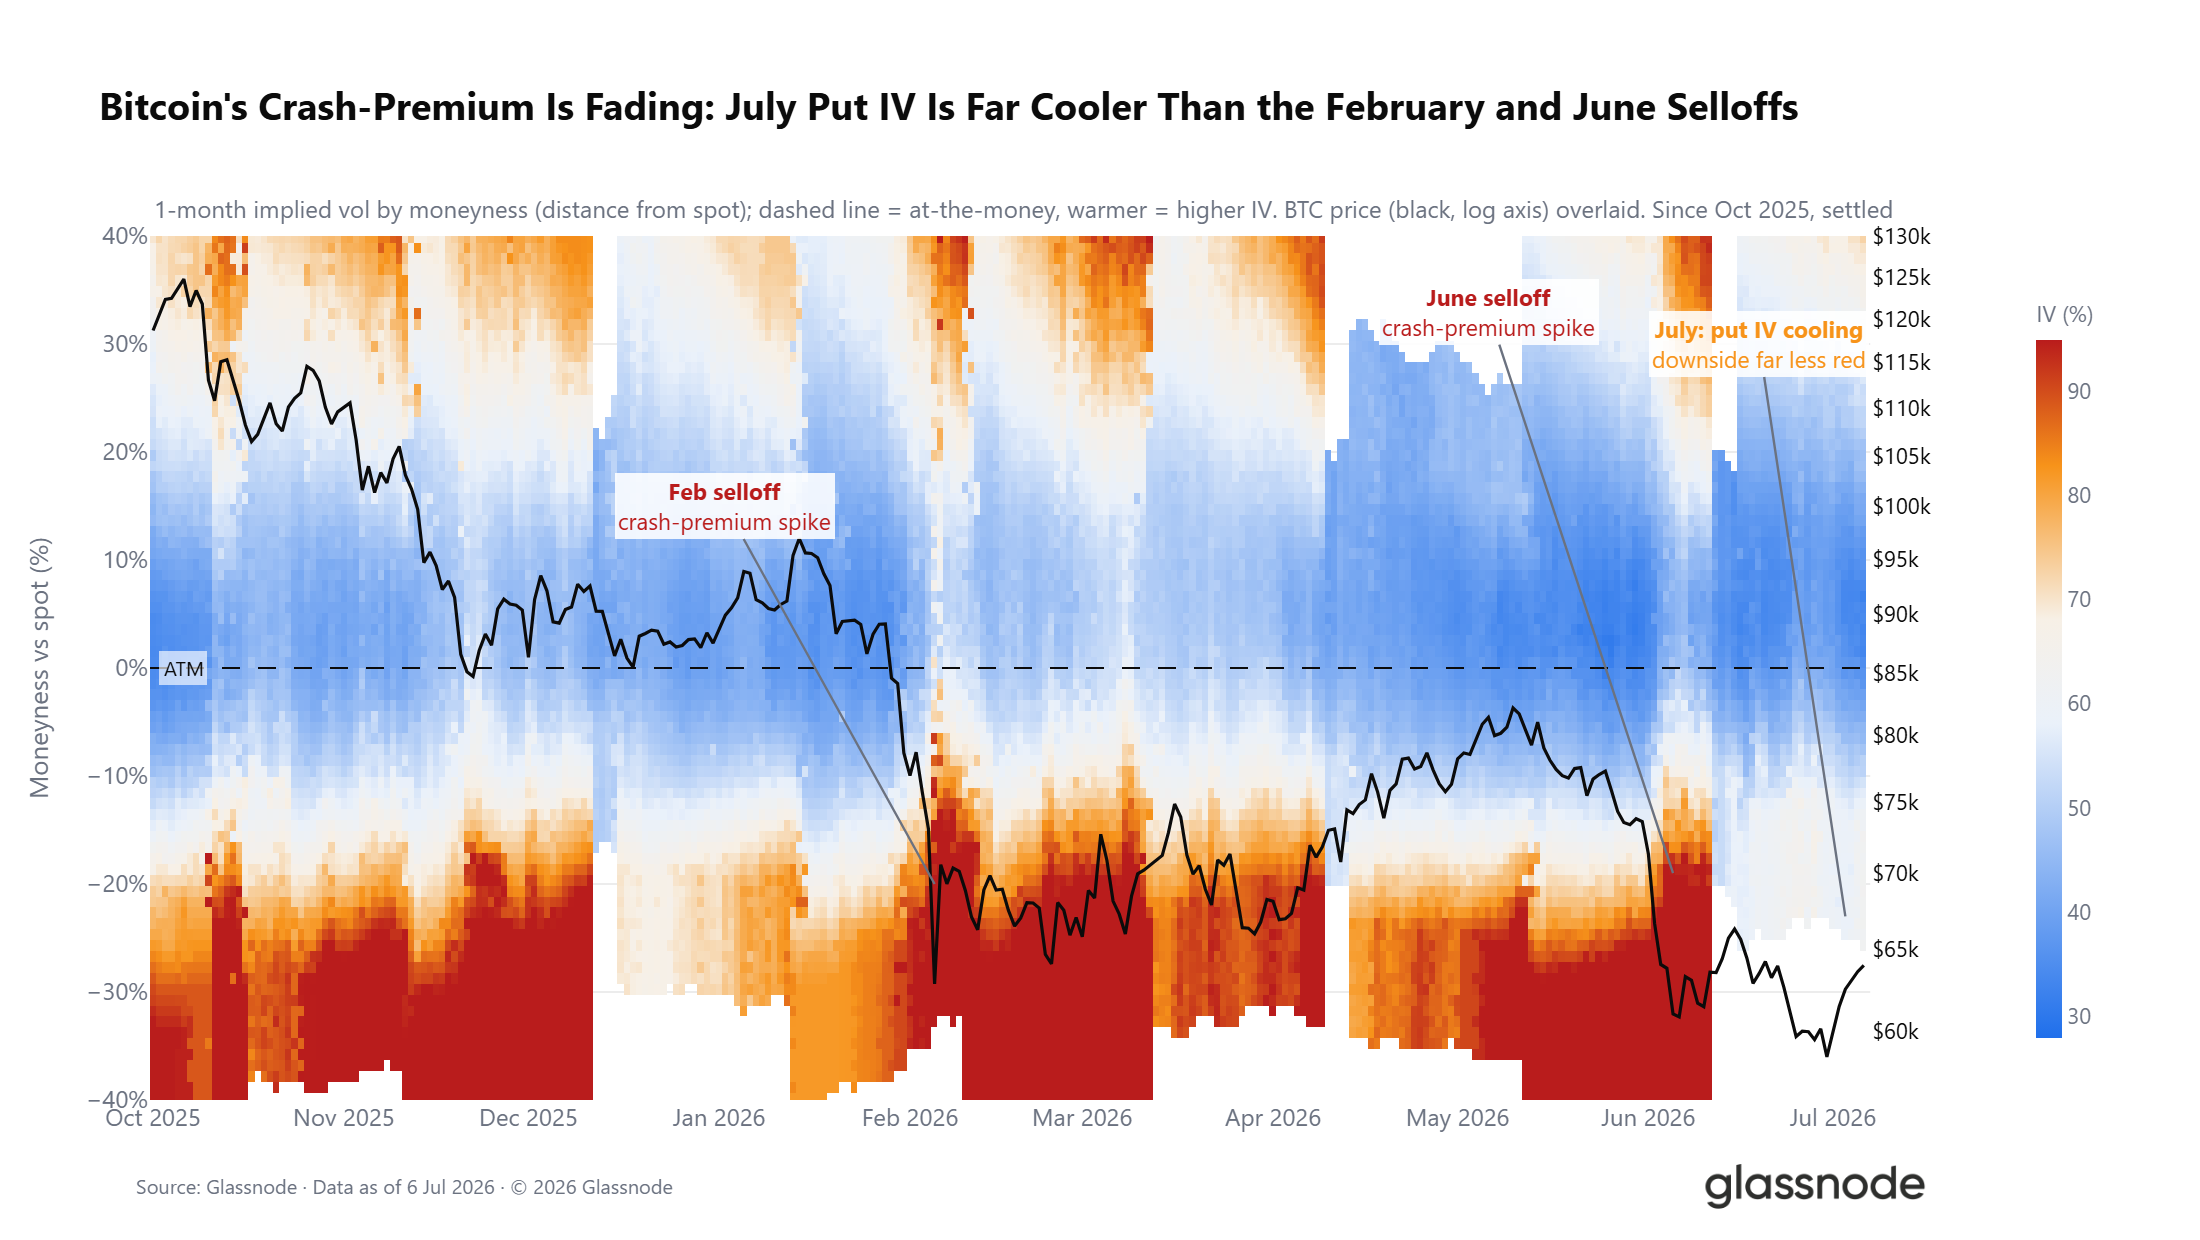
Overall defensive sentiment persists in the market, but the absolute cost traders pay for downside hedging has clearly decreased. This trend becomes more apparent over a longer timeframe: the volatility premium driven by extreme put hedging demand during the February and June sell-offs has gradually dissipated entering July. The DVOL volatility index has fallen to a 12-month low, marking the market's entry into a low volatility regime. While caution still dominates market psychology, hedging demand is progressively fading.
Summary
Synthesizing data across on-chain, off-chain, and derivatives dimensions, the market clearly exhibits characteristics typical of a late-stage bear market.
On-chain data shows a prolonged, five-month deep discount cycle. Daily stop-loss realization by long-term holders has spiked to $280 million, indicating a large-scale redistribution of coins is underway. However, a sustained decline in this stop-loss metric is a necessary precondition for a valid trend reversal.
Off-chain data shows ETF capital outflows have narrowed from their June peak, but the market remains in a net monthly outflow. Average daily trading volume is down 80% from the October 2025 peak, reflecting depressed institutional bullish conviction.
On the derivatives front, market positioning has shifted to cautiously bullish, with the put/call ratio hitting a new yearly low. However, volatility skew and the options surface continue to price in downside risk.
Considering all indicators, the foundational conditions required for a market bottom appear to be in place. However, the core signals confirming a definitive bottom have yet to materialize. The next phase of the market narrative hinges on meeting three key conditions: a sustained cooling of stop-loss pressure from long-term holders, stabilization of institutional capital flows, and the price effectively reclaiming and holding the Realized Price. Only upon the fulfillment of these conditions will the probability of a transition into a new bull cycle significantly increase.


