
Monera Digital|加密市場5月報:四大原因導致加密市場加速下跌
- 核心觀點:五月比特幣市場經歷了定價權兩次交接,先受宏觀因素壓制,後因內部資金失血主導下跌。月末宏觀環境轉好但幣市拒絕上漲,顯示內部出清已成核心拖累,市場處於深熊加速階段。
- 關鍵要素:
- 宏觀與地緣:美國通膨反彈及聯準會人事變動使市場定價轉向「被迫加息」,導致30年期美債收益率升至5.19%;月末地緣緩和後,比特幣與那斯達克相關性深度轉負,股市漲而幣市獨跌。
- 資金流出:比特幣現貨ETF全月淨流出24.25億美元,為歷史第三大單月流出;Coinbase溢價指數全程轉為負溢價,顯示美國機構系統性減配加密資產。
- 鏈上投降:短期持有者MVRV跌破1.0平衡線進入虧損區域,NUPL指標從「樂觀」區間回落至「希望-恐懼」邊緣,確認投降式停損。
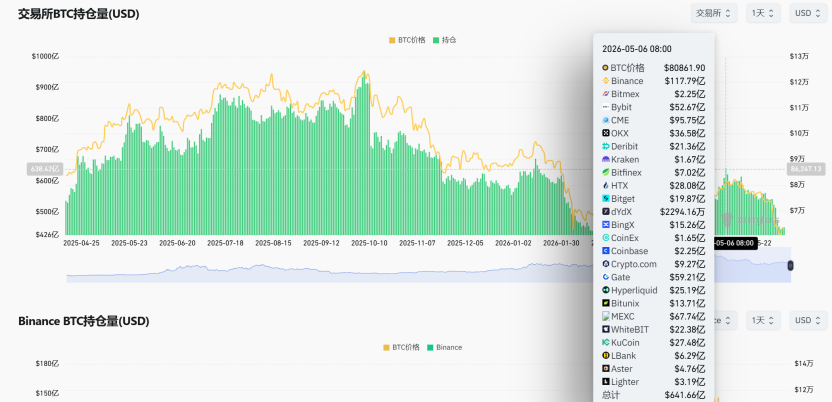
- 衍生品風險:未平倉合約逆勢增至640億美元以上,月末多頭爆倉3.07億美元(空頭僅0.9億),完成去槓桿。
- 關鍵防線失守:比特幣價格擊穿75,000-76,000美元的上市公司儲備成本線,且做市商伽瑪擠壓已觸發,導致順勢拋售。
- 週期價值區:200週移動平均線分位數降至10.2%,處於歷史底部價值區域,但歷史顯示從分位數觸底到價格反轉通常需3-6個月。
Core Conclusions
May witnessed a double handover of pricing power. First, the risk-free rate wrested pricing power back from crypto narratives, fully exposing Bitcoin's high-beta nature. Later, as both interest rates and geopolitical tensions eased towards the end of the month, capital outflows and holder capitulation within the crypto market took over price control.
In terms of price, BTC briefly surged to the $82,850 area at the beginning of the month, subsequently faced sustained downward pressure, and closed the month at $73,674, forming a unilateral downward trend. The most noteworthy period was the final week – the external environment had turned accommodative, yet the crypto market refused to respond. This is a textbook case of "liquidity transmission failure" and a quintessential example of the harshness of a deep bear market.
The simultaneous deterioration across three internal fronts within the crypto market was the true root cause of May's decline:
· First, a dual hemorrhage of new capital. BTC spot ETFs saw a net outflow of $2.425 billion for the month, the third-largest monthly outflow since the inception of BTC ETFs (only behind February 2025's $3.555 billion and November 2025's $3.481 billion), while stablecoin supply contracted concurrently.
· Second, capitulatory selling by holders. The short-term holder MVRV fell below the 1.0 breakeven line into loss territory, presenting a textbook capitulation pattern on-chain.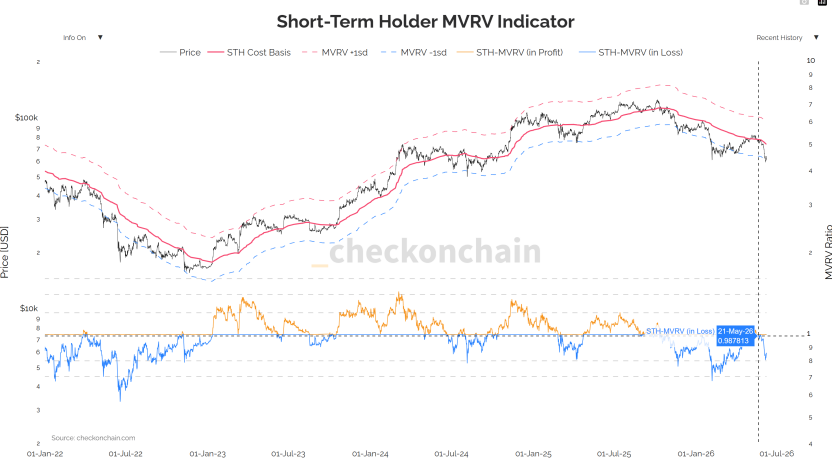
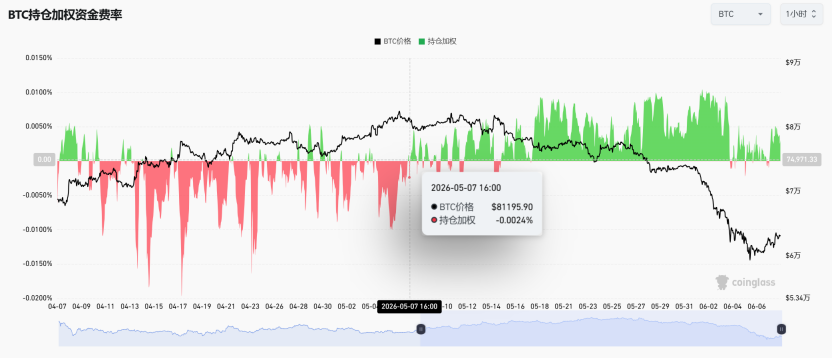
· Third, derivatives longs adding leverage against the trend. Open interest increased against the trend to over $64 billion, with funding rates turning positive, ultimately resulting in a brutal deleveraging process that saw $307 million in long liquidations (vs. only $90 million in short liquidations).
May marks the "initiation" of a new independent downtrend following the end of a rebound consolidation, and an "accelerated phase" of cyclical deep bear market cleansing. When it stops no longer depends on the macro environment, but on whether external capital inflow can stop the bleeding and whether long-term holder distribution can slow down.
1. Macro & Geopolitics: Pricing Power's Two Handovers, Transmission Broken in the Final Week
Phase One: Inflation Rebounds Again, Easing Expectations Dashed
The April CPI released on May 12th was the first inflection point of the month. Superficially moderate, the structure deteriorated – core services inflation (supercore) accelerated for the third consecutive month, representing the most sticky dimension directly tied to employment and wages. The following day, April PPI surged to 6.0%, hitting a new high since late 2022; simultaneously, China's PPI turned positive for the first time after 41 months of dormancy, ending the "Chinese goods deflation" tailwind that had suppressed global inflation for two years.
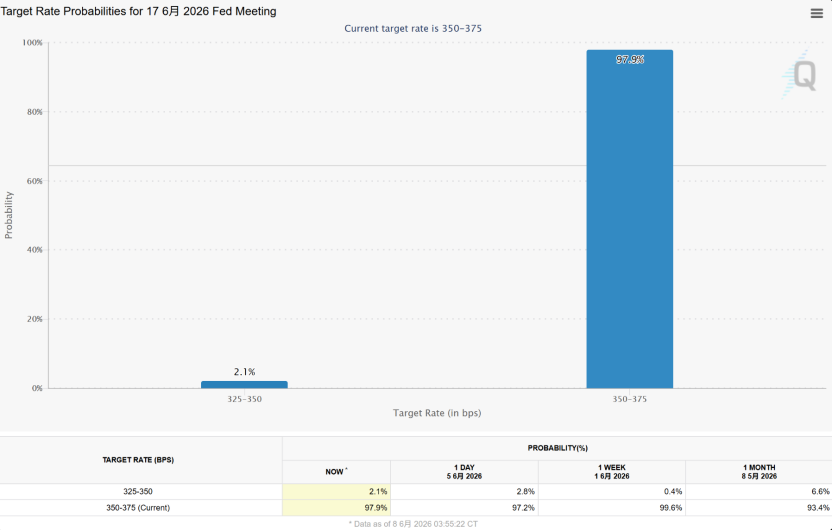
The market's focus underwent a paradigm shift: from "when will rates be cut" to "how much will rates be hiked." A clarification on timing is needed here – a rate hike at the upcoming meeting is virtually off the table (CME shows a >99.4% probability of no change in June), but the tail risk of the policy path has been significantly raised. The market no longer believes in automatic rate cuts, instead pricing in "forced hikes." This shift itself is sufficient to systematically raise the discount rate for all high-beta assets.
Phase Two: Fed Personnel Earthquake Destabilizes Reaction Function
On May 15th, reformist Warsh officially took the helm of the Fed, promoting a "de-transparency" agenda to abolish the dot plot and cancel press conferences. On the same day, the outgoing chair broke the Fed's 75-year precedent by announcing he would remain on the board until 2028 to provide internal checks and balances. This is the deepest power split within the Fed since 1951. Its market implication lies not in the policy debate itself, but in the significant decline in the predictability of the Fed's reaction function. The bond market responded directly: the 30-year Treasury yield pushed to 5.19%, a high not seen since the eve of the subprime crisis; the dollar index hit a six-week high. For assets valued by discounted cash flow, this is a direct and unresolvable blow.

Phase Three: Geopolitical Ice Breaks, but the Transmission Chain Is Broken
Geopolitics was the core disruptor for oil prices, and subsequently the inflation path, in May, following a four-stage pattern: "easing – fading – escalation – ice-breaking." Early-month easing statements caused WTI to fall over 7% in a single day, and BTC broke above $80,000 for the first time. Mid-month, US-Iran negotiations hit a stalemate. Late-month saw frequent conflict escalation, leaving Brent hovering around $107-111. The plot reversed at month-end – on May 28th, the US and Iran reached a 60-day truce memorandum, ensuring "unrestricted passage" through the Strait of Hormuz and Iran's removal of naval mines, largely digesting the geopolitical risk premium, with WTI closing at $88.53.
Entering the final week, the negative feedback loop from mid-month – "geopolitical tension → high oil prices → sticky inflation → rate hike expectations → stronger USD and bonds → risk asset pressure" – was abruptly interrupted: the 10-year Treasury yield fell ~11bps for the week to 4.45%, the Dollar Index dropped to 98.91; the S&P 500 rose 1.43% for the week, the Nasdaq gained 2.39% hitting consecutive closing highs, and the Nikkei surged over 1200 points in a single day. Conventionally, this combination of "lower rates, lower oil, lower dollar, higher equities" should have provided significant support for crypto, but the market refused to respond. This is a clear characteristic of crypto turning bearish.
The complete reset of correlations reinforces this point. Mid-month, risk appetite shifts in Asia (Korea's KOSPI triggered a circuit breaker with a 5% single-day drop) temporarily increased BTC's correlation with the Nasdaq. However, entering the late month, BTC's 30-day rolling correlation with the Nasdaq declined sharply and turned deeply negative, hitting a one-year low. The same macro tailwind directed towards completely different fates: stocks rallying together while crypto falls alone is empirical evidence of this deep negative correlation.

This decoupling has a dual meaning. Short-term, it objectively confirms "internal cleansing dominance" – crypto no longer moves in sync with macro risk appetite but is driven by its own funding flows and positioning structure. Medium-term, it implies that even if US stocks continue to hit new highs, their pulling power on crypto will be extremely limited. Still, a layer of medium-term vigilance is warranted: Goldman Sachs warns global visible oil inventories are only 73 days of demand; geopolitical easing does not mean oil prices have peaked. Concerns over inflation remain elevated. What is the impact on risk assets?
2. Capital Flows: Monthly ETF Reversal, Coinbase Premium Deteriorates
This is the most directionally significant part of the month and the most direct evidence of "internal bleeding."
Monthly ETF Flow: Complete Reversal from Net Inflow in April to Significant Net Outflow in May
Looking first at BTC spot ETFs. April saw a net inflow of $1.966 billion, pushing cumulative net inflows to a historical peak of $58.088 billion, with total net asset value breaking $100 billion for the first time, reaching $100.532 billion. In May, the flow completely reversed – a net outflow of $2.425 billion for the entire month, the third-largest single-month outflow since the product's inception, trailing only February 2025 (-$3.555 billion) and November 2025 (-$3.481 billion). Cumulative net inflows fell back to $55.663 billion, and total NAV shrank to $94.169 billion, evaporating over $6.4 billion in a single month.
The key point is that this escalated progressively within the month, not a one-time shock: cumulative net outflows were around $1.417 billion by mid-May, expanding further to the full-month outflow of $2.425 billion by month-end. Capital not only failed to stabilize but actually accelerated its flight at the end of the month.
ETH spot ETFs confirmed the same pattern: April still saw a net inflow of $356 million and total NAV of $13.253 billion; May turned into a net outflow of $541 million, also the third-largest monthly outflow in history (only behind November 2025's $1.424 billion and December's $617 million), with cumulative net inflows falling back to $11.37 billion and total NAV shrinking to $11.266 billion. Both BTC and ETH experienced net inflows in April and significant net outflows in May, each recording their respective third-largest monthly outflows. This signals a systematic deleveraging of the entire crypto asset class by institutions.
The conclusion is clear: The "ETF marginal buying" narrative that dominated the entire uptrend since the halving has effectively exited the stage in May. The most important incremental capital channel transformed from a "capital engine" in April to a "sucking pump" in May.
Coinbase Premium: From Predominantly Positive Premium in April to Severe Negative Premium in May
The Coinbase Premium Index is the most direct window to gauge spot buying and selling pressure from US domestic institutions. In April, the index was still predominantly in positive premium territory (green), indicating net buying by US institutions on most trading days, forming the spot-side foundation for April's rebound. Entering May, the index almost entirely turned into a negative premium (red), and the severity was acute – as seen in the chart, the negative premium zone continuously expanded, reaching extreme levels approaching -0.22%. This is one of the most persistent and deepest negative premium zones of the past year.
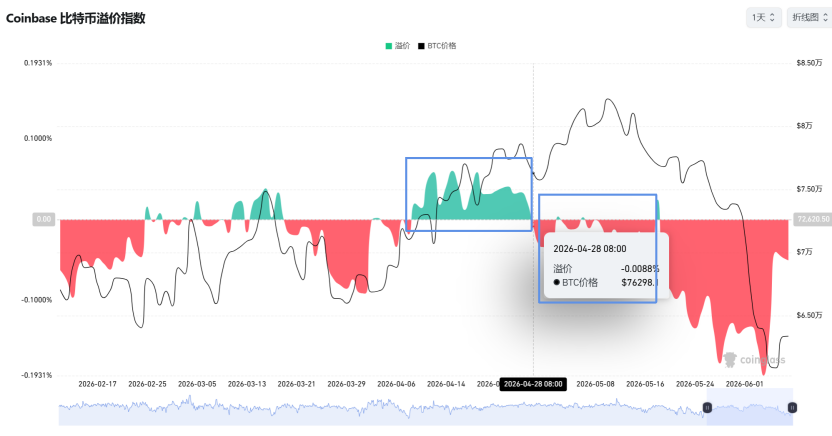
The inflection point where the premium turned from positive to negative aligns perfectly with the reversal rhythm of monthly ETF net outflows, mutually reinforcing each other. The core driver behind this is an asset reallocation led by relative yields – as the attractiveness of US Treasuries increased, US institutions were "voting with their feet," swapping BTC positions for Treasury positions. Intriguingly, at the end of the month, despite Treasury yields falling and the arbitrage incentive weakening significantly, the negative premium not only failed to repair but held steady. This indicates that institutional exit has moved beyond a simple "yield comparison" and includes a layer of confirmation of expectations for a downward crypto cycle.
The Divergence Between Futures and Spot
Concurrently with the ETF slowdown, CME open interest increased against the trend to over $64 billion. The market shifted from being driven by "spot absorption" to being driven by "futures positioning." The so-called "resilience above 80K" was, in essence, not real incremental capital but the extension of leveraged positions. It ultimately culminated in a brutal deleveraging event, with $307 million in long liquidations versus only $90 million in short liquidations in a single week.
3. On-Chain: Cost Basis Matrix Breached Across the Board, Capitulation Signal Confirmed
On-chain data paints an even more vivid picture of "internal cleansing."
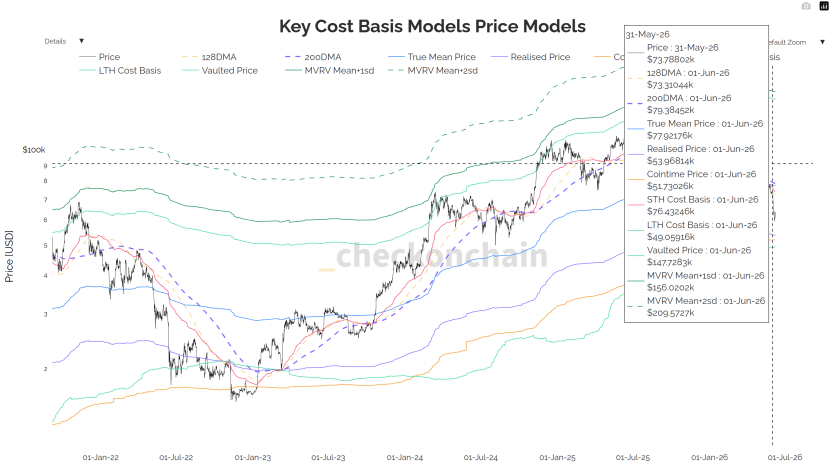
1. Realized Market Price & 200-Day MA: Never Held Steadily, Confirmed Loss
According to the Key Cost Basis Models chart, the Realized Market Price and the 200-day MA together form a bull-bear demarcation zone that has been repeatedly validated over the past three cycles, located in the 77–79K range in May. The early-month rally briefly reclaimed this zone but failed to hold. After breaking below it on May 18th, the zone was effectively lost. By month-end, prices were trading below this demarcation zone, finding tentative support at lower moving average levels. This key threshold has transformed from support beneath feet into "resistance clouds" overhead, with all short-term holders deeply underwater.
2. Realized Profit/Loss Ratio: Falls Instead of Rises
A 30-day SMA of this indicator above 1 signifies profit-taking dominance. It was 0.4 at the February 2026 low, and rose to 1.8 by mid-May – but confirming a bull market switch requires a sustained level above 2.0. The reality by month-end: it never even touched 2.0, instead falling back to 1.56. Each uptrend is met with selling pressure from early buyers looking to break even, rendering every rally short-lived.
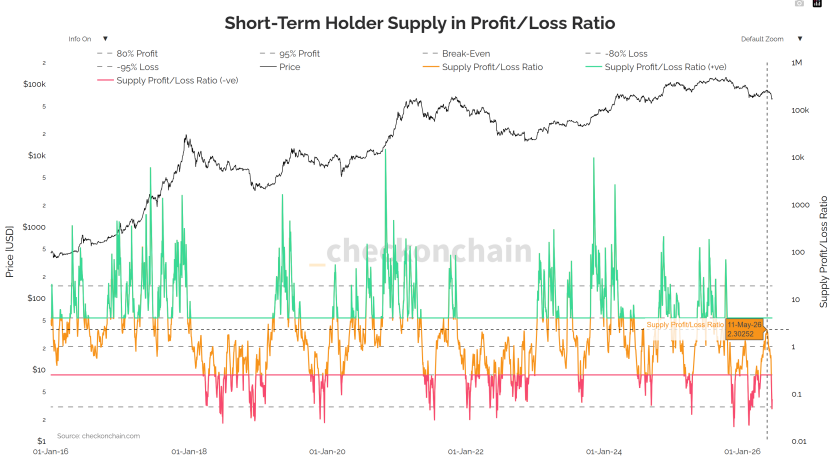
3. MVRV and NUPL: Capitulation Signal Confirmed
The STH-MVRV chart clearly shows the ratio has broken below the 1.0 breakeven line into loss territory – this is an objective measure of "overall loss for short-term holders" and one of the most identifiable capitulation signals in past deep corrections. The NUPL indicator (Net Unrealized Profit/Loss) concurrently confirms the deterioration in sentiment: as seen in the chart, NUPL has significantly retreated from the "Optimism – Belief" zone (blue-green) at the start of the year to the edge of the "Hope – Fear" zone (orange), approaching the critical transition zone seen before the bottom of the 2022 bear market. This is an objective measure of the continuous compression of market unrealized profit space and the structural decline in risk appetite.


4. Derivatives & Corporate Reserves: Leverage Cleansing and the 75K Psychological Line
1. Market Maker Gamma & Expiry Date Effects
Price stability in the first half of the month came from market makers' long gamma. BTC oscillated narrowly within the 80K range, not due to real supply-demand balance, but because market makers held significant long gamma, acting as a mechanical "price stabilizer" – selling on rallies, buying on dips, actively compressing volatility. This is precisely why, despite the CPI blowout and geopolitical tensions, BTC's actual volatility continued to decline (30D RV fell to 27%).
The consecutive roll-off of two expiry dates directly altered the market structure. The monthly expiry on May 15th saw over $40 billion in notional value cleared from IBIT alone. After this massive position rolled off, market makers' stabilizing capacity waned, and on May 18th, BTC broke below 77.5K. On May 29th, the second and more critical monthly expiry saw approximately $75 billion in centralized clearing across the market. Prior to the expiry, the spot price had already broken through the 75K max pain and maximum short gamma zone, causing passive short hedging flows that further intensified selling pressure at month-end.
2. 75K Trap Triggered
The largest cluster of short gamma is locked in the 75K–76K range (over $8 billion in negative gamma). Once prices fall into this zone, market makers' hedging reverses, turning into trend-following selling, creating a downward gamma squeeze. The reality by month-end is that this trap has been triggered, simultaneously breaking through the psychological cost floor of listed companies' BTC reserve strategies. Only one line of defense remains in this three-tiered resonance – the deeper cyclical accumulation cost basis.
3. Skew Defensive Intent Continues to Rise
1M Skew expanded from +2.7% at the start of the month to +6.2% on the breakdown day, while 6M Skew maintained a high level of +10%. This indicates institutions are hedging not just short-term events but constructing structural downside protection for the entire second half of


