






Gate 研究院:6 月市场结构性回调,资金集中于脉冲式放量机会


- มุมมองหลัก: ตลาดคริปโทในเดือนมิถุนายน 2026 เผชิญกับการปรับฐานอย่างเป็นระบบ โดยเจ็ดในสิบของโทเค็นปรับตัวลดลง แต่สินทรัพย์ไม่กี่รายการที่ขับเคลื่อนโดยเหตุการณ์เฉพาะและมีมูลค่าตลาดต่ำกลับมีกำไรอย่างรุนแรง ส่งผลให้ค่าเฉลี่ยของตลาดบิดเบือน โครงสร้างตลาดมีลักษณะ "การลดลงในวงกว้าง" ควบคู่ไปกับ "การเก็งกำไรเฉพาะจุด" ซึ่งยังไม่เข้าสู่ระยะฟื้นตัวเต็มรูปแบบ
- ปัจจัยสำคัญ:
- ตลาดโดยรวมอยู่ภายใต้แรงกดดัน: BTC และ ETH ปรับตัวลดลงมากกว่า 20% ในรอบเดือน มูลค่าตลาดรวมของคริปโทเคอร์เรนซีลดลง 15.74% ภายในเดือน BTC ปิดสิ้นเดือนที่ประมาณ 58,519 ดอลลาร์สหรัฐ ใกล้เคียงกับระดับต่ำสุดของปี กองทุน ETF แบบ Spot ยังคงมีกระแสเงินทุนไหลออกสุทธิ โดยประมาณ 5-6 พันล้านดอลลาร์สหรัฐในช่วงหกสัปดาห์
- การลดลงเป็นวงกว้างแต่มีความแตกต่างสูง: จากกลุ่มตัวอย่าง 500 อันดับแรก 70.99% ของโทเค็นปรับตัวลดลง โดยค่ามัธยฐานของการลดลงอยู่ที่ -11.28% แต่ค่าเฉลี่ยของกลุ่มตัวอย่างทั้งหมดกลับเป็นบวกเล็กน้อย เนื่องจากผลของสินทรัพย์ที่ผิดปกติอย่าง CYDX (+35,729%) และ ANSEM (+23,901%) ซึ่งเป็นลักษณะ "ค่าเฉลี่ยที่บิดเบือน" โดยทั่วไป
- สินทรัพย์หลักก็ไม่รอดเช่นกัน: จาก 100 สินทรัพย์ที่มีมูลค่าตลาดสูงสุด มี 73 รายการที่ปรับตัวลดลง โดย ADA (-38.06%) และ BCH (-33.65%) มีการลดลงอย่างมีนัยสำคัญ สินทรัพย์ชั้นนำไม่สามารถทำหน้าที่เป็นแหล่งหลบภัยได้ SOL (-8.81%) มีผลงานที่ค่อนข้างแข็งแกร่งเมื่อเทียบกับตัวอื่น
- โครงสร้างปริมาณการซื้อขายมีความแตกต่าง: โทเค็นส่วนใหญ่ไม่มีปริมาณการซื้อขายเพิ่มขึ้น (ค่ามัธยฐานอยู่ที่ 0.49 เท่าเท่านั้น) มีเพียง 8 โทเค็นที่มีปริมาณการซื้อขายเพิ่มขึ้นมากกว่า 10 เท่า กรณีที่แข็งแกร่งซึ่งทั้งราคาและปริมาณเพิ่มขึ้น (เช่น CX, VELVET, SYN) ปรากฏอยู่ร่วมกับสัญญาณเตือนของปริมาณที่เพิ่มขึ้นแต่ราคาลดลง (เช่น ELF, CELO)
- ภาพรวมทางเศรษฐกิจมหภาคและกระแสเงินทุนเป็นลบ: ท่าที Hawkish ของประธานธนาคารกลางสหรัฐคนใหม่ทำให้ความคาดหวังในการลดดอกเบี้ยลดลง ประกอบกับความเสี่ยงทางภูมิรัฐศาสตร์ ส่งผลให้เงินทุนไหลออกจากสินทรัพย์คริปโทไปสู่ภาคส่วนต่างๆ เช่น AI และเซมิคอนดักเตอร์ มูลค่ารวมที่ถูกล็อค (TVL) ใน DeFi ลดลง 12.1% ในรอบเดือนเหลือ 70.4 พันล้านดอลลาร์สหรัฐ ในขณะที่มูลค่าตลาดของ Stablecoin ทรงตัวในระดับสูง ซึ่งบ่งชี้ว่านักลงทุนมีท่าทีรอดูสถานการณ์
Abstract
• In June 2026, the crypto market failed to sustain the corrective rebound seen in May. BTC and ETH fell by over 20% monthly, with other major assets like BNB, XRP, DOGE, and ADA also under pressure, indicating this pullback represents a systemic contraction in overall market risk appetite.
• This month's market is characterized by "broad declines, strong differentiation, and distorted averages." Among the valid Top 500 samples, 126 tokens rose, 350 fell, and 17 remained roughly flat, with declining tokens accounting for 70.99%.
• From a market cap stratification perspective, the Top 1–100 saw an average decline of -8.35% (median -9.17%), while the Top 401–500 averaged -11.09% (median -16.67%). Although the average for the Rank 201–400 range was significantly inflated by extreme outliers like CYDX and ANSEM, the majority of tokens still declined, presenting a typical structure of "a few extreme rallies masking widespread declines."
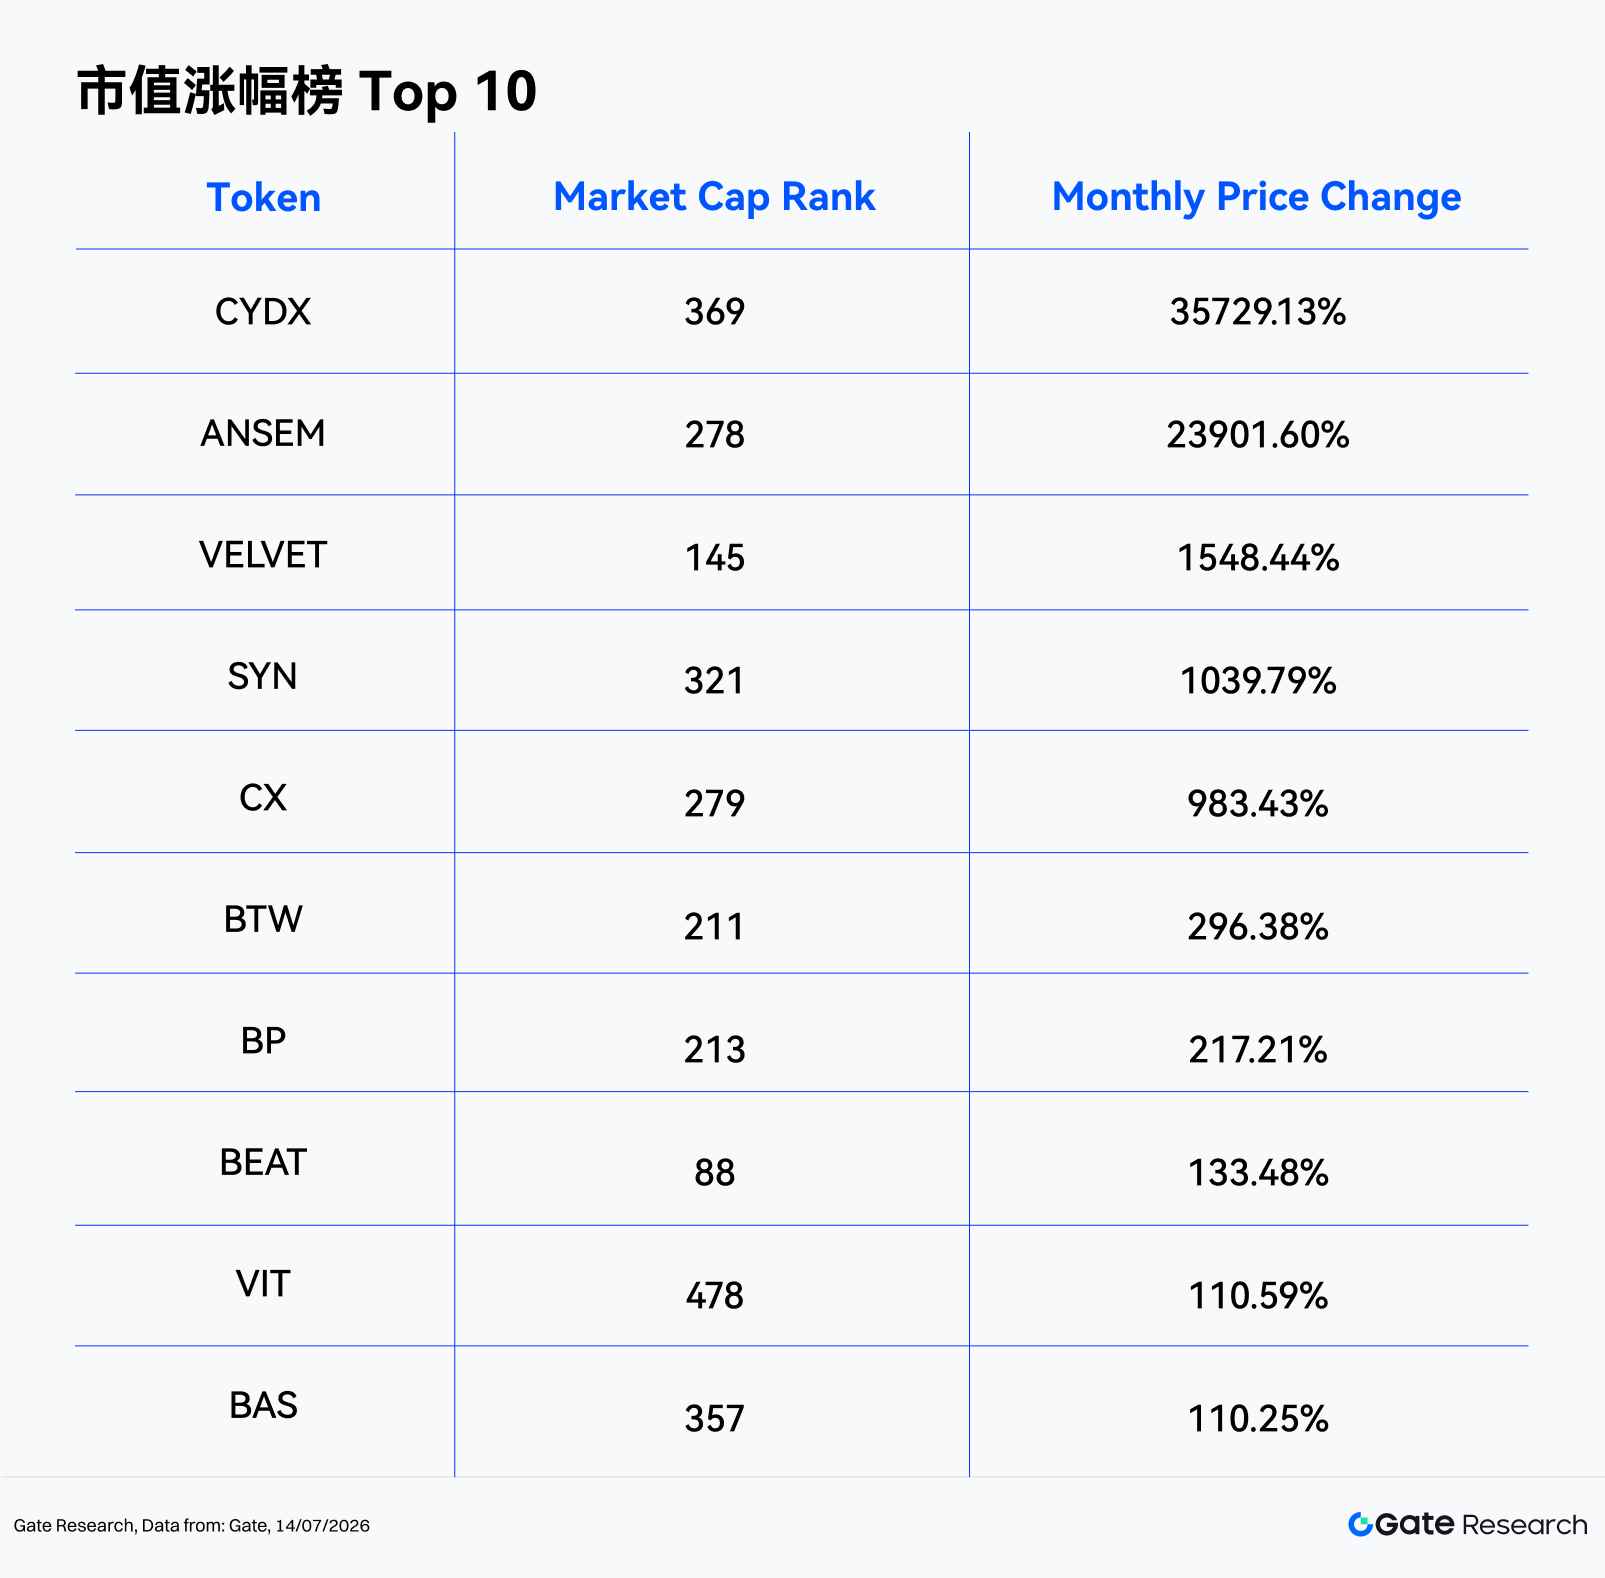
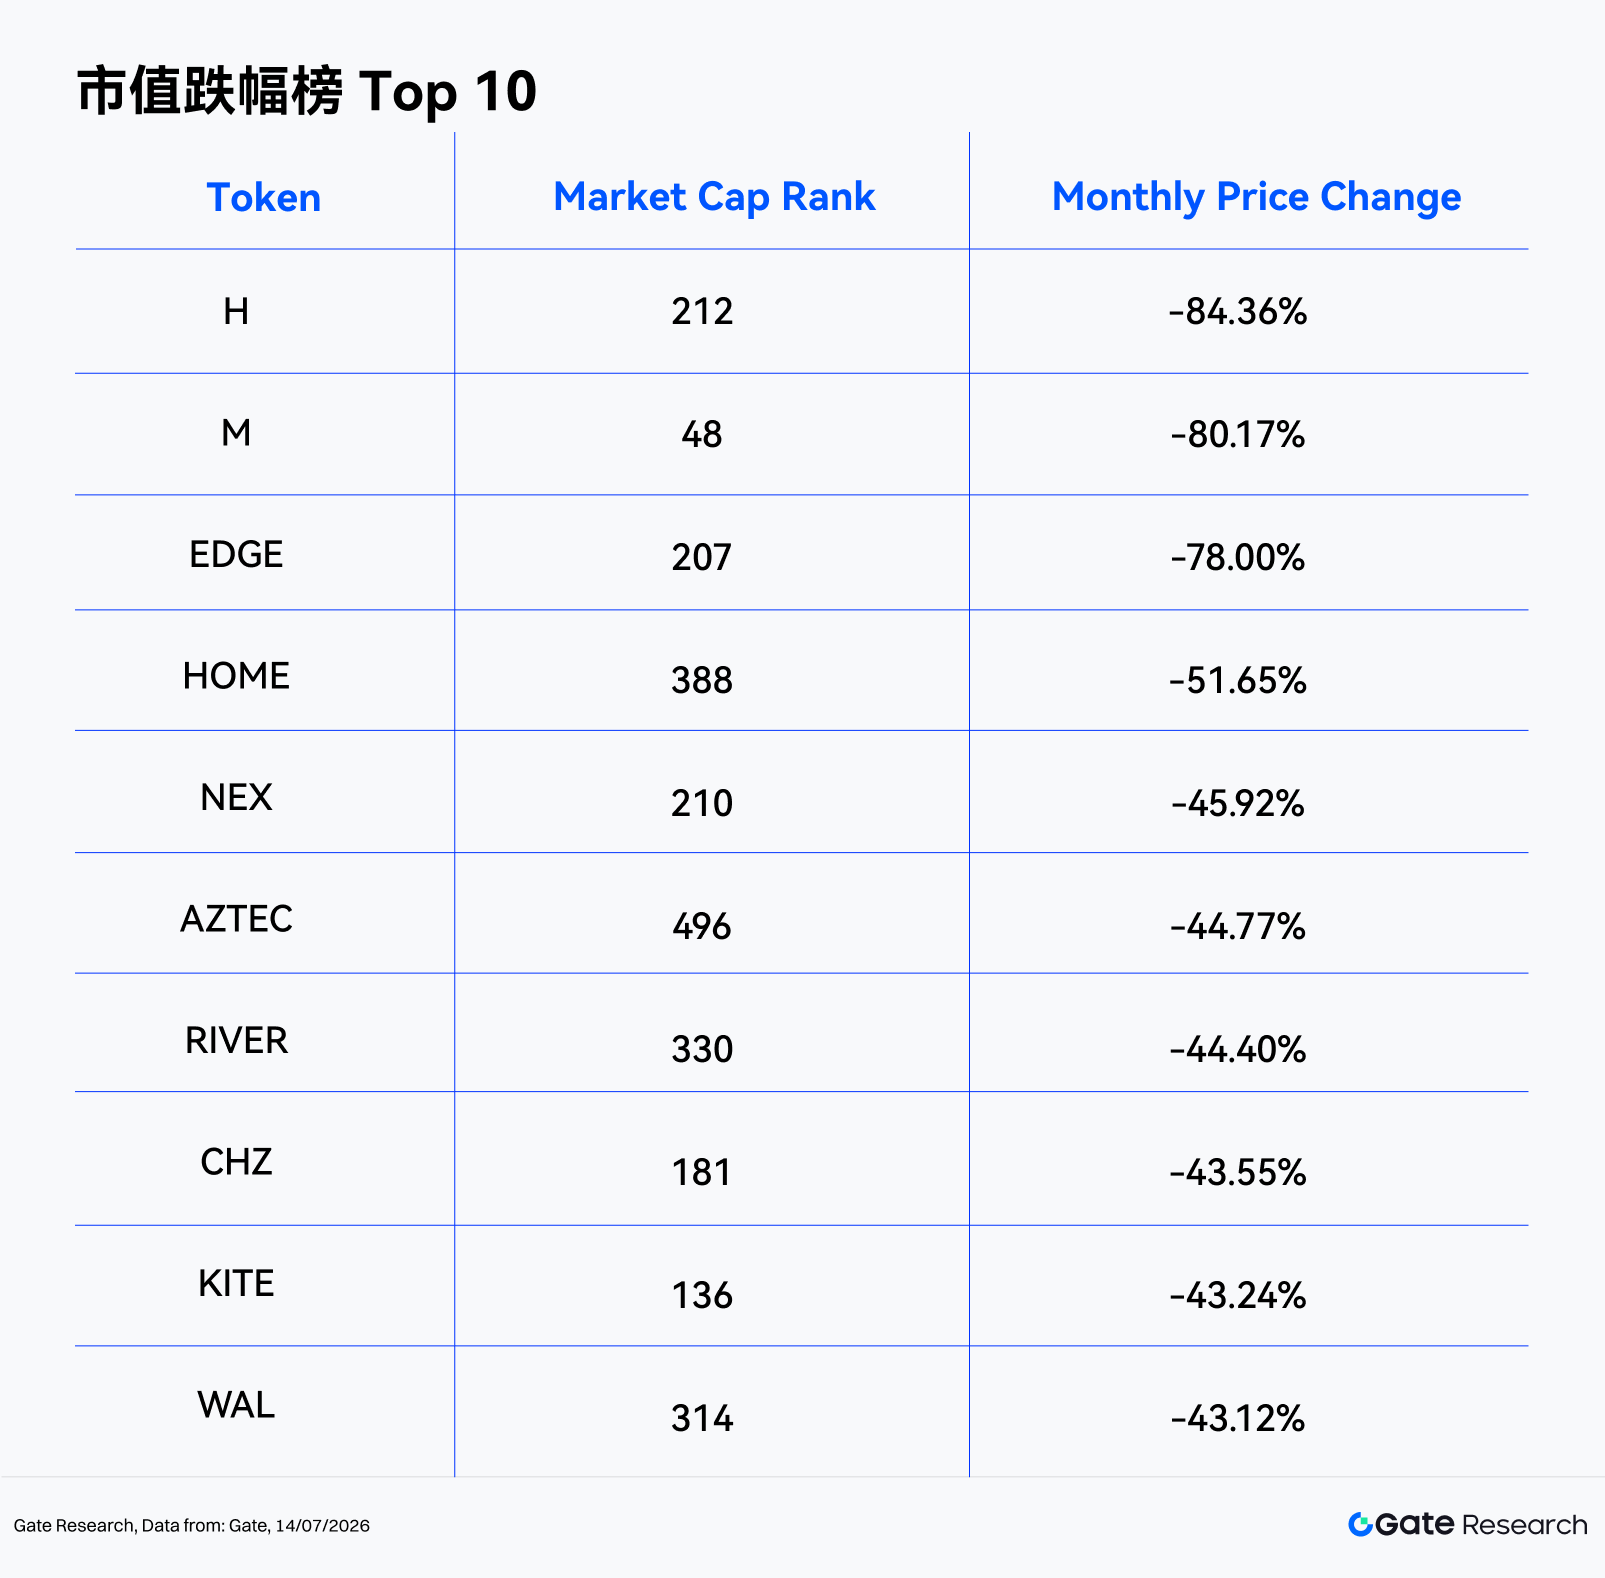
• The gainers' list was dominated by low-cap, high-volatility, event-driven tokens, led by CYDX (+35,729.13%), ANSEM (+23,901.60%), and VELVET (+1,548.44%). Conversely, the losers' list featured tokens facing liquidity evaporation, cooling narratives from earlier periods, or a lack of fresh catalysts, with H (-84.36%) and M (-80.17%) posting the deepest losses.
• In terms of volume, the average Volume Spike for 450 valid samples was 2.54x, with a median of only 0.49x. Only 17 tokens saw volume spikes exceeding 3x, and 8 tokens exceeded 10x. TEMPLE (289.05x), CX (259.13x), and MTBILL (128.15x) topped the volume spike list. Among them, CX, VELVET, and SYN represent strong cases of "rising volume and price," while ELF and CELO experienced "volume spikes with price declines," warranting caution regarding potential distribution or liquidity pressure.
1. Crypto Market Snapshot
The global crypto market weakened again in June 2026 after a tentative recovery in May. Total market capitalization declined from approximately $2.56T on June 1st to around $2.16T on June 30th, a monthly retracement of 15.74%. The monthly high occurred on June 1st and the low on June 29th, indicating market pressure persisted throughout most of the month, with only limited signs of stabilization emerging towards the end.
BTC declined steadily from around $73,570 at the start of the month, hitting a monthly low near $58,189, and closing at approximately $58,519 – a monthly decline of roughly -20.5%, bringing its price back near lows not seen since 2024. Market risk appetite cooled significantly, with capital continuing to flow from crypto assets towards AI, semiconductors, and potential large-scale IPOs. The correlation between BTC and US tech risk assets shifted from a supporting factor in May to a suppressing factor in June. Spot BTC ETFs continued to face net outflows, with public reports indicating consecutive outflows from major products from late May to early June. Notably, IBIT saw outflows of approximately $3.1B from May 18 to June 3, contributing to total outflows of around $5B–$6B from Bitcoin funds over six weeks. Institutional capital signals evolved from "net buying early, net selling late" in May to sustained position reduction and risk aversion in June.
Macro-wise, the market narrative in June shifted from "weakening USD and risk recovery" to "high interest rate expectations, geopolitical risks, and risk asset repricing." The newly appointed Fed Chair Warsh's hawkish policy stance dampened rate cut expectations. Combined with the phase cooling of the AI trade, escalating geopolitical tensions, and stronger-than-expected US employment data, long-end interest rates and USD pressure increased. Crypto assets, as high-beta risk assets, came under pressure. On the regulatory front, although the CLARITY Act continued to be discussed as a core framework for digital asset market structure reform, its prospects for passage within the year remain uncertain. The marginal support from regulatory tailwinds for market sentiment was clearly weaker compared to capital outflows and macro pressures.
On-chain, according to DeFiLlama data, total DeFi TVL across all chains fell from approximately $80.1B at the end of May to about $70.4B on June 30th, a monthly decline of roughly -12.1%. This shows that the decline in mainstream asset prices led to a passive contraction in locked collateral assets. The total stablecoin market cap remained elevated above $300B, standing at around $311.7B by mid-July, with USDT accounting for approximately $184.2B (roughly 60% market share). This suggests that on-exchange cash has not fled en masse but is leaning towards a wait-and-see, risk-off allocation. For DEX spot trading, DeFiLlama reported total monthly DEX volume across all chains for June at approximately $222.7B, averaging about $7.4B per day, maintaining a certain level of activity despite the market downturn. However, the composition of trading volume continued to tilt towards leverage and event-driven activities. On-chain perpetual contract platforms like Hyperliquid sustained high engagement during June's geopolitical conflicts and high volatility, even seeing temporary volume spikes in contracts related to SpaceX and oil prices, highlighting that on-chain derivatives have become the primary venue for speculation and risk transfer during this downturn.
2. Overview of Gains and Losses Data
Major assets declined broadly. BTC and ETH fell by over 20%, while BNB and XRP dropped -21.14% and -20.54%, respectively. In comparison, SOL showed relative resilience with a decline of -8.81%. However, DOGE (-26.85%), ADA (-38.06%), BCH (-33.65%), and XLM (-32.70%) experienced significant drops, indicating that high-beta mainstream assets bore the brunt of the risk-off shift.
Unlike the "corrective rebound" in May, the core characteristic of June's market was the coexistence of broad-based declines and localized speculative spikes. On one hand, stablecoins and a few RWA/Yield assets remained relatively stable. On the other hand, extreme rallies like CYDX, ANSEM, and VELVET still occurred among small to mid-cap tokens. The market hasn't entirely lost short-term trading opportunities, but these opportunities stem more from low-liquidity, strongly event-driven, short-cycle capital games rather than a broad Beta recovery.
The overall market this month is characterized by "broad declines, strong differentiation, and distorted averages." Among the 493 valid sample tokens, 126 rose, 350 fell, and 17 remained roughly flat. The proportion of advancing tokens was only 25.56%, while declining tokens accounted for 70.99%.
• Market Cap Top 1–100: This tier has the strongest liquidity, but it did not provide effective defense in June. Blue-chip assets weakened in tandem, significantly dragging down overall risk appetite. Structural highlights mainly came from a few tokens like BEAT (+133.5%), ADI (+50.9%), LIT (+35.8%), DEXE (+22.1%), and WLD (+20.9%). Decliners were represented by M (-80.2%), ADA (-38.1%), MNT (-35.6%), BCH (-33.7%), and XLM (-32.7%), illustrating intense differentiation even within top-tier assets.
• Market Cap 101–200: The median was -11.10%, but the average was pushed up to +5.80% due to the extreme rally of VELVET (+1,548.4%). The true performance of this tier was significantly weaker than the average suggests. Aside from VELVET, GWEI (+63.3%), LAB (+54.0%), and JTO (+43.3%) contributed the main positive returns. On the downside, CHZ (-43.6%), KITE (-43.2%), and IOTA (-42.2%) saw deep declines, indicating that mid-to-high cap projects without fresh catalysts still face significant valuation correction pressure.
• Market Cap 201–300: The median was -7.75%, but the average was inflated to +249.59% by extreme rallies in ANSEM (+23,901.6%), CX (+983.4%), BTW (+296.4%), and BP (+217.2%). This range is a core source of average distortion in June, with a few tail-end tokens contributing the vast majority of positive returns. However, deep corrections like H (-84.4%), EDGE (-78.0%), and NEX (-45.9%) were also concentrated here.
• Market Cap 301–400: The median was -11.90%, but the average jumped to +369.65% due to anomalous surges in CYDX (+35,729.1%), SYN (+1,039.8%), BAS (+110.3%), MAGMA (+70.9%), and MWC (+55.1%). The structure of this tier is the most unbalanced: extreme gains significantly skew the average, while tokens like HOME (-51.7%), RIVER (-44.4%), and WAL (-43.1%) highlight the pronounced downside tail risk associated with liquidity ebbing.
• Market Cap 401–500: This tier had the weakest median performance among all groups. Although VIT (+110.6%), DEGEN (+68.7%), and NAT (+36.9%) offered some local resilience, declines like AZTEC (-44.8%), DEEP (-42.0%), and PURR (-39.5%) were also significant.
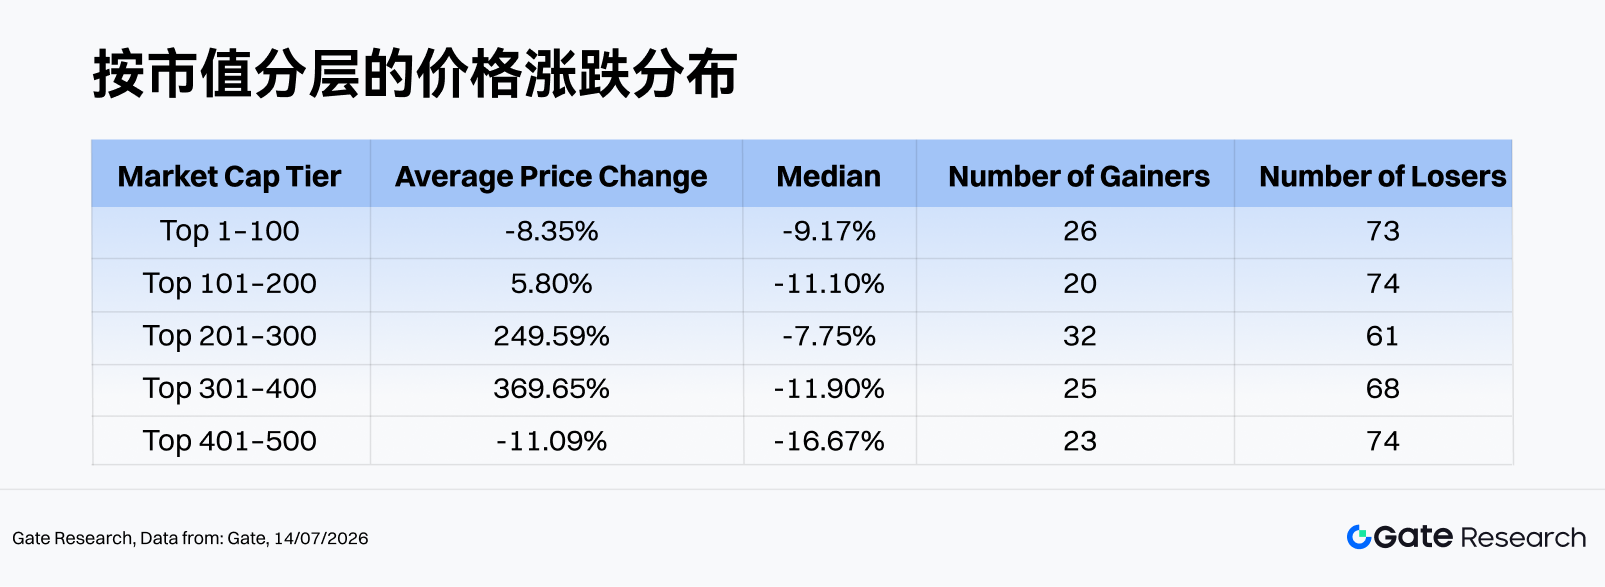
Note: The market cap distribution is based on CoinGecko data. Tokens ranked in the top 500 by market cap are grouped in blocks of 100 (e.g., Rank 1–100, 101–200, etc.). The price change for each token from June 1, 2026, to June 30, 2026, is calculated, and the average for each group is derived as the average gain indicator for that market cap range. The full-text gain/loss table primarily uses daily open/close prices, which may deviate from hourly averages or intraday extremes. For tokens with extremely low unit prices, tick noise can lead to distorted gains of several thousand times, which have been excluded when calculating the averages.
2.1 Top Gainers and Losers
2.1.1 Gainers: Extreme Tails Dominate the Average
June's gainers' list was highly concentrated among low-cap and mid-to-low rank tokens. CYDX ranked first with +35,729.13%, followed by ANSEM with +23,901.60%. Both represent extreme event-driven moves, significantly impacting the overall sample average. VELVET (+1,548.44%), SYN (+1,039.79%), and CX (+983.43%) also exhibited clear impulsive spike characteristics.
SYN (+1,039.8%, Market Cap Rank 321), operating in the cross-chain interoperability and bridging protocol space, benefited from the renewed heating up of the cross-chain infrastructure narrative in June, creating a classic "low-cap + strong turnover + narrative rotation" rally. Given Synapse's clear application in cross-chain asset transfers, capital in a weak market tends to view it as a catch-up play within infrastructure. However, after such a significant short-term run-up, attention must be paid to profit-taking pressure.
BP (+217.2%, Market Cap Rank 213) is an asset related to the Backpack ecosystem. Driven by narratives around exchanges, wallets, and consumer-grade crypto entry points, it attracted substantial capital attention during the month. Compared to pure Meme tokens, BP possesses a clearer imagination space for a platform-style ecosystem. However, its market cap rank is still in the mid-to-late stage, implying high liquidity elasticity. Its price increase was more driven by concentrated capital inflow. Whether it can sustain depends on continued growth in Backpack's user base, transaction activity, and the ongoing delivery of token utility.
Looking at the distribution, only BEAT among the top ten gainers was in the Top 100 market cap rank; the rest were mostly ranked 200 or below. This indicates that June's market lacked a trend driven by blue-chip assets, with capital preferring high-odds speculation on smaller-cap tokens. While offering extremely high short-term elasticity, such rallies typically carry risks like insufficient order book depth, slippage, and rapid reversals.
2.1.2 Losers: Liquidity Ebb and Narrative Cooling
The losers' list also displays pronounced tail-risk characteristics. H (-84.36%), M (-80.17%), and EDGE (-78.00%) experienced the deepest declines, while HOME, NEX, AZTEC, RIVER, CHZ, KITE, and WAL also saw retracements over 40%. Notably, M is in the Top 100, indicating that this pullback wasn't limited to small-cap assets; some relatively high-cap projects also faced concentrated selling pressure.
M (-80.2%, Market Cap Rank 48), a MemeCore ecosystem token, suffered the most event-impacted decline this month. This token experienced a flash crash of approximately 70% within a short period. Simultaneously, market doubts arose regarding insider manipulation, liquidity structure, and exchange due diligence, leading to a rapid loss of investor confidence. Since M had previously entered the Top 100 by market cap, its valuation base was high. Once core narratives and price stability were challenged, selling pressure became more concentrated than for typical tail-end Memes, ultimately resulting in a deep decline combining "high valuation mean-reversion and a crisis of confidence."
CHZ (-43.6%, Market Cap Rank 181), a representative token in the sports fan token ecosystem primarily reliant on the Chiliz / Socios.com sports club fan economy narrative, lacked major tournament or platform-level catalysts in June. This, combined with the overall decline in market risk appetite, led capital to prefer exiting such mid-cap assets with slower growth rhythms and limited short-term trading elasticity.
Overall, the common features among the losers are a lack of fresh catalysts, previous valuation or narrative exhaustion, and insufficient liquidity to absorb capital outflows. In an environment where over 70% of tokens are declining, weaker assets are more prone to the negative feedback loop of "further losses leading to accelerated decline."
2.2 Top 100 Market Cap Performance
Among the top 100 tokens by market cap, the number of strong performers was limited. BEAT (+133.48%) was the clear leader, followed by ADI (+50.90%), LIT (+35.84%), DEXE (+22.07%), and WLD (+20.90%) showing relative strength. AAVE, RAIN, JUP, and BDX also maintained positive returns, albeit at magnitudes significantly lower than extreme tail-end tokens.
On the downside, M (-80.17%) was the biggest drag among the Top 100. ADA (-38.06%), MNT (-35.64%), BCH (-33.65%), XLM (-32.70%), ALGO (-32.65%), PEPE (-31.26%), and DOT (-30.36%) were among the top decliners. The broad-based retracement of mainstream high-beta assets is the core manifestation of weakened market sentiment in June.
2.3 Relationship Between Market Cap Rank and Price Change
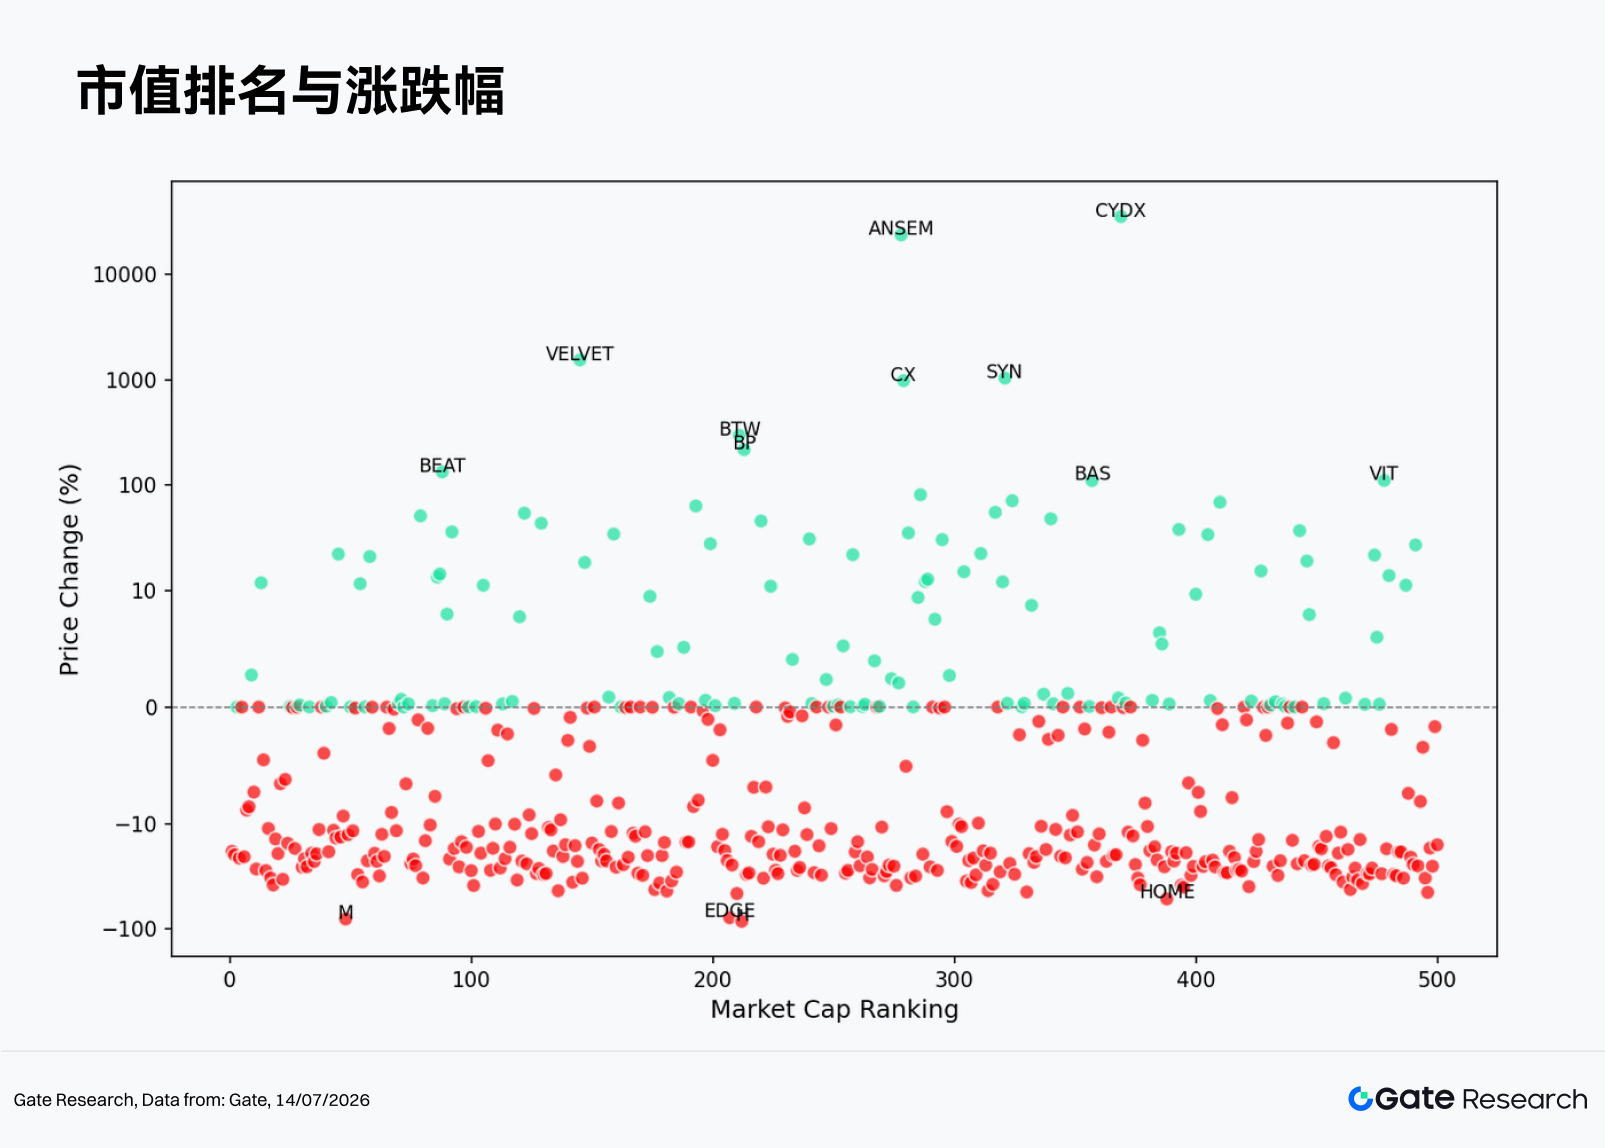
Based on the scatter plot distribution of market cap rank (X-axis) versus price change (Y-axis), negative returns in June covered virtually all market cap ranges. 73 out of the Top 100 tokens declined, indicating that top-tier assets failed to provide significant safe-haven properties. A few extreme outliers appear in the upper region of the Rank 200–400 range, constituting the primary source of the overall monthly average being skewed higher. However, the median for this range remains negative, implying the vast majority of tokens did not participate in the extreme tail-end rallies.
In other words, the main contradiction in June's market wasn't that "low-cap was overall stronger," but that "a very few low-cap coins were extremely strong, while most were weak." An investor observing only the average would easily overestimate the market's money-making effect. Observing the median and the proportion of advancing tokens provides a clearer picture that the capital environment remained in a defensive phase.
The average and median changes for the Top 1–100 were both negative, showing top-tier assets failed to serve as a defense. The averages for Top 101–400 appear robust on the surface, but their medians remain negative, primarily because individual extreme outliers like ANSEM, CYDX, SYN, and CX significantly inflated the averages. The Top 401–500 exhibited both higher tail risk (from outliers) and a deeper median decline, indicating that low-cap tokens are more susceptible to rapid retracements in the absence of sustained capital inflows.
3. Analysis of Volume Spikes
3.1 Volume Growth Analysis
The Volume Spike is calculated by comparing the end-of-month daily trading volume to the average daily volume from May. A higher value indicates a more significant volume surge relative to the "calm period" at the start of the month, reflecting a rapid increase in capital activity and market attention.
In June, 450 tokens had valid volume data. The overall average Volume


