Gate Research: Chart Pattern Analysis and Breakout Trading Strategies


- Core Viewpoint: Chart patterns are tools in technical analysis for identifying shifts in market supply and demand as well as trend reversals/continuations. Their effectiveness depends on the confluence of multiple factors including trend, volume, and support/resistance; breakout trading does not guarantee a definitive market move, and requires strict position management, stop-losses, and confirmation mechanisms to control the risk of false breakouts.
- Key Elements:
- Pattern Classification: Divided into reversal patterns (e.g., head and shoulders top/bottom, double top/bottom) and continuation patterns (e.g., flags, triangles, rectangles), but classification is not absolute and must be judged in the specific market context.
- Conditions for Valid Breakout: Typically requires the price to break through a clear resistance/support level, sufficient consolidation time, an increase in volume, and the closing price should be outside the breakout level, not just an intraday spike.
- Core Strategy: Entry methods include entering on the breakout (high reward, high risk), entering on a pullback confirmation (lower risk, potential to miss the move), and position scaling. The stop-loss principle should follow the rule of "stop loss if the pattern fails."
- Breakout Types and Risks: Post-breakout price action can be classified as valid breakouts, pullback-style breakouts, and false breakouts. False breakouts occur with considerable frequency in live trading, requiring risk control via position sizing and stop-losses to limit single losses.
- Validation Indicators: Volume (should increase during the breakout phase), support/resistance flip (original resistance becomes support after a breakout and vice versa), and momentum indicators (e.g., ATR, MA, RSI) can help confirm the quality of the signal.
Summary
• Chart patterns are crucial tools in technical analysis for observing changes in market supply and demand, trend continuation, or trend reversal.
• Pattern analysis is not about mechanically memorizing shapes but involves a comprehensive assessment of trends, volume, support and resistance, timeframes, and breakout validity.
• Patterns can be broadly divided into two categories: reversal patterns, including double tops, double bottoms, head and shoulders tops, head and shoulders bottoms, etc.; and continuation patterns, including flags, triangles, rectangles, etc.
• Effective breakouts typically require clear support/resistance, a prolonged consolidation period, trend context, and volume confirmation.
• A breakout does not equate to a guaranteed directional move. False breakouts occur frequently in live trading. Therefore, traders need to manage risk through position sizing, stop-losses, pullback confirmation, and taking profits in batches.
1. Introduction
Chart patterns are important tools in technical analysis for observing changes in market supply and demand, trend continuation, or trend reversal. Their core logic lies in price action reflecting the buying and selling power of market participants, and patterns compress the long-short battle into observable graphical structures. Pattern analysis is not about mechanically memorizing shapes but involves a comprehensive assessment of trends, volume, support and resistance, timeframes, and breakout validity.
Breakout trading is a direct application of pattern analysis. An effective breakout typically requires clear support/resistance, a prolonged consolidation period, trend context, and volume confirmation. A breakout does not equate to a guaranteed directional move. False breakouts occur frequently in live trading; therefore, traders need to manage risk through position sizing, stop-losses, pullback confirmation, and taking profits in batches.
2. Theoretical Framework of Pattern Analysis
2.1 Two Fundamental Assumptions
Technical analysis is usually based on two fundamental assumptions:
1. Prices move in trends;
2. History tends to repeat itself in a similar fashion.
In an uptrend, bulls are generally dominant; in a downtrend, bears are generally dominant. However, trends do not last forever. When bullish and bearish forces become balanced, prices enter a consolidation phase, forming a pattern. When consolidation ends, prices may continue along the original trend or may undergo a trend reversal.
2.2 Pattern Classification
Common chart patterns can be divided into the following categories. It is important to note that pattern classification is not absolute. The same pattern can have different implications depending on its location, timeframe, and volume structure.

3. Main Pattern Types
3.1 Rectangle Pattern
A rectangle pattern forms when prices oscillate between two parallel support and resistance levels, indicating market indecision. The rectangle is typically a continuation pattern but can also evolve into a reversal pattern, depending critically on the direction of the breakout and volume confirmation. Typical characteristics of a rectangle pattern include:
• Price repeatedly tests the upper and lower boundaries;
• Support and resistance are relatively clear;
• Bullish and bearish forces are relatively balanced during consolidation;
• Volume should increase significantly on valid breakouts or breakdowns.
Rectangle patterns are mainly divided into bullish rectangle patterns and bearish rectangle patterns. Whether it breaks out upwards or downwards, the subsequent price move is typically similar in magnitude to the height of the rectangle.
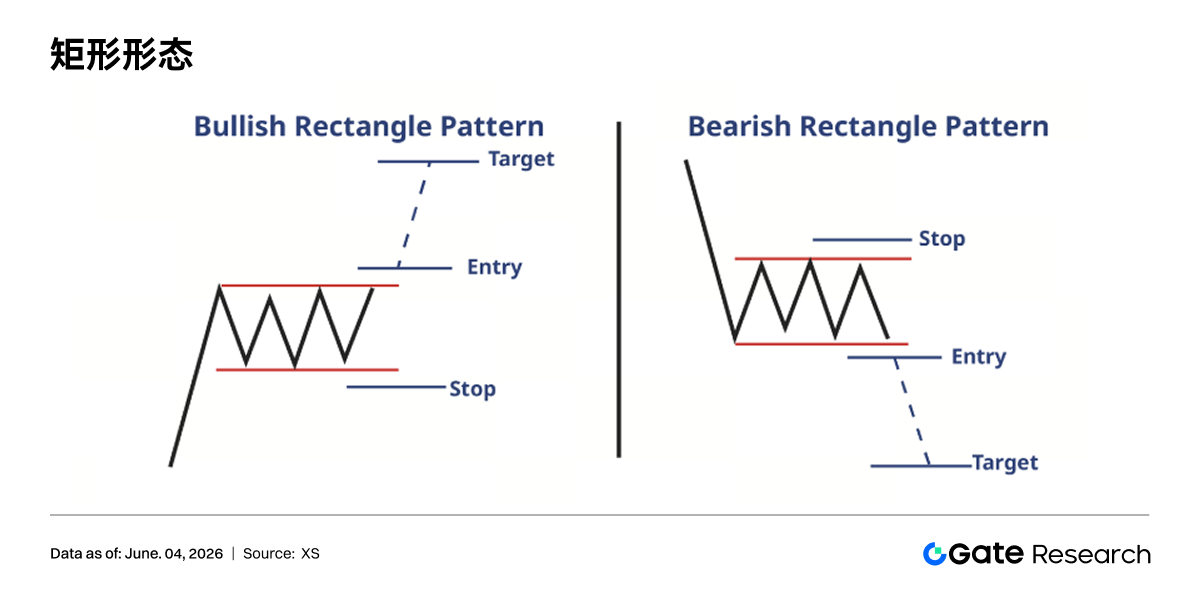
• Bullish Rectangle: In an uptrend, a bullish rectangle forms when prices stop moving upward and trade horizontally between two price levels. This pattern indicates the market is pausing briefly before resuming its upward move. A breakout above the resistance level, accompanied by increasing volume, confirms the uptrend will continue. Traders can enter long positions after the breakout and set a target at the height of the rectangle above the resistance line.
• Bearish Rectangle: A bearish rectangle pattern appears when prices consolidate in a horizontal range during a downtrend. The market pauses briefly within this pattern before continuing its decline. A breakdown below the support level confirms the downtrend will continue. Traders should establish short positions after the breakdown, expecting the price to decline by the height of the rectangle.
3.2 Flag Pattern and Pennant Pattern
Flags and pennants are short-term continuation patterns that usually occur after a rapid price surge or decline. The flag pattern consists of a sharp price move (the flagpole) followed by a rectangular or parallelogram-shaped consolidation phase (the flag), which slopes against the trend. The pennant pattern also begins with a sharp price move (the flagpole) but is followed by a small symmetrical triangle formed by converging trend lines. Their typical characteristics include:
• Formation should be preceded by a clear sharp rally or sell-off;
• The flagpole phase is usually accompanied by high volume;
• Volume may decrease during the consolidation phase;
• Volume should increase again upon the subsequent breakout.
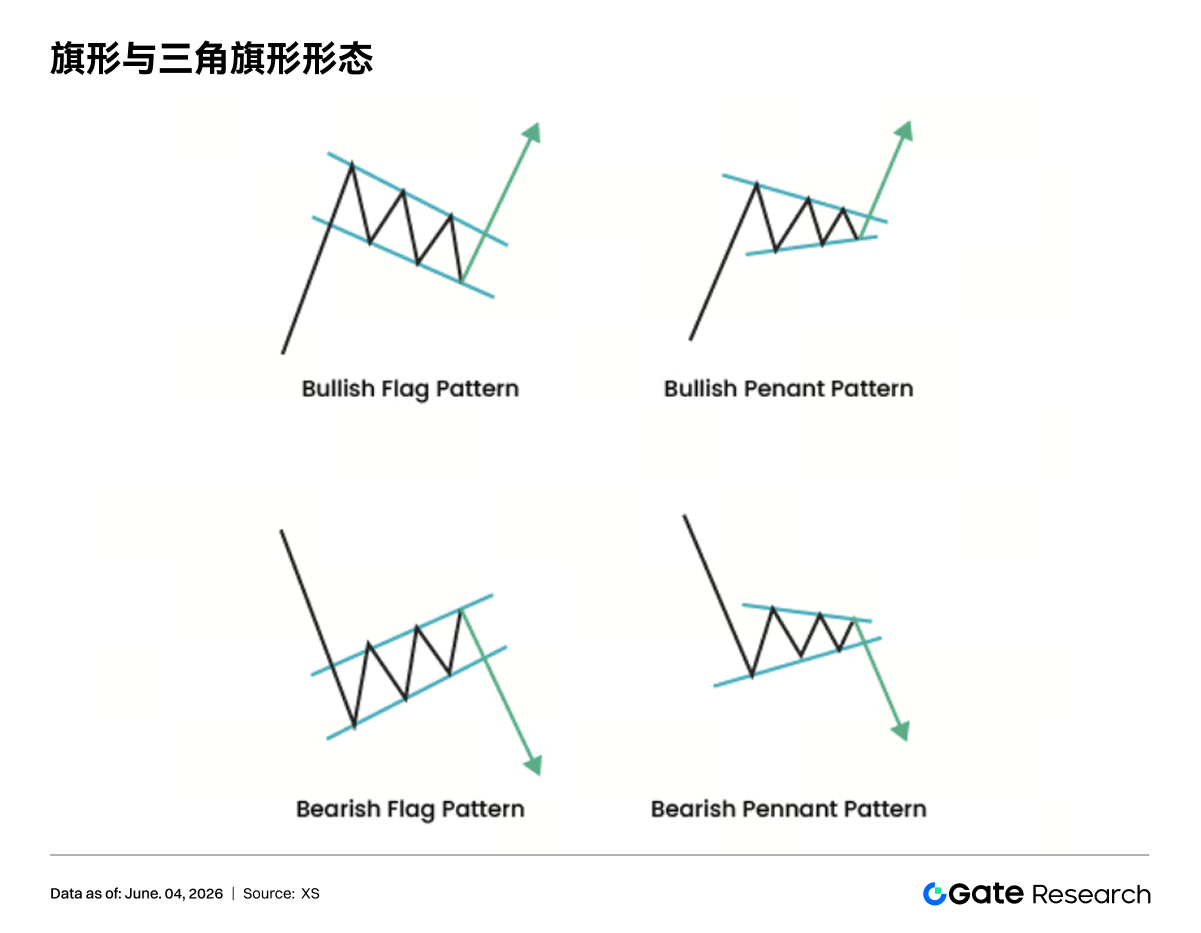
Flag patterns usually indicate that the existing trend will continue in the short term. The breakout typically occurs in the direction of the initial flagpole, which is the sharp price surge or decline preceding the flag's formation. After the breakout, the flagpole's length can be used to project the potential target.
Traders can enter when price breaks out of the flag pattern. For a bullish flag pattern, look for signs of price breaking above the upper trendline; for a bearish flag pattern, look for signs of price breaking below the lower trendline. Set profit targets based on the height of the flagpole. Use stop-loss orders to manage risk and protect against false breakouts.
It’s important to note that rectangle patterns typically form over about 3 months, whereas flags generally form in about 3 weeks.
3.3 Symmetrical Triangle
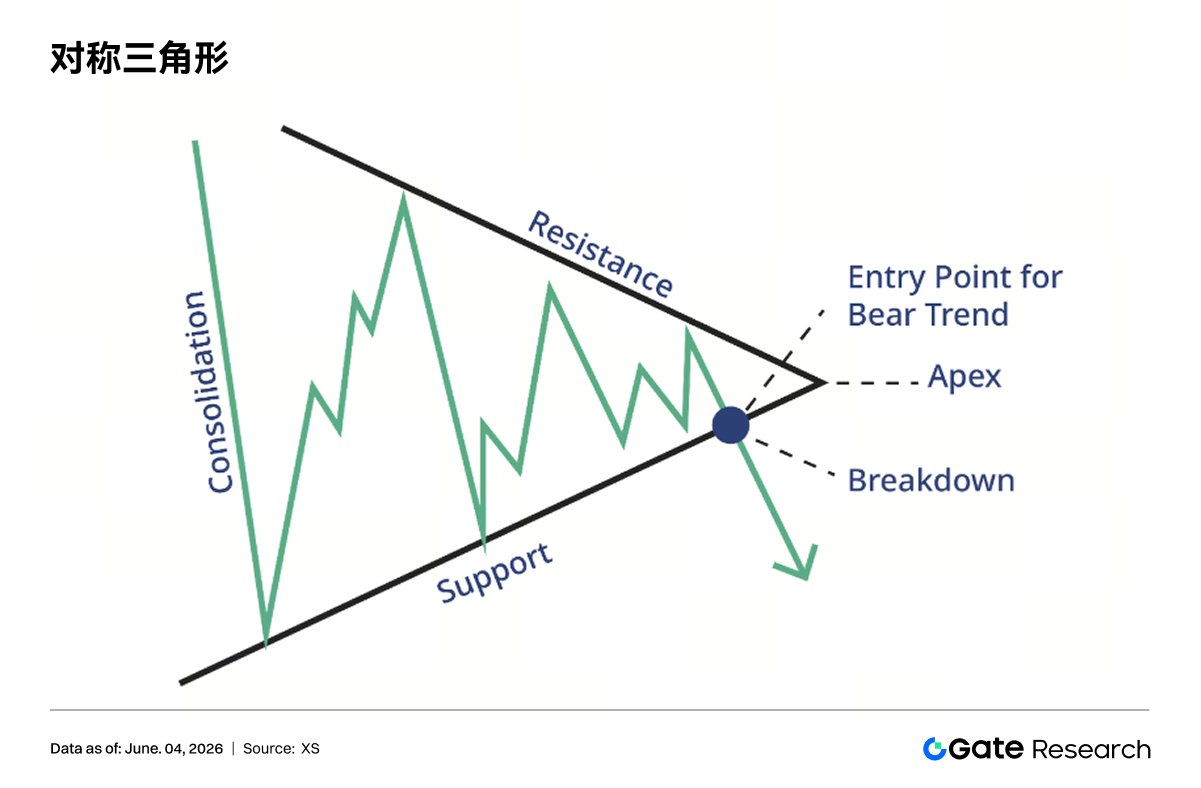
A symmetrical triangle is often slightly bullish, but it can break out upwards or downwards. It is characterized by successively lower highs and successively higher lows, with the range of price fluctuation narrowing. Unlike the pennant, the symmetrical triangle usually lasts longer than three weeks. This pattern signifies the market entering a phase of indecision, with bullish and bearish forces temporarily near equilibrium. The symmetrical triangle often appears as a continuation pattern but can also be a reversal pattern. One should not predict the direction prematurely but should wait for a valid breakout or breakdown. Its typical characteristics include:
• At least two successively lower highs;
• At least two successively higher lows;
• Volume typically decreases during the convergence phase;
• The ideal breakout location is usually between halfway and three-quarters of the way through the pattern's development;
• Observe volume and price acceleration upon breakout/breakdown.
The target can be estimated in two ways: one, measure the widest part of the triangle and project it from the breakout point; two, draw a projection line parallel to the trendline to estimate the price range. The core of the symmetrical triangle is not to determine which side (bulls or bears) has already won, but to identify the process of price volatility narrowing. Lower highs indicate that selling pressure appears earlier with each rally, while higher lows indicate that buying pressure enters earlier with each decline. Both forces are compressed, and ultimately, a direction must be chosen through a breakout or breakdown.
3.4 Ascending Triangle
The ascending triangle is typically considered a bullish pattern. Its upper boundary is approximately horizontal, representing a resistance zone; its lower boundary slopes upwards, indicating that buyers are willing to enter at increasingly higher prices. The core implication of this pattern is that sellers suppress prices at the same resistance level repeatedly, but buying power gradually strengthens, potentially pushing prices through the resistance. Its typical characteristics include:
• Resistance at the top is relatively flat;
• Lows at the bottom are progressively higher;
• Volume should increase significantly on an upward breakout;
• The former resistance level may turn into support after the breakout.
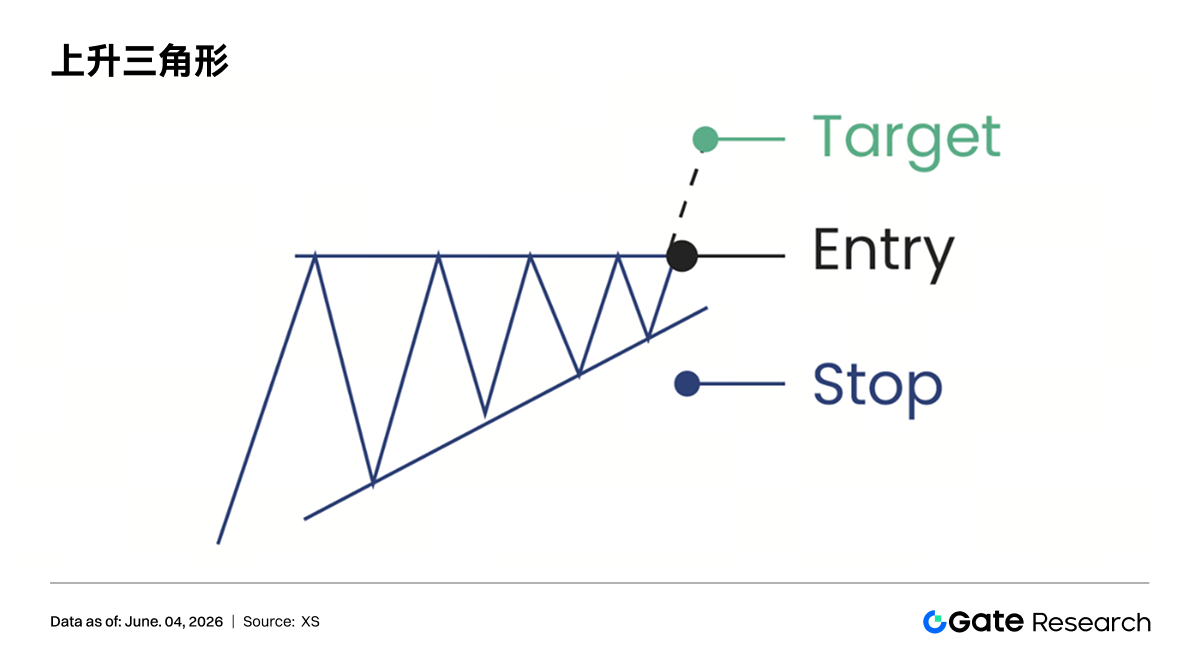
To calculate the target, measure the height of the pattern at its widest point and add it to the breakout level. The key to the ascending triangle is the relatively fixed resistance at the top and the continuously rising support at the bottom. The resistance level being tested multiple times indicates persistent selling pressure at that level; however, the progressively higher lows formed during each pullback show that buyers are willing to absorb supply at higher costs. As the price range narrows, the supply from sellers is gradually absorbed. If a decisive, high-volume breakout through resistance occurs, upside potential is often unlocked.
3.5 Descending Triangle
The descending triangle is the inverse structure of the ascending triangle and is typically considered a bearish pattern. Its lower boundary is approximately horizontal, representing a support zone; its upper boundary slopes downwards, indicating that sellers are applying pressure at progressively lower prices. Its typical characteristics include:
• Support at the bottom is relatively flat;
• Highs at the top are progressively lower;
• After the support breakdown, the former support may turn into resistance;
• Target can be projected downwards from the pattern's height.
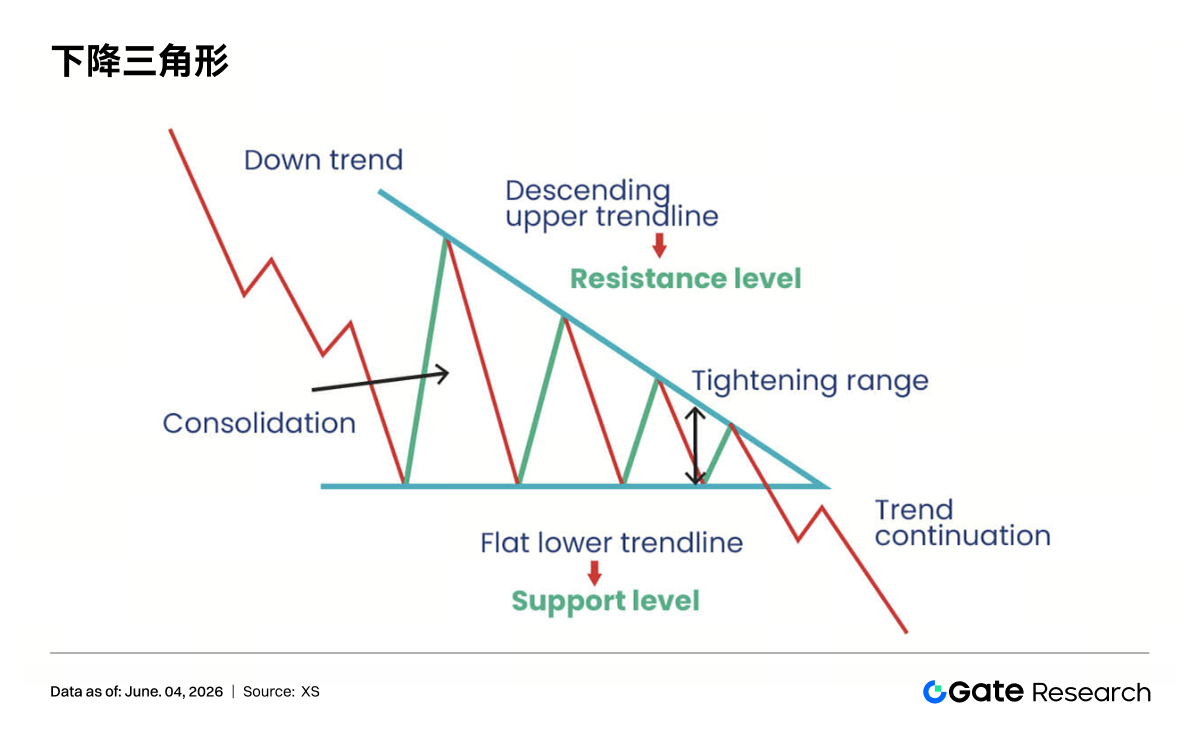
The core of the descending triangle lies in the repeated testing of the bottom support and the declining rally highs. The support level being touched multiple times suggests there are still buyers absorbing supply in that area; however, each subsequent rally reaches a lower high, indicating sellers are willing to keep selling at lower prices, and the strength of the counterattack from the bulls is weakening. When the price finally breaks below the horizontal support, the previous buying support may turn into stop-loss orders and new selling pressure, leading to further decline.
3.6 Head and Shoulders Top and Inverse Head and Shoulders
The head and shoulders top is a major top reversal pattern. This classic bearish reversal pattern typically appears at the end of an uptrend. It consists of a left shoulder, a head, a right shoulder, and a neckline. Connecting the lows on either side of the head and extending them to the right forms the neckline. The head is higher than both shoulders, while the left and right shoulders are roughly equal in height. Its formation logic is as follows:
• Price reaches a temporary high during an uptrend, forming the left shoulder;
• Price subsequently makes a higher high, forming the head, but volume may be weaker;
• The third rally fails to exceed the head's high, forming the right shoulder;
• When price breaks down through the neckline, the pattern is completed, and a trend reversal signal is valid.
The left shoulder's advance is accompanied by relatively high volume, volume diminishes during the head formation, and the right shoulder's rally occurs on even weaker volume. An increase in volume upon the neckline breakdown enhances the credibility of the reversal signal. The target is calculated by measuring the vertical distance from the head to the neckline and projecting it downwards from the neckline breakdown point. After the neckline is broken, the former support level typically becomes resistance.
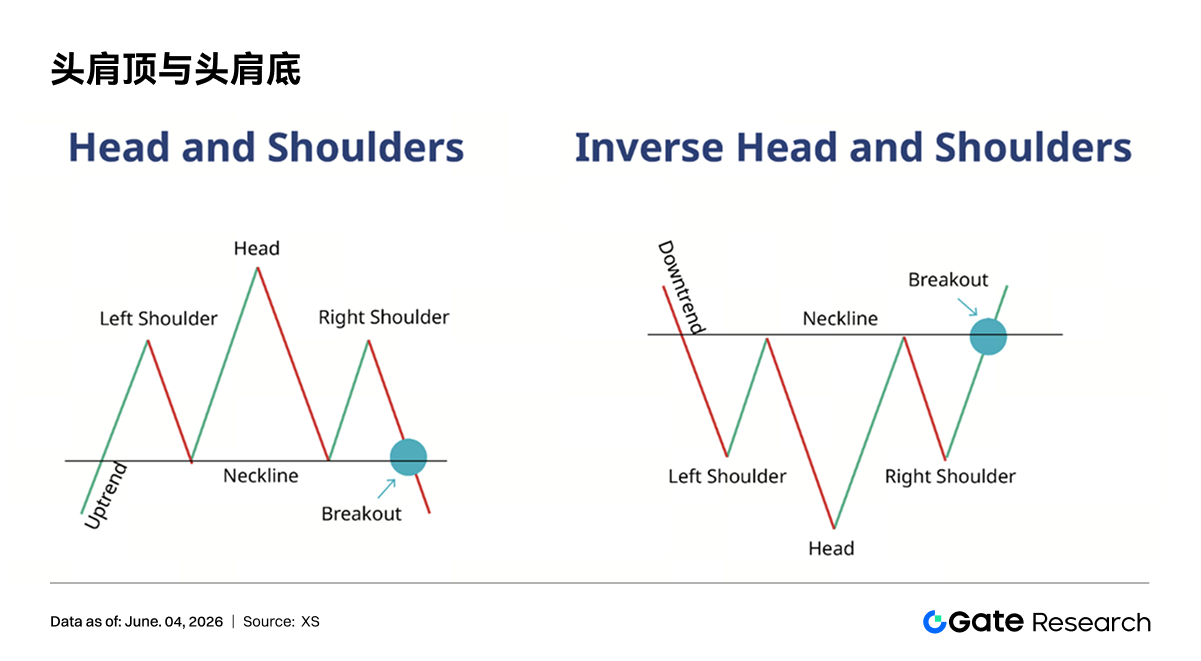
The inverse head and shoulders is the inverse structure of the head and shoulders top, typically appearing at the end of a downtrend. Its structure consists of a left shoulder, a head, a right shoulder, and a neckline, with the head lower than both shoulders. Its logic and usage are opposite to that of the head and shoulders top.
4. Breakout and Breakdown Trading Strategies
4.1 Definition of Breakout Trading
A breakout occurs when price moves decisively above a previously established resistance level and continues to move up; a breakdown occurs when price moves decisively below a previously established support level and continues to move down. Both are often collectively referred to as breakouts. Breakout traders focus not on fluctuations within a range but on the extension of the trend once price exits the established range. The underlying logic of breakout trading is that after a prolonged consolidation or the formation of a clear pattern, a price move that effectively breaks out of the range can trigger a larger-scale movement.
Breakout trading is effective because it reflects market psychology and herd behavior. Many traders place buy orders above resistance levels or sell orders below support levels. When price breaks these levels, it activates all these pending orders simultaneously, causing rapid market movement. This FOMO sentiment can further propel the price movement.
4.2 Relationship Between Range Trading and Breakout Trading
Range traders typically buy near support and sell near resistance, profiting from the price oscillations within a channel. Breakout traders, on the other hand, wait for the price to exit the range and then trade in the direction of the breakout. These two approaches are not contradictory but correspond to different market phases.

4.3 Conditions for an Effective Breakout
An effective breakout typically possesses the following characteristics:
• Price breaks through a clear resistance level or falls below a clear support level;
• There is a clear consolidation range or pattern preceding the breakout;
• Volume expands during the breakout;
• Price does not quickly return to the original range after the breakout;
• If a pullback occurs, the former resistance should turn into support, and the former support should turn into resistance.
In practical application, the validity of a breakout should not be judged solely by an intraday price spike but should focus on the closing price. If price breaks resistance intraday but closes back below it, it suggests selling pressure above is still strong. If price closes firmly above the resistance with a concurrent expansion in volume, the signal is of higher quality. For daily timeframe traders, confirmation from the daily close is often more valuable than an intraday spike. For short-term traders, confirmation using the close of the corresponding timeframe candle is equally important to avoid being misled by transient noise.
The quality of the consolidation before the breakout is equally important. A good breakout pattern typically has three features: first, clear boundaries of the consolidation range, allowing market participants to identify similar support and resistance levels; second, sufficient consolidation time, implying adequate exchange of positions; third, volatility gradually contracts during consolidation, suggesting an imminent directional choice. If price suddenly surges without clear consolidation or without overcoming key resistance, it is more likely a short-term impulsive move rather than a structural breakout.
Breakout signals can be classified into three levels: strong, medium, and weak. A strong breakout typically manifests as a long bullish/bearish candle with high volume, closing well away from the breakout level, and subsequently not returning to the original range. A medium breakout might show the price barely closing past the breakout level, requiring waiting for a pullback confirmation. A weak breakout involves an intraday spike but an unstable close, insufficient volume, or immediate stalling/consolidation after the breakout. Different levels of breakout signals should correspond to different position sizes, rather than using a single set of position rules.
4.4 Entry and Stop-Loss
Basic trading strategies include:
• On an upside breakout, go long above the high of the first breakout candle;
• On a downside breakdown, go short below the low of the first breakdown candle;
• In range trading, buy near support and sell near resistance;
• In breakout trading, place the stop-loss approximately 1% to 2% below the breakout level, or outside the pattern's key support/resistance.
Entry methods can be further broken down into three categories. The first is immediate entry on the breakout, suitable for situations with significantly high volume, a strong price close, and a clear market trend. The advantage is capturing the strongest part of the move, but the disadvantage is the high cost of false breakouts. The second is entry on a pullback confirmation, suitable for situations where price tests the former resistance or support after the breakout. The advantage is a clearer risk-reward ratio, but the disadvantage is potentially missing strong trends that do not pull back. The third is phased entry, establishing a partial position on the breakout and adding on the pullback confirmation, balancing participation opportunity and risk control.