






Gate Research Institute: BTC and ETH Both Pull Back, Trend Strategies Become the Main Source of Returns


- Core Viewpoint: In June 2026, the crypto market continued its weak adjustment, with BTC and ETH both falling over 20%. The futures market saw significant deleveraging, and the moving average cluster breakout strategy outperformed buy-and-hold. AAVE USDT, with a net return of 60.2%, became the best practical case.
- Key Elements:
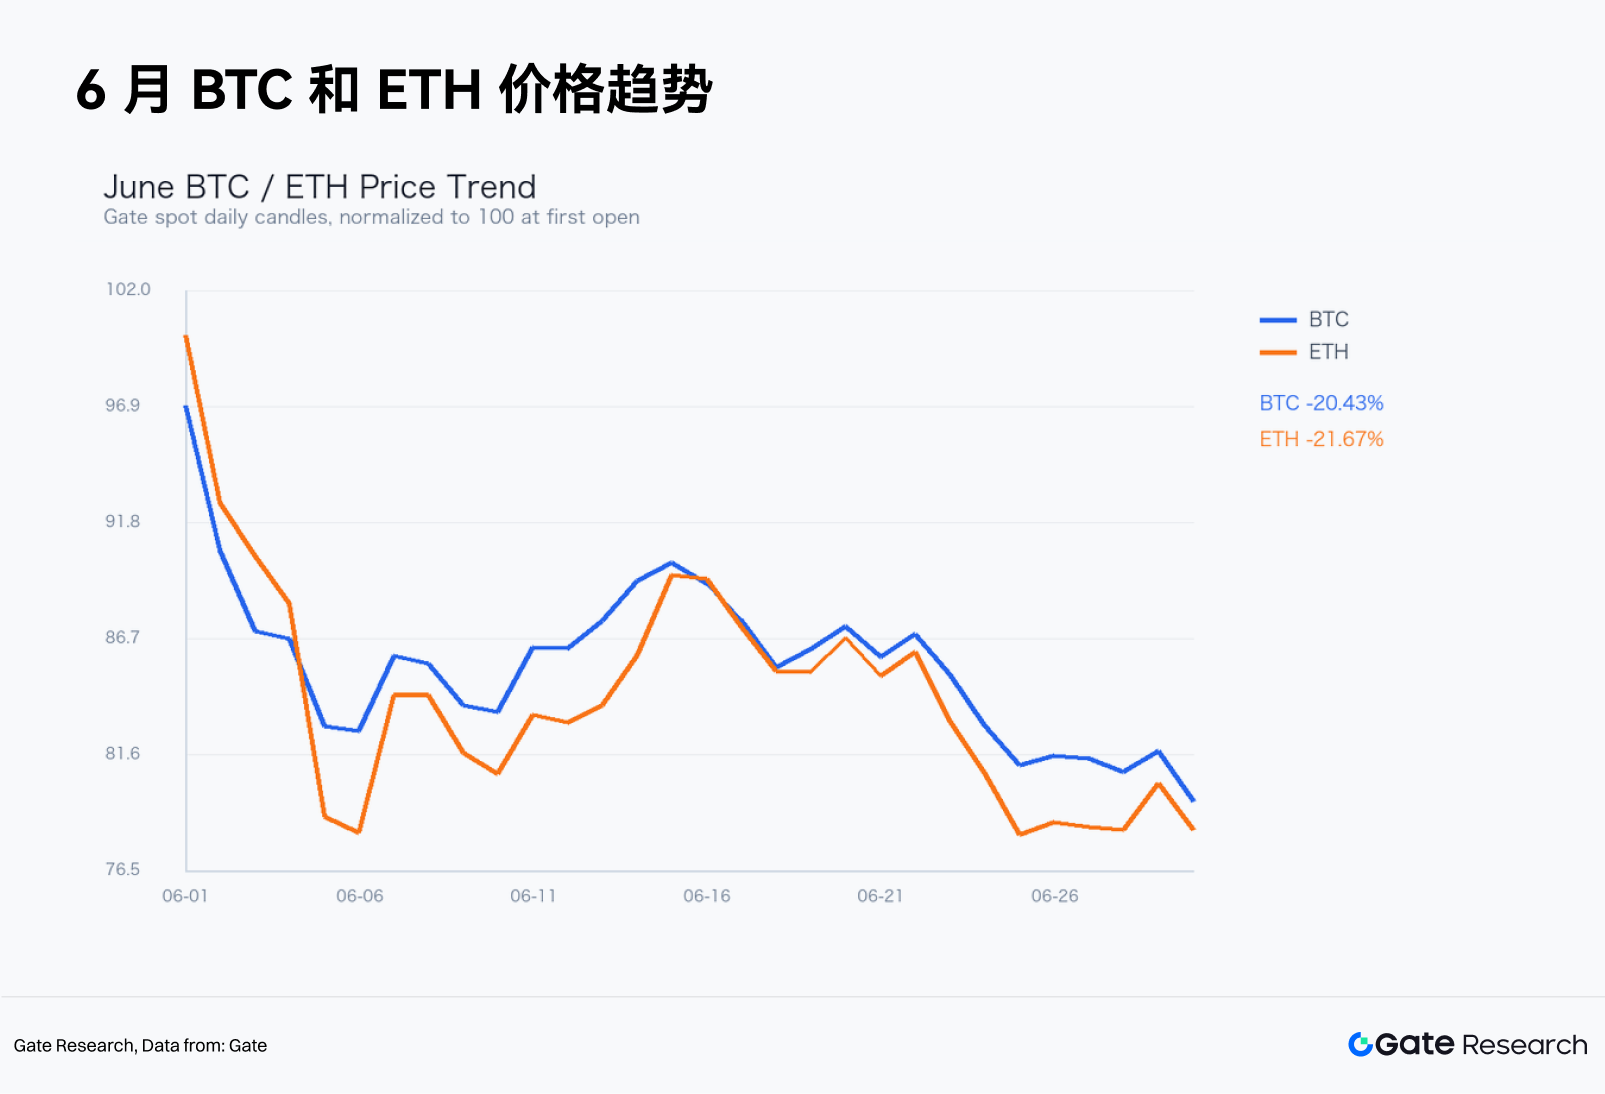
- Market Performance: BTC monthly return -20.43%, closing at $58,632.4; ETH return -21.67%, relatively weaker than BTC. The overall market price center shifted downward.
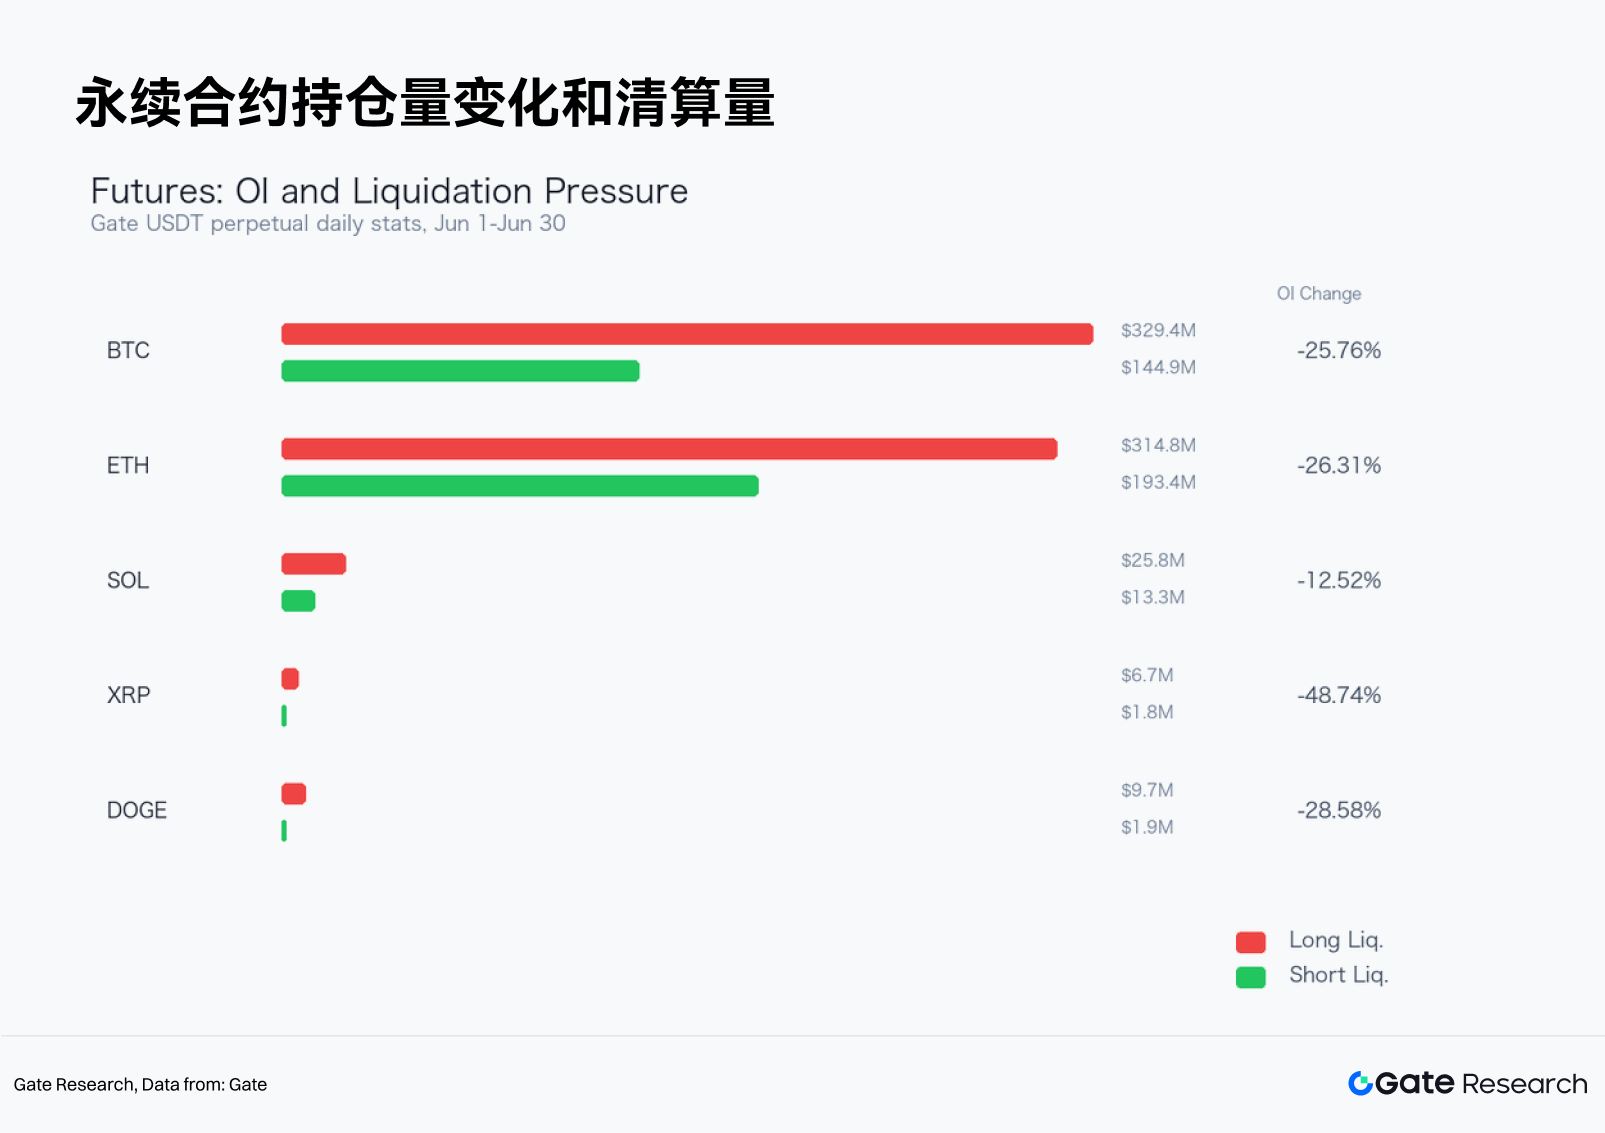
- Futures Deleveraging: Open interest in BTC and ETH perpetual contracts decreased by 25.76% and 26.31% respectively. Long liquidation volumes were significantly higher than shorts. Funding rates remained neutral, with the decline driven by spot selling pressure.
- Quantitative Strategy: The moving average cluster breakout strategy proved effective in a weak market, using convergence in the moving average band to wait for breakout signals, employing dynamic profit-taking to control drawdowns, and overall outperforming the buy-and-hold strategy.
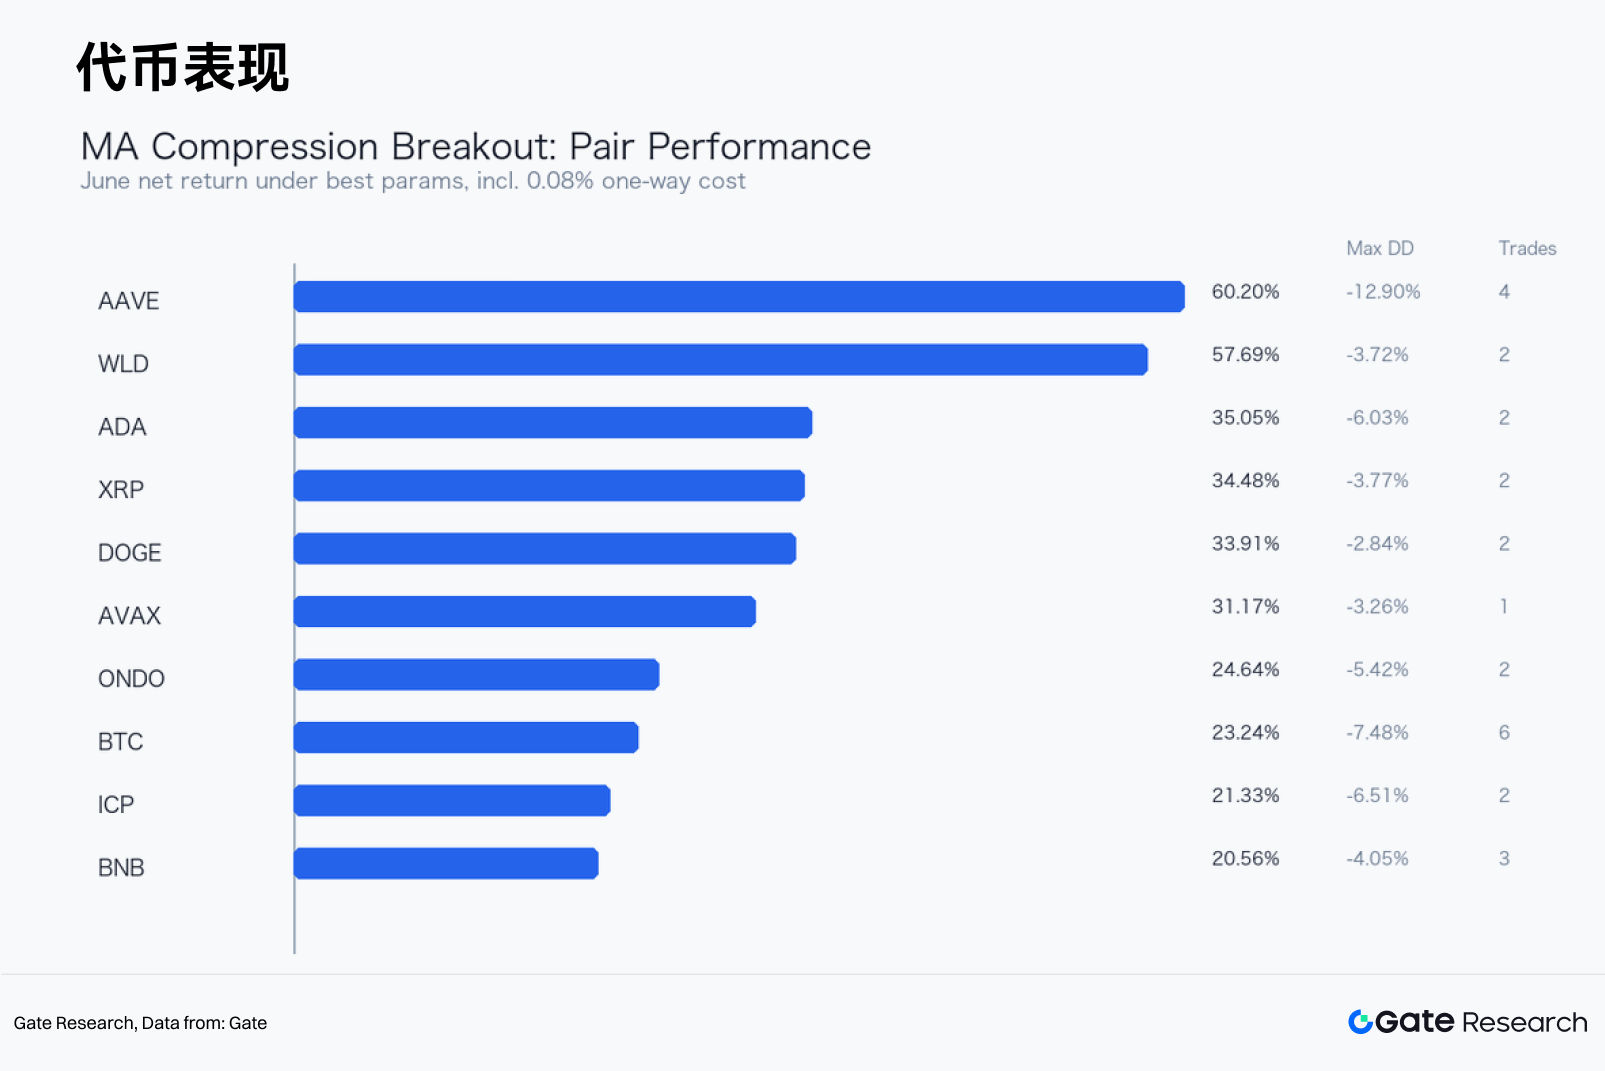
- Best Case: AAVE USDT recorded a monthly net return of 60.2%, with a maximum drawdown of -12.9%, a win rate of 75% across 4 trades. Returns primarily came from directional shifts and dynamic profit-taking.
- July Outlook: Continue tracking the moving average cluster breakout strategy. It is recommended to add volume confirmation and BTC trend filtering to reduce the risk of false breakouts in counter-trend trading.
Summary
• In June, BTC and ETH fell 20.43% and 21.67% respectively. The overall market continued its weak adjustment, with the price center of gravity shifting downward. ETH continued to underperform BTC.
• The futures market continued deleveraging. Open interest for BTC and ETH perpetual contracts declined by 25.76% and 26.31% respectively. Long liquidations were significantly higher than short liquidations. The funding rate remained generally neutral. The price decline mainly reflected a concurrent weakening of spot selling pressure and risk appetite.
• The market in June was suitable for trend following and breakout confirmation. Parameter backtesting shows that the moving average confluence breakout strategy performed better overall than buy-and-hold, making it more suitable for capturing directional moves.
• Based on comprehensive metrics such as net return, drawdown, and number of trades, AAVE USDT was the best practical case for June. The strategy achieved a net return of 60.2%, compared to a buy-and-hold return of 3.76%, with a maximum drawdown of 12.9%.
• In July, continue tracking the moving average confluence breakout strategy. Incorporate volume confirmation and BTC trend filters to improve signal quality and reduce the risk of false breakouts against the trend.
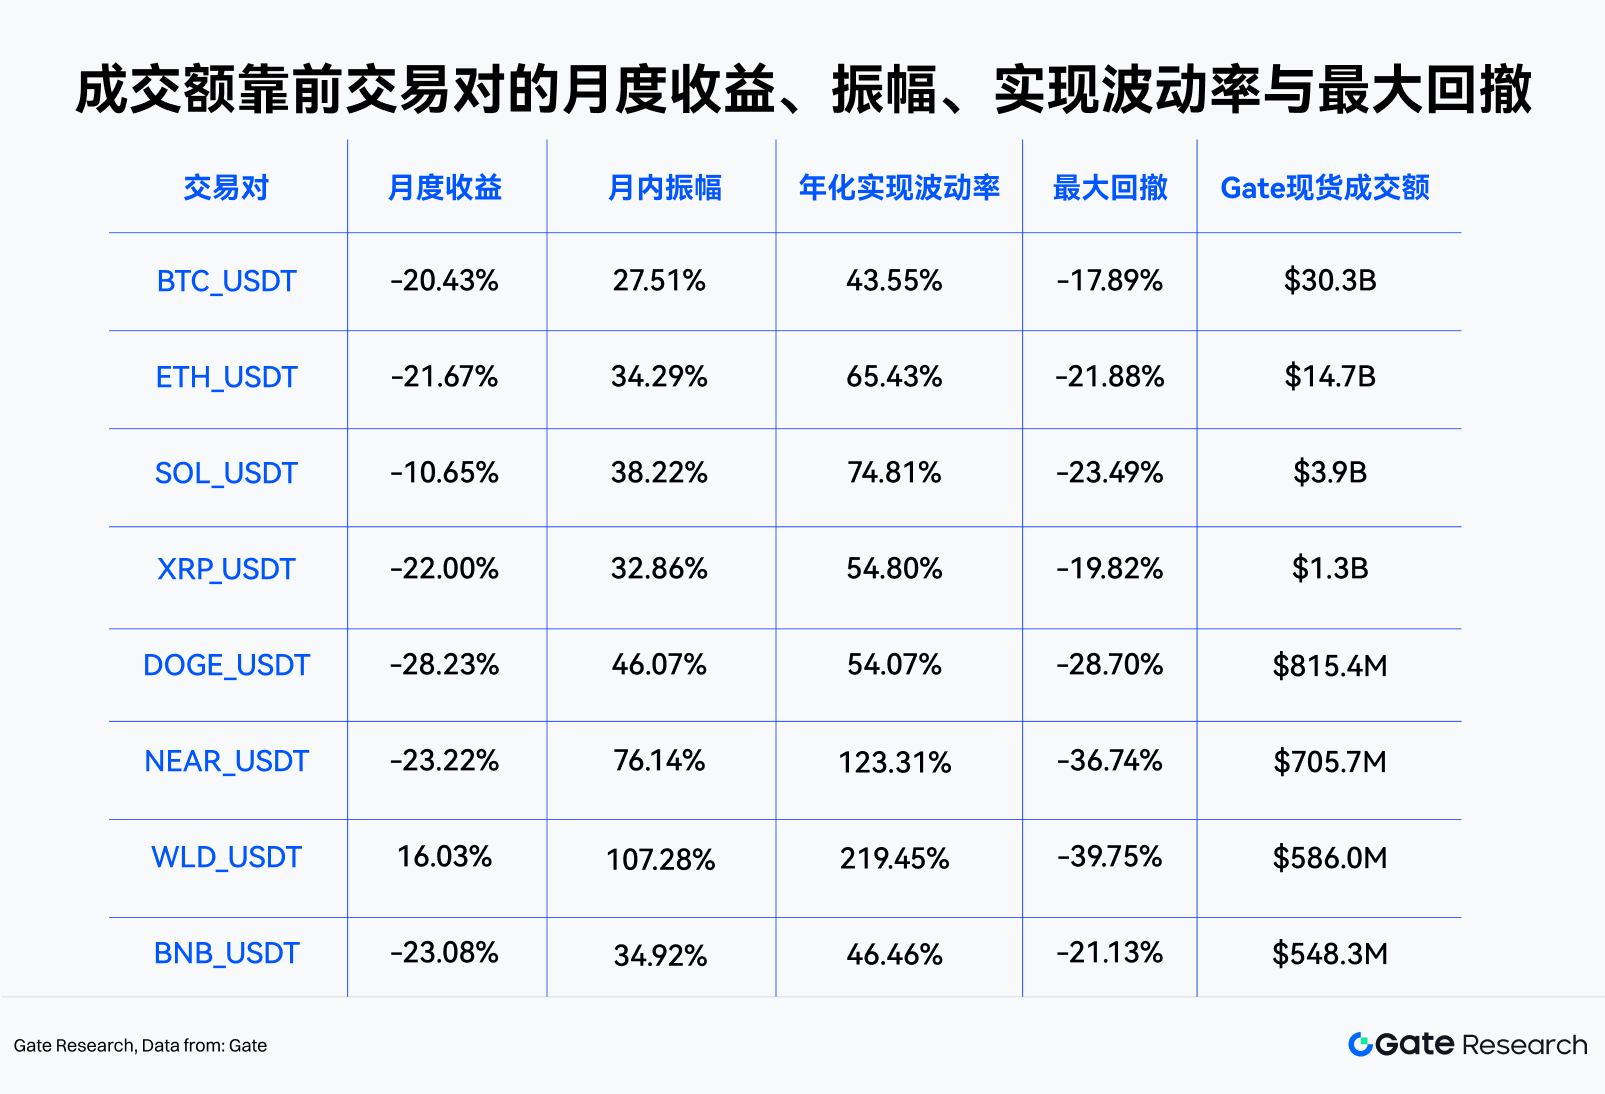
In June 2026, mainstream crypto assets continued their weak consolidation and the decline broadened. BTC opened the month at $73,684.1 and closed at $58,632.4, resulting in a monthly return of -20.43%. The intra-month high was $74,090.8, the low was $58,106.9, and the amplitude was 27.51%. ETH recorded a monthly return of -21.67% over the same period, with a maximum drawdown of -21.88%. Structurally, BTC experienced a rapid decline in early June followed by low-level repair. A mid-month rebound failed to reopen upward space, and prices fell again at month-end. ETH's relative weakness was more pronounced, with insufficient price elasticity and significant pressure during liquidity contraction.
On the futures side, the open interest of major contracts did not form a stable recovery. The notional value of BTC USDT perpetual open interest dropped from $5.19B to $3.85B, a monthly change of -25.76%; ETH's open interest changed by -26.31% monthly. In the liquidation structure, long liquidation amounts were significantly higher than short liquidations, indicating that passive deleveraging during the decline was still the dominant force. The funding rate remained slightly positive or near neutral for most of the time. The price decline was not driven by extreme short-side crowding but by the trend impact following the concurrent weakening of spot selling pressure and risk appetite.
Regarding quantitative strategies, this month was suitable for trend following and breakout confirmation. This article uses 4-hour candlesticks from Gate exchange to conduct a parameter grid backtest on 29 valid USDT spot trading pairs. Screening criteria included: monthly Gate spot trading volume exceeding $50 million, at least 2 trades executed, a maximum strategy drawdown not exceeding 20%, and a combined one-way cost and slippage of 0.08%. Based on comprehensive net return, drawdown, and number of trades, the best practical case for June was the AAVE USDT moving average confluence breakout strategy: monthly net return of 60.2%, buy-and-hold return of 3.76%, maximum drawdown of -12.9%, 4 trades executed, a win rate of 75%, and a profit factor of 9.63.
1. Market Overview
The core characteristics of the June market were a downward shift in the price center of gravity, a lack of sustained rebounds, and trading volume concentration converging on BTC and a few large-cap assets. BTC and ETH remain the most important benchmarks. BTC's monthly amplitude reached 27.51%, with an annualized realized volatility of approximately 43.55%; ETH's monthly amplitude was 34.29%, with an annualized realized volatility of about 65.43%. When major assets experience significant drawdowns simultaneously, cross-currency diversification offers limited protection for portfolio value in the short term. Strategically, strict adherence to position direction and exit discipline is required.
From a trading volume perspective, the highest June Gate spot trading volumes were concentrated in highly liquid assets like BTC, ETH, SOL, XRP, and DOGE. High trading volume has two implications. First, backtested signals are closer to executable real-world environments. Second, during periods of increased intra-month volatility, rising volume is usually accompanied by both passive stop-losses and active position adjustments, making it easier for trend strategies to capture consecutive price ranges.
2. Structural Observations of BTC and ETH
BTC's June trajectory can be divided into three phases. The first phase, from June 1 to June 6, saw a rapid price decline from the beginning-of-month area, with daily charts weakening consecutively and long contract liquidations amplifying simultaneously. The second phase, from June 7 to June 18, saw BTC repair in the low range. Local rebounds led to short covering, but the price never firmly reclaimed the early-month highs. The third phase, in late June, saw BTC lose mid-month support again, closing near the lows for the month, indicating a continued preference among funds to reduce risk exposure.
ETH underperformed BTC. ETH's monthly return in June was -21.67%, -1.25% worse than BTC. In weak months, ETH typically requires on-chain activity, ecosystem capital, or expanding risk appetite for additional support. These factors did not offset the macro risk and market deleveraging pressures this month. Strategically, ETH is better suited as a risk thermometer rather than a standalone offensive asset: when ETH fails to strengthen relative to BTC, the beta risk of altcoin portfolios needs to be reduced.
The relationship between volume and volatility is also worth noting. BTC's trading volume increased significantly during the initial decline and the month-end retreat, indicating the price decline was not simply a low-liquidity slide but was accompanied by genuine turnover. If BTC enters a period of low-volatility sideways movement, the moving average confluence strategy will wait for the moving average bands to converge before judging the breakout direction. If the price continues to move along a downward channel, short-cycle trend models may still outperform mean reversion.
3. Futures Market: Open Interest, Liquidations, and Funding Rate
Data from the futures market provides a consistent signal: passive risk reduction following the decline. Total long liquidations for BTC were $329.4M, and total short liquidations were $144.9M. For ETH, total long liquidations were $314.8M, and total short liquidations were $193.4M. The high proportion of long liquidations means leveraged longs were forced to exit as prices fell, which also transmitted sentiment to the spot price.
The funding rate did not show extreme negative values, indicating the market wasn't in a one-sided overheated short position. The funding rate was close to neutral or slightly positive most of the time, suggesting some capital attempted to buy the dip or maintain long positions during the price weakness. Conditions for a short-term rebound would be closer only if the funding rate turned significantly negative while the price failed to make new lows. Such a strong reflexive structure did not form this month.
A period with a long/short account ratio above 1 is not necessarily bullish. In a weak market, a rising long/short ratio can sometimes result from retail traders going against the trend. Without OI expansion and price upside, this can instead become a source of subsequent liquidation pressure. The long/short account ratios for BTC and DOGE were high on some trading days, yet the price failed to recover sustainably. Such divergence needs to be incorporated into risk control.
4. Quantitative Analysis: Moving Average Confluence Breakout Strategy
4.1 Strategy Logic
This report uses the core concept of moving average confluence breakout. When multiple short-to-medium-term moving averages gradually converge, the price is in a compressed state awaiting a directional choice. When the price breaks out above the upper band of the moving averages, it suggests bulls are regaining control. When the price breaks down below the lower band of the moving averages, it indicates a higher probability of a continuation of the bearish trend. The strategy does not predict turning points but waits for the price to signal a direction after the moving average bands converge.
This article uses six moving averages to form the band, consisting of three SMAs and three EMAs. The parameter grid includes four period groups: (6,18,54), (8,24,72), (12,36,108), (20,60,120). Thresholds include 1.2%, 1.8%, 2.2%, 3%, and 4%. Dynamic take-profit multiples include 3, 4, 6, and 8. It uses 4-hour candlesticks, with the period from May 1 to May 31 for indicator warm-up, and June 1 to June 30 for performance evaluation.
The entry rules are as follows:
• Moving Average Band Width = (Highest value of six MAs - Lowest value of six MAs) / Close price.
• When the MA band width is below the threshold, it is considered MA confluence.
• When the close price breaks out above the upper band of the MAs from below, go long at the open of the next 4H candle.
• When the close price breaks down below the lower band of the MAs from above, go short at the open of the next 4H candle.
• Stop loss: Close long position if price breaks below the lower band; close short position if price breaks above the upper band.
• Take profit: When profit reaches "entry MA band width × take-profit multiple", close the position at the open of the next 4H candle.
• Any open positions at month-end are forcibly closed at the closing price of the last 4H candle.
The backtest cost assumption is a 0.08% deduction for each position change, covering trading costs and slippage. This assumption does not represent Gate's actual fee structure and is used only for standardized comparison across different trading pairs and parameter combinations. The strategy does not use leverage, and capital utilization is calculated at 100%. Buy-and-hold return is calculated using the opening price of the first daily candle and the closing price of the last daily candle for the same trading pair in June.
4.2 Sample and Screening
The candidate pool includes BTC, ETH, SOL, XRP, DOGE, BNB, ADA, TRX, LINK, AVAX, BCH, LTC, DOT, NEAR, UNI, AAVE, ICP, ETC, ATOM, FIL, OP, ARB, SUI, WLD, INJ, PEPE, SHIB, ONDO, HBAR, and other 29 valid Gate USDT trading pairs.
To avoid a single coincidental signal becoming the optimal sample, the practical case is limited by the following criteria: monthly Gate spot trading volume higher than $50 million, at least 2 trades executed in June, maximum strategy drawdown not exceeding 20%, and position exposure not exceeding 95%. The purpose is not to pursue theoretical maximum returns but to identify a strategy combination executable in a live trading environment for June.
4.3 Best Practical Case for June: AAVE USDT
According to the screening rules above, the best case for June is AAVE USDT. This trading pair had a monthly spot trading volume of $108.2M, a monthly buy-and-hold return of 3.76%, an intra-month amplitude of 72.28%, and a maximum drawdown of -24.02%. The optimal strategy parameters were: MA period (8, 24, 72), MA confluence threshold 4%, and dynamic take-profit multiple 8.
Backtest results show that AAVE USDT's equity curve exhibited a stair-step pattern in June. The strategy did not predict the direction at the beginning of the month but waited for a breakout signal after the MA bands converged. This characteristic allowed it to avoid some ineffective sideways movements and retain positions when prices showed consecutive directional moves. Compared to buy-and-hold, the strategy's return difference was 56.44%, and the maximum drawdown was controlled at -12.9%. This indicates the month's returns came primarily from directional switches and dynamic profit-taking. This sample is not just a replay of spot prices but also possesses the basic conditions for expressing long/short direction through perpetual contracts.

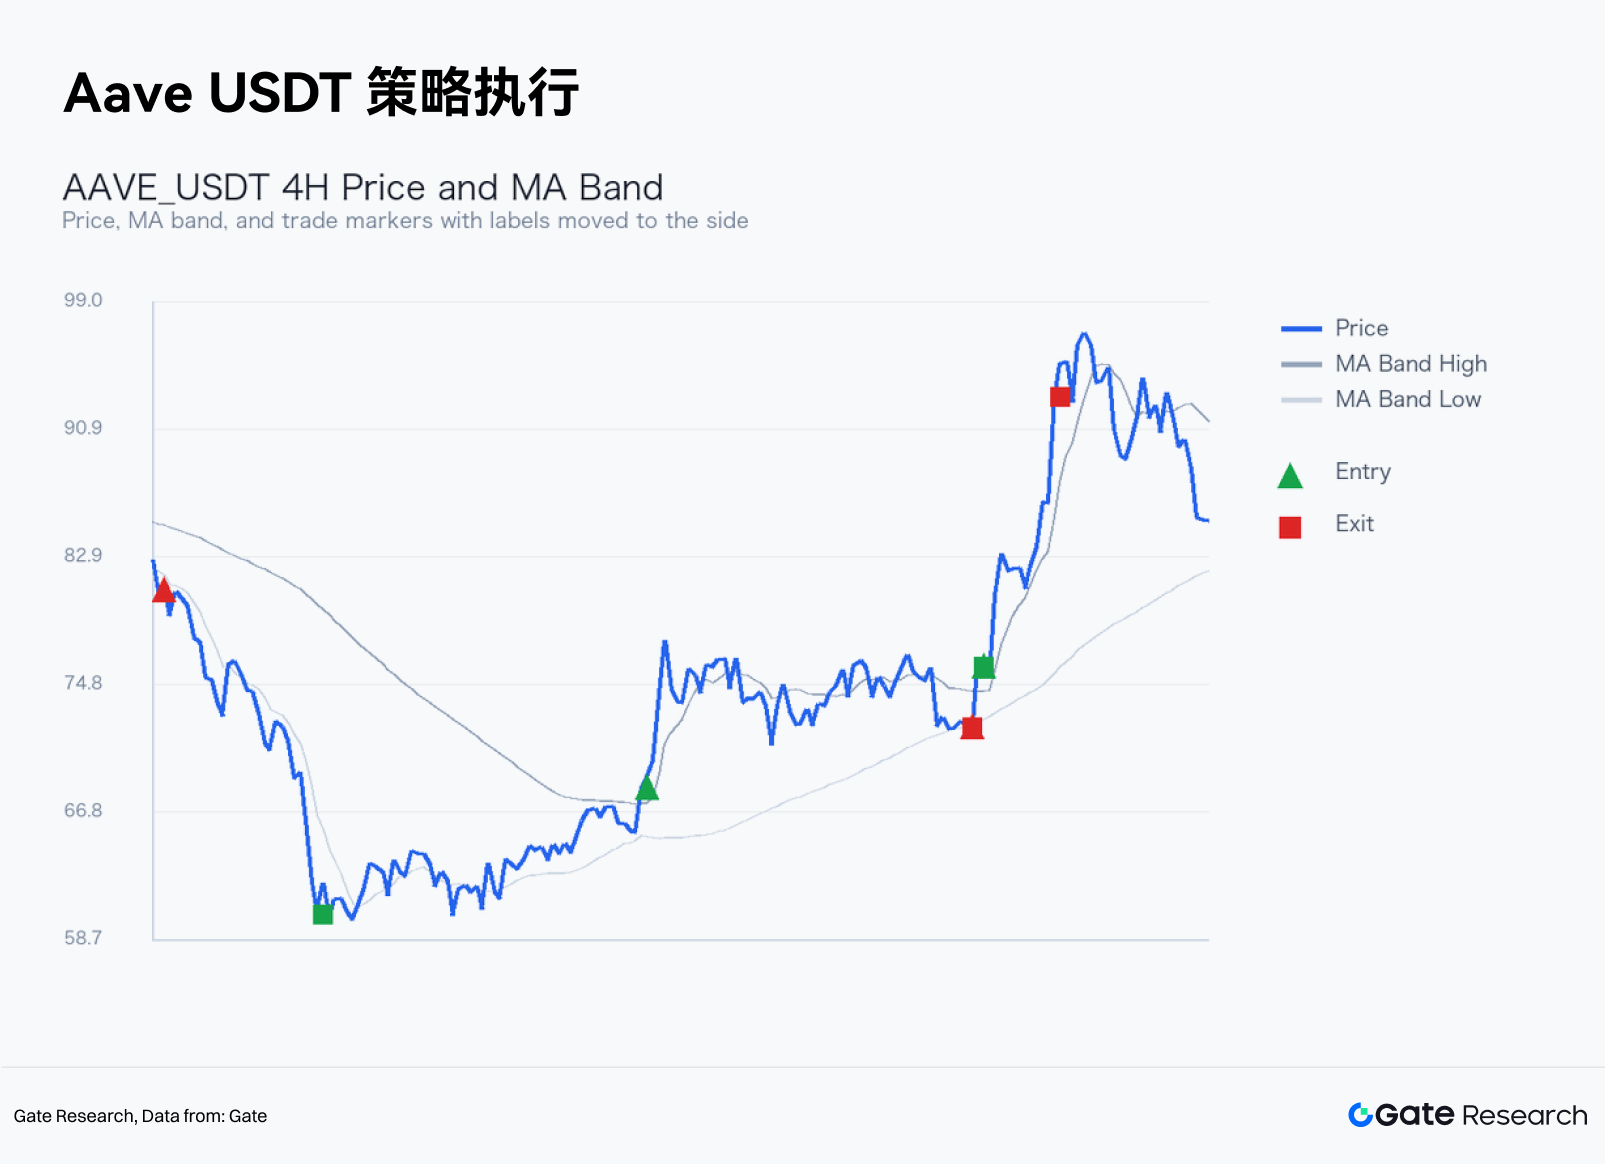
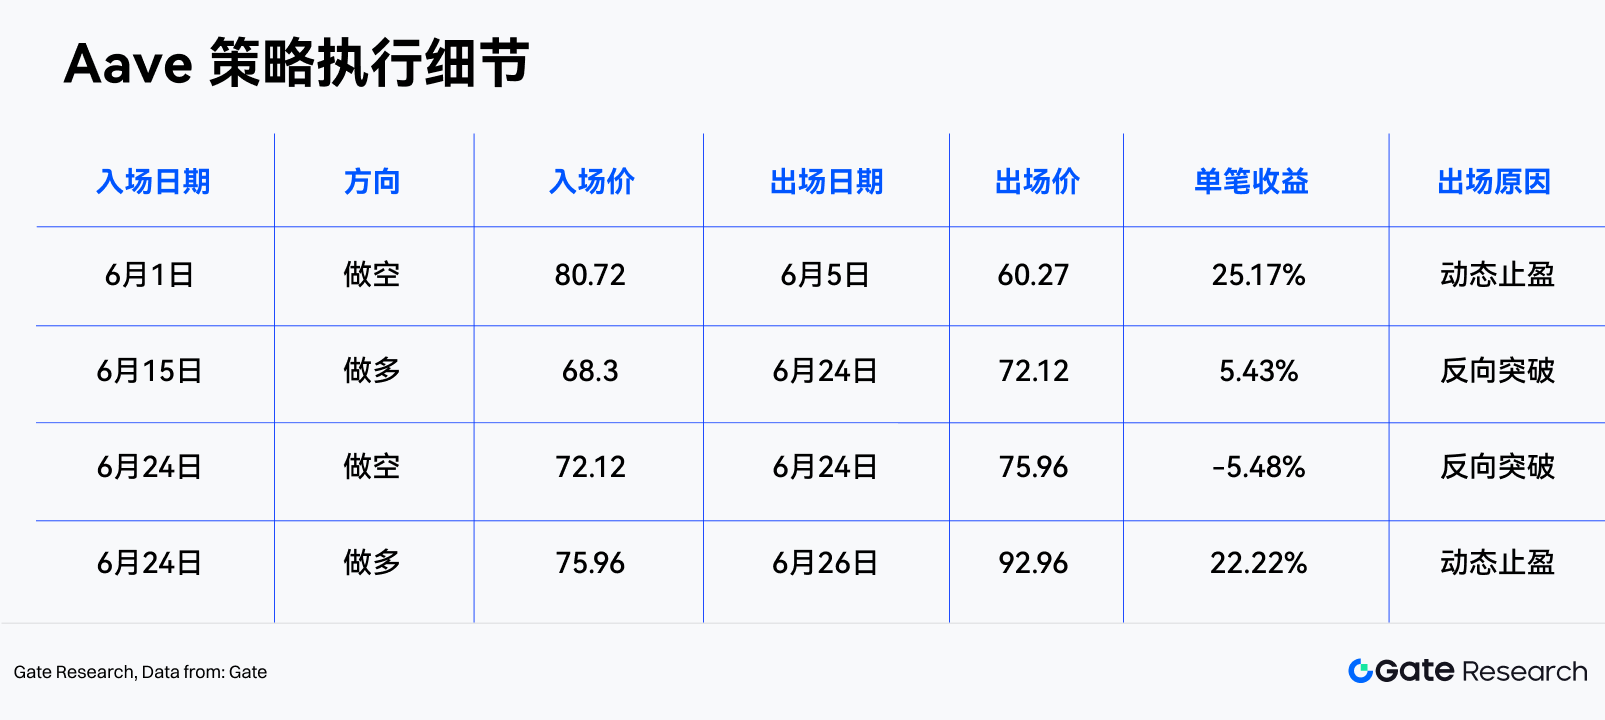
Looking at the trade details, the strategy performed best during phases where the price moved rapidly away from the MA band. Short signals contributed more during the downward month, while long signals primarily served a rebound confirmation function. If only spot long positions were allowed, the strategy's return for the month would have been significantly lower. If using perpetual contracts for execution, additional attention needs to be paid to funding rates, liquidation prices, and position limits.
4.4 Sources of Strategy Returns
The effectiveness of the MA confluence breakout strategy this month primarily came from three types of market structures.
First, the price moved from narrow consolidation to directional expansion multiple times. The MA confluence condition divides the market into "waiting" and "execution" states, reducing frequent trading amidst choppy volatility. The strategy only assumes directional risk when the price leaves the MA band.
Second, the downward segments in the weak market were more continuous. Many high-beta trading pairs in June did not immediately recover after a single day's decline but fell consecutively over several 4H candles. Trend strategies are more likely to achieve positive expectancy in such environments than mean reversion strategies.
Third, dynamic take-profit reduced profit erosion. Fixed take-profit levels can lead to premature exits during amplified volatility, while pure MA-based stop-losses might return realized profits to the market. The strategy uses "entry MA band width × multiple" as the take-profit target, which varies with the degree of compression at entry. The tighter the MA band, the smaller the take-profit distance after the breakout; a slightly wider MA band allows for greater trend space.
The strategy's shortcomings are also clear. MA confirmation is inherently lagging and cannot capture the very beginning of a trend. If the price quickly reverses, short positions might stop out near the upper band of the MA. If the market enters a wide-range, directionless oscillation, the MA band will repeatedly converge and expand, and trading costs will erode returns. Therefore, this strategy is suitable as a trend enhancement module, not as a standalone all-weather allocation.
5. Portfolio Perspective: Combining Trend Enhancement and Neutral Strategies
The June samples illustrate that a trend strategy can play both a defensive and offensive role during down months. Short signals can hedge spot beta, while long signals can capture rebounds from lows. However, its return distribution is not smooth. If the MA confluence breakout strategy is used for portfolio management, it is better suited as an enhancement module paired with low-correlation strategies.
One actionable portfolio framework is as follows:
• Core positions use low-turnover strategies like BTC, ETH, or stablecoin yield generation as the base layer.
• The trend enhancement module only activates when a breakout occurs after MA confluence; otherwise, it remains flat.
• Risk budget per single trading pair should not exceed 10%-15% of portfolio equity.
• Set lower single-loss limits for high-beta altcoins.
• If both BTC and ETH break down below their daily short-to-medium-term MAs, reduce the weight of long signals.
• Avoid chasing long positions when the funding rate is continuously and significantly positive, and the price fails to make new highs.
• When the funding rate turns negative, the price stops making new lows, and OI stabilizes and recovers, increase the weight of rebound signals.
The key point of this framework is to place strategy signals within a risk budget, rather than extrapolating a single backtest result. The best case in June is representative, but it does not mean the same return can be replicated in July. The vitality of a trend strategy comes from discipline: not trading without a clear confluence breakout, exiting when stop-loss conditions are triggered, and taking profits when the dynamic take-profit target is reached.
6. Risk Warnings and Subsequent Observations
Three categories of indicators warrant careful observation going forward.
First, can BTC reclaim the mid-June rebound range? If BTC only consolidates at low levels, the sustainability of altcoin rebounds will be limited. If BTC breaks upwards with volume, driving an ETH/BTC ratio recovery, the quality of long signals for the trend model will improve.
Second, does futures OI increase concurrently with a price rebound? A price rebound without OI growth often reflects mere short covering. A rebound accompanied by OI growth and


