






Gate Institutional Weekly: Crypto Market Cap Evaporates Over $300 Billion in a Week, Gate Institutional Spot Trading Volume Surges 92.16%


- Core Viewpoint: Last week, the macro environment quickly pivoted from "betting on easing" to "prolonged high interest rates" due to strong non-farm payroll data, triggering a significant correction in the crypto market. Bitcoin fell 15%, Ethereum dropped 22%, and total market cap evaporated by over $300 billion. Derivative markets indicated a concentrated liquidation of leveraged longs and a surge in risk-off demand.
- Key Factors:
- Macro Shock: May non-farm payroll employment (172,000) far exceeded expectations, causing market expectations for a Fed rate hike to surge, with the S&P 500 tumbling 2%, serving as the core external driver for the crypto market correction.
- ETF Outflows: Bitcoin spot ETFs recorded net outflows for 13 consecutive days, with AUM declining over 22% from the cycle's start; Ethereum ETF outflows were even more severe, showing only a faint inflow after 17 consecutive days of net outflows.
- Derivatives Risk Signals: BTC price fell from $73K to $62K, with open interest (OI) declining over 15%; the 25D Skew dropped to extreme negative values, and DVOL briefly rose to 52-54, indicating market risk-off demand reached a cycle high.
- On-chain Trading & Ecosystem: DEX trading rebounded, with capital flowing to major protocols; Aave lending scale continued to retreat, with new demand concentrating on emerging ecosystems like MegaETH; Hyperliquid derivative income saw strong growth.
- Institutional Dynamics: Gate Institutional spot trading volume increased 92.16% week-over-week, CrossEx trading volume rose 47.1%, and institutional business and TradFi asset coverage continued to expand.
Summary
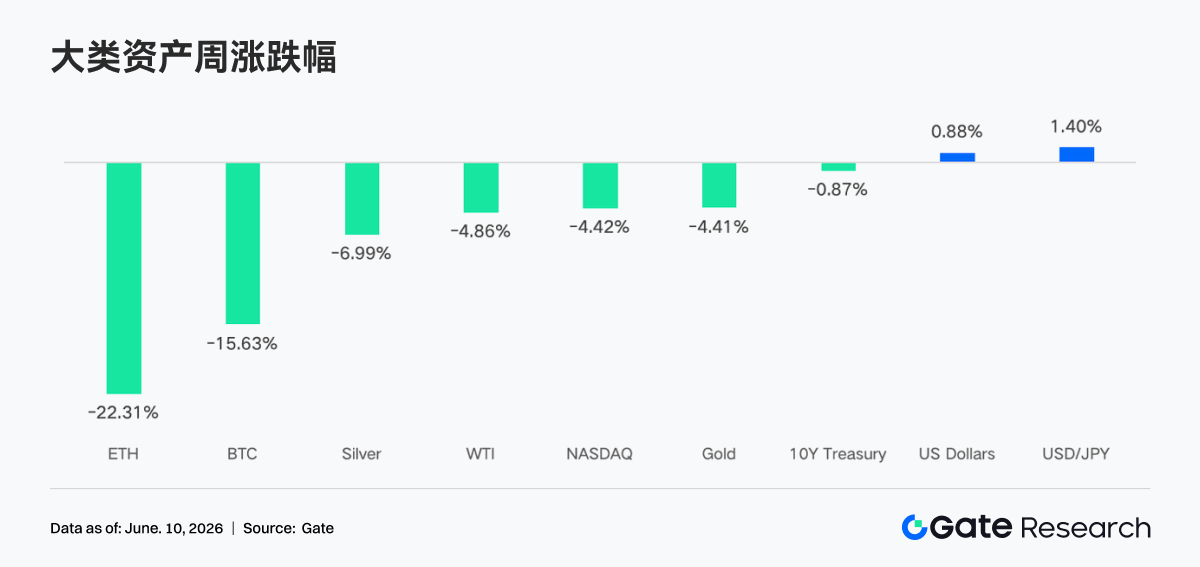
• Last week, the global macro market experienced a dramatic shift from "sentiment heating up" to "rapid reversal." Bitcoin fell approximately 15% for the week, Ethereum dropped about 22%, altcoins saw even deeper declines, and the total crypto market capitalization evaporated over $300 billion in a single week.
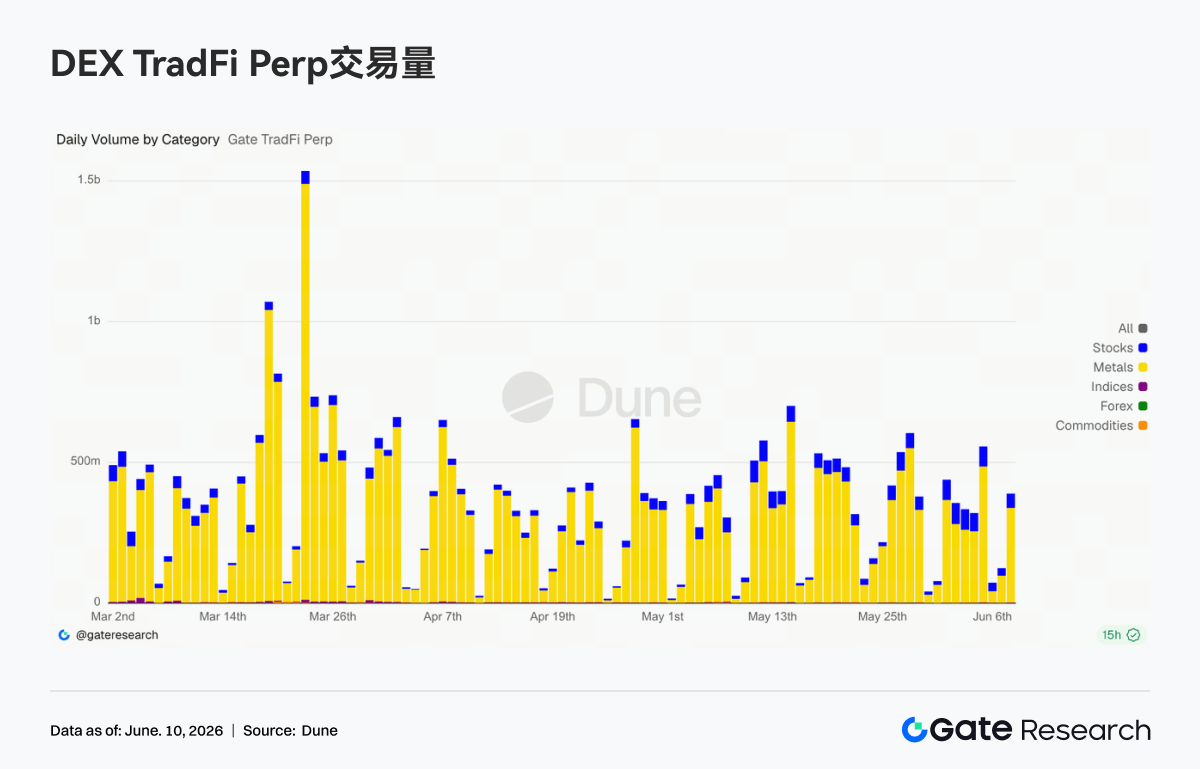
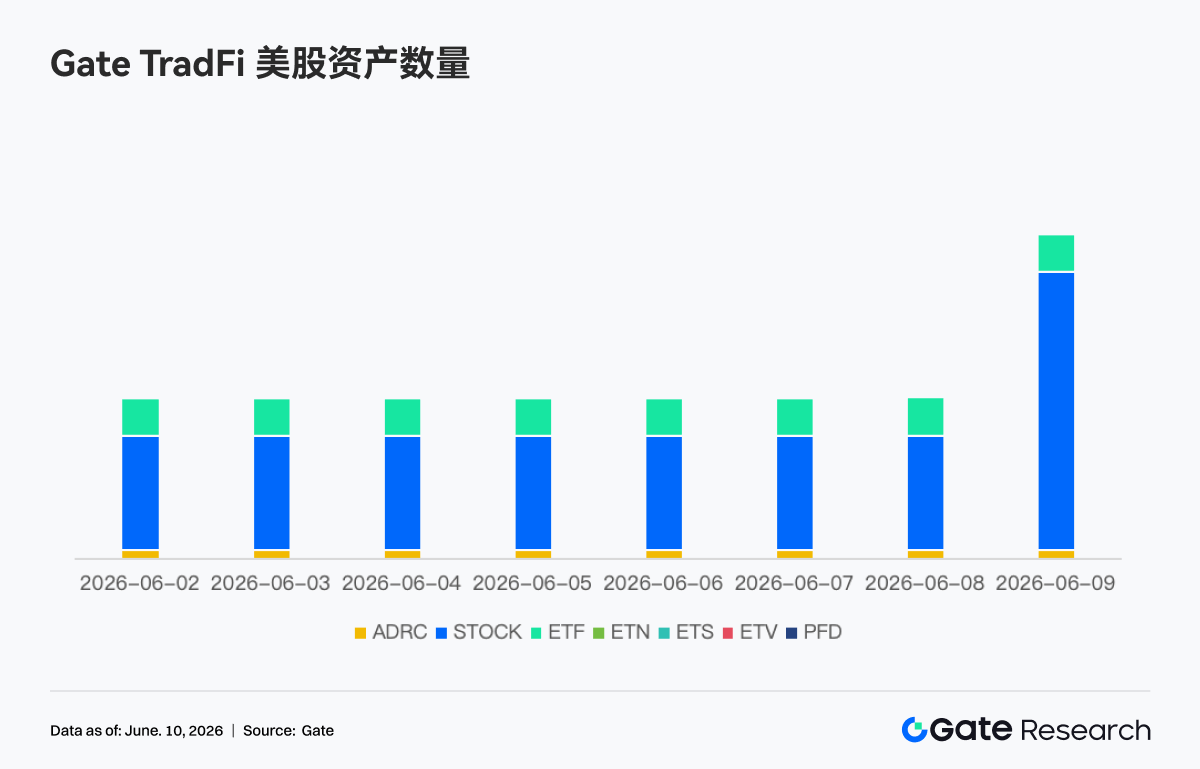
• TradFi Perp DEX trading volume remained high, with the proportion of trading in stocks and ETF assets continuing to rise; the number of assets on Gate's US stock trading platform expanded rapidly after launch, indicating that on-chain trading is accelerating its extension into traditional financial markets.
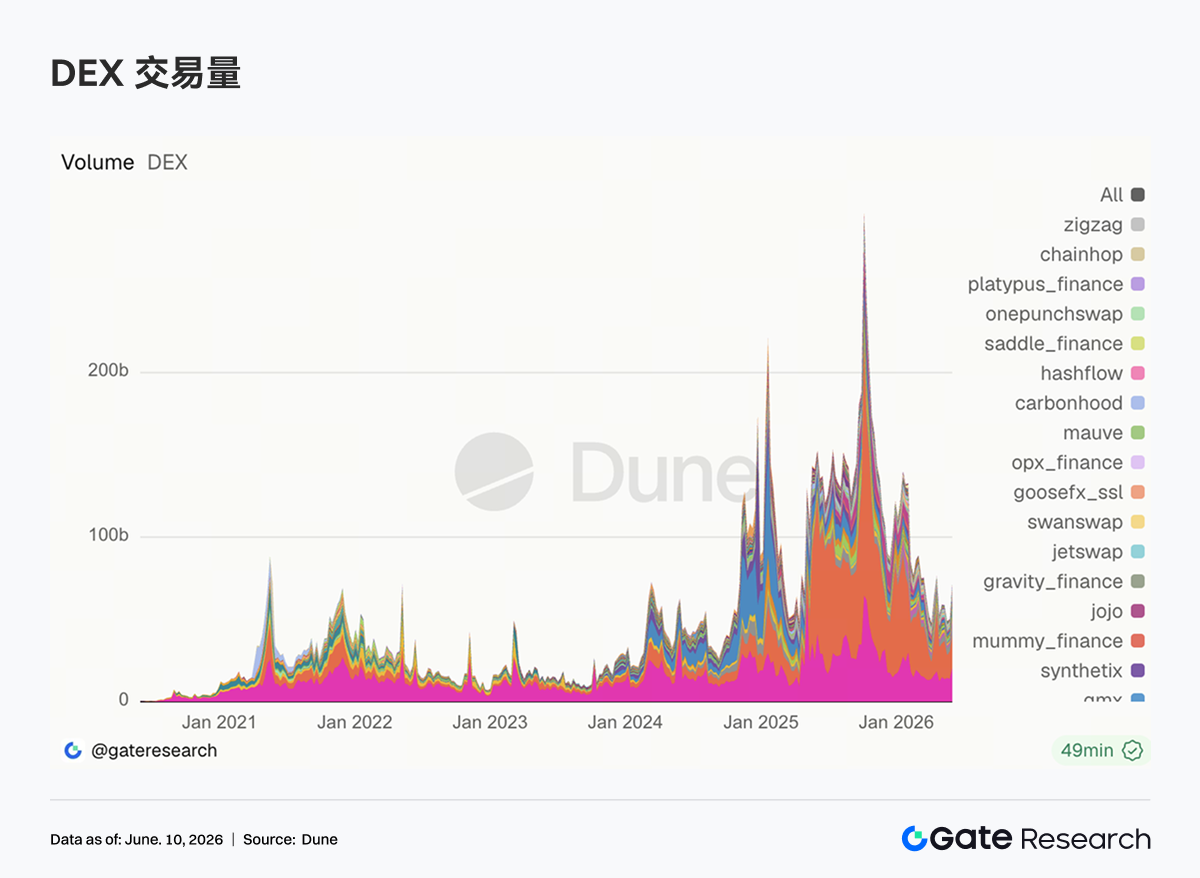
• DEX trading saw a clear回暖, with volumes increasing for major protocols like Uniswap, PancakeSwap, and Aerodrome; the total stablecoin supply slightly decreased; the LST sector broadly declined; Aave's lending scale continued to fall, with new demand mainly flowing to emerging ecosystems like MegaETH.
• BTC dropped from around $73K to near $62K, with OI decreasing by over 15%; the 25D Skew fell to extremely negative levels, and DVOL briefly rose to 52-54, indicating a surge in market risk aversion and short-term put protection demand reaching cyclical highs.
• This week, the market will focus heavily on macro data like the May CPI; events such as ETH Conf 2026, Crypto Convergence 2026, and the ETH Global New York Hackathon are expected to boost ecosystem attention.
• Gate's institutional spot trading volume increased by 92.16% WoW; CrossEx's trading volume grew by 47.1% WoW. The Gate Institutional Circle Amsterdam event was successfully held, attracting over 100 global market makers, asset managers, and other clients.
1. Market Focus Interpretation
Last week, the global macro market experienced a dramatic shift from "sentiment heating up" to "rapid reversal." At the beginning of the week, geopolitical tensions in the Middle East showed signs of de-escalation, with US-Iran negotiations interpreted by outsiders as nearing a final stage. Coupled with the continued strength of AI-related tech stocks, major US stock indices rallied, and the S&P 500 hit an all-time high during the week. Meanwhile, although Brent crude oil prices rose slightly due to geopolitical risk premiums, they failed to effectively break through the psychological barrier of $100 per barrel. Inflation expectations remained relatively controllable, and the overall market was awash with optimism. Entering the latter half of the week, Iran's official stance hardened, geopolitical signals diverged again, putting temporary pressure on the market, but sentiment remained within a controllable range.
The May non-farm payroll report released on Friday became the ultimate macro trigger for the week. Non-farm payrolls added 172,000 jobs, nearly double the market expectation of 88,000, and the previous month's figure was revised upward. The unemployment rate remained at the full employment level of 4.3%. This strong data completely shattered market expectations for a near-term Fed rate cut. Interest rate futures markets immediately repriced, with the implied probability of a 25-75 basis point rate hike before year-end surging to around 72%. The S&P 500 plummeted about 2% that day, the Nasdaq fell 3.4%, and the S&P implied volatility index surged 28% in a single day, its largest single-day drop in nearly 8 months. The 10-year US Treasury yield broke above 4.55% from around 4.44% the previous weekend, returning to the critical 4.50% level – historically, this level often constitutes a valuation inflection point for high-duration tech and AI assets. In energy, Iran announced the end of its military operations against Israel over the weekend, causing oil prices to fall. Futures markets rebounded on Monday, and the geopolitical risk premium temporarily narrowed. Overall, the macro narrative for the week quickly shifted from "betting on easing" to "high rates for longer," which was the core external driver for the synchronous sharp correction in the crypto market.
In the crypto market, Bitcoin fell about 15% for the week, Ethereum dropped about 22%, altcoins saw even deeper declines, and the total crypto market cap evaporated over $300 billion in a single week. The Fear and Greed Index briefly fell into the "extreme fear" zone, with overall sentiment rapidly cooling alongside macro risk appetite.
2. Liquidity Analysis
2.1 BTC and ETH ETFs Maintain Overall Net Outflow Pattern
This week, the Bitcoin spot ETF maintained an overall net outflow pattern, but saw a potential historical turning point on June 5th. Since the April CPI data release on May 12th, total net redemptions from BTC ETFs amount to approximately $54 billion, with 13 consecutive trading days of outflows marking the longest net outflow streak since the product's launch. Under this pressure, the total assets under management (AUM) of all Bitcoin ETFs plummeted from about $104.29 billion at the start of the outflow period to roughly $80.4 billion, a decline of over 22%; total BTC holdings fell to about 1,277,000 BTC, roughly 7.2% below the all-time high in October 2025, and only slightly above the cycle low of about 1,274,000 BTC on February 23rd. On the price front, BTC oscillated violently within the $59,000-$64,000 range this week, suppressing both AUM and holdings simultaneously.
From a broader perspective, the core driver of this BTC ETF net outflow is institutions reassessing the Fed's policy path following the April inflation data, rather than a fundamental change in their view of Bitcoin itself. BlackRock's IBIT still held around $67 billion in AUM as of early May, firmly holding its position as the world's largest crypto ETF, with large institutions showing an increasingly clear tendency to "buy more as prices fall." A true inflection point for trend inflows may need to wait until after the May CPI data is released on June 11th and a new market consensus forms regarding the Fed's path for the second half of the year.
Ethereum spot ETFs experienced a more severe liquidity situation than Bitcoin this week: after 17 consecutive trading days of net outflows, only a marginal net inflow was recorded on June 5th, marking the end of this prolonged outflow window. Since their listing in 2024, cumulative net inflows for the ETH ETF product category stand at about $11.21 billion. However, sustained redemptions this year have caused total AUM to retreat roughly $2 billion from its year-to-date peak, falling to about $9.78 billion, representing approximately 4.57% of Ethereum's circulating market cap. Compared to the simultaneous greater market penetration of Bitcoin ETFs, Ethereum ETFs' institutional appeal remains weaker than their older sibling, with larger price declines further accelerating the AUM contraction rate relative to Bitcoin.
2.2 TradFi Liquidity
• TradFi Perp DEX: Over the past week, the overall trading volume in the TradFi Perp DEX market remained at high levels, though down from the peak in March. By asset class, commodities remained the dominant sector, accounting for the majority of trading volume. Contracts related to precious metals like gold continued to attract capital, reflecting strong demand for safe-haven assets amid macro uncertainty. The equity sector showed steady growth, with its share of volume continuously increasing, indicating rising on-chain user demand for trading traditional equity assets like US stocks. Meanwhile, Indices/ETFs became the second-largest trading category, maintaining high transaction volumes and providing users with convenient index-based allocation tools.
• Gate TradFi Perp Volume: Last week, Gate TradFi Perp trading volume remained broadly active. Influenced by gold price fluctuations and increased macro safe-haven demand, trading volume in the precious metals sector mostly ranged between $300 million and $600 million on most days. Concurrently, trading volume in equity-linked contracts further increased, with its proportion significantly expanding compared to April, indicating users' continued increasing participation in US stocks and related assets.
• Gate TradFi US Stock Asset Count: Gate officially launched its US stock trading service on June 2nd. Leveraging advantages such as real underlying asset backing, direct trading with USDT, no overnight holding fees, and high liquidity, the service has garnered sustained market attention and steadily growing trading volume since its launch. Currently, Gate supports 7 major asset classes: ADRCs, Stocks, ETFs, ETNs, ETSs, ETVs, and PFDs, and continues to expand product coverage. In terms of asset count, the total number of tradable instruments has doubled since launch. Among them, the stock category has seen the most significant growth, with its share of all assets rising from roughly 70% at launch to 85%, further enriching users' investment choices. Going forward, Gate will continue to promote access to more markets, global liquidity integration, and cross-market trading capabilities, constantly expanding diversified asset coverage to further strengthen its strategic positioning as a global asset trading and market access platform.
• TradFi Order Book Depth: We selected XAUT, which has the highest TradFi trading volume, to analyze its order book depth (Delta). Based on the changes in XAUT's order book liquidity over the past week, the market exhibited a pattern where sell-side depth dominated, and buy-side support strengthened periodically but lacked sustainability. Between May 28th and 29th, the order book saw positive liquidity inflows exceeding $1 million, pushing the XAUT price rapidly from around $4,380 to above $4,500, indicating buyers actively replenishing depth and supporting price appreciation. However, since May 30th, the order book has experienced continuous negative liquidity changes. Notably, around June 2nd, the sell-side depth increased by over $3 million net in a single hour, representing the largest selling pressure area in this cycle. Subsequently, the XAUT price continued to decline from around $4,500. Although several instances of buy-side liquidity replenishment exceeding $1 million occurred after June 6th, the price rebound was limited, suggesting that the new buy orders were more about absorbing selling pressure than driving a trend reversal. As of June 9th, the order book Delta remains predominantly negative, indicating that the pending order structure is still bearish. In the short term, XAUT may maintain a weak oscillatory pattern. Attention should be paid to whether buy-side depth can recover sustainably and re-dominate the order book structure.
3. On-Chain Data Insights
3.1 DEX Trading Recovers, Capital Returns to Mainstream Trading Scenarios
DEX trading has clearly rebounded, with Uniswap and PancakeSwap being the main sources of volume growth. Platforms like Aerodrome, Bisonfi, Curve, and Fluid also saw synchronized volume increases, indicating capital is returning to mainstream liquidity pools and core trading venues. Trading volume on Solana ecosystem platforms like Meteora, Raydium, and Whirlpool saw some recovery, but growth related to PumpSwap and pump.fun chains has been relatively limited, with Meme trading activity continuing to weaken.
3.2 Stablecoin Supply Slightly Contracts, Competition Focus Shifts to Payments and Cross-Chain Infrastructure
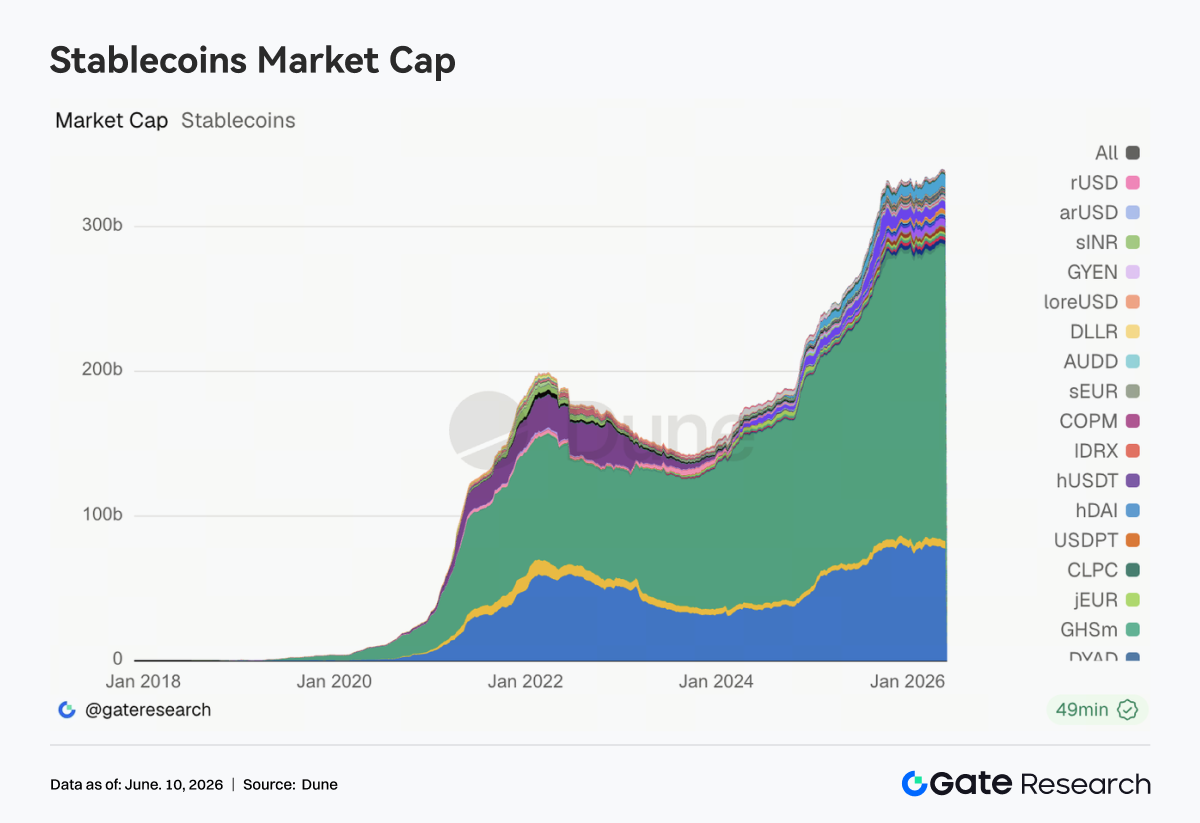
Total stablecoin supply contracted slightly overall, with the market caps of major stablecoins like USDT, USDC, USDS, DAI, and PYUSD mostly declining, while GHO remained relatively stable. Compared to short-term market cap changes, the competitive focus in the stablecoin sector is shifting towards payment networks, cross-chain liquidity, and regulatory compliance capabilities. Discussions surrounding the mechanisms and market structure of yield-bearing stablecoins are intensifying in the US, with clear divergence in development paths between the traditional banking system and crypto institutions. Meanwhile, Circle continues to advance CCTP V2, multi-chain settlement support, and developer ecosystem building, further solidifying USDC's infrastructure positioning in cross-chain transfers, transaction collateral, and institutional settlement scenarios. Competition in the stablecoin industry is gradually transitioning from issuance scale expansion to building capabilities at the payment and clearing layers.
3.3 LST Sector Broadly Declines, Capital Continues Reducing Yield Asset Exposure
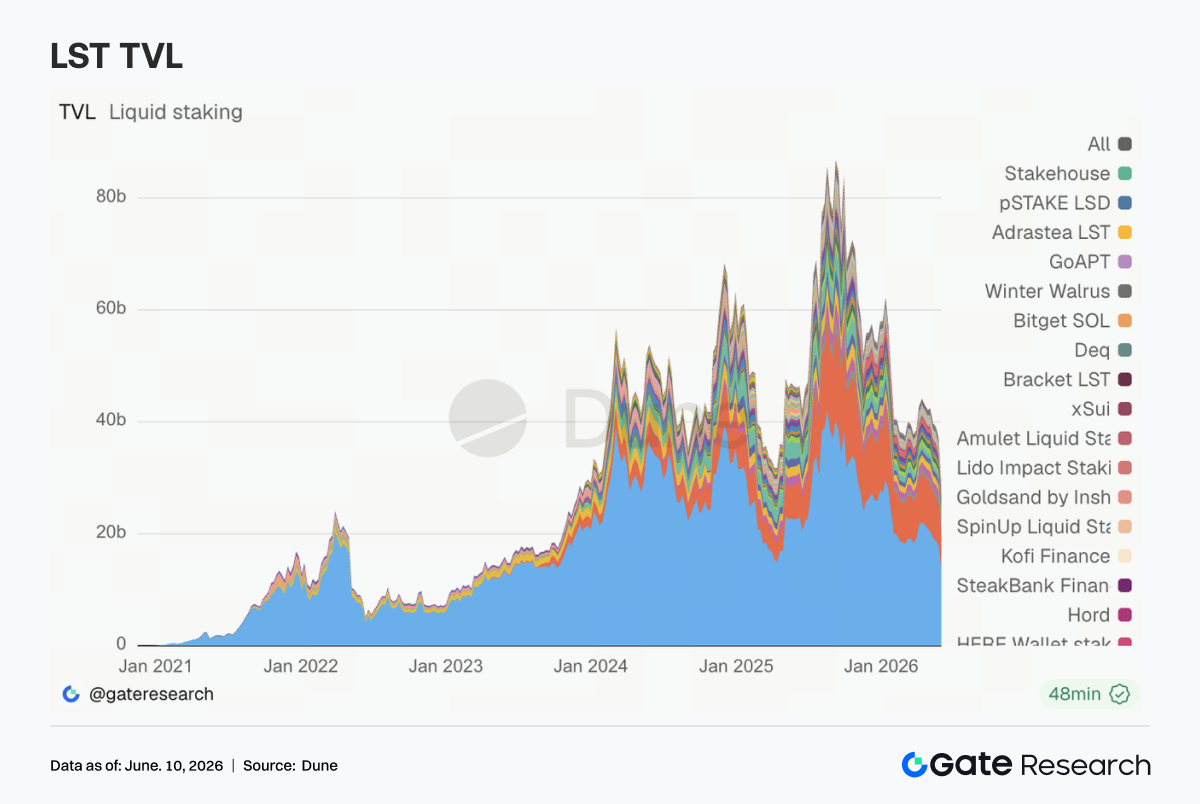
The LST sector faced broad pressure. Players in the ETH ecosystem like Lido, Rocket Pool, and StakeWise all declined, while SOL ecosystem protocols Sanctum, Jito, and Jupiter Staked SOL also weakened simultaneously. Unlike previous periods where capital rotated between different staking protocols, this week saw a sector-wide reduction in positions. Asset price adjustments, ETF capital outflows, and decreased risk appetite for yield-bearing assets collectively drove capital to reduce staked asset exposure. Following the rsETH/KelpDAO incident, market risk assessment of wrapped staking assets has clearly become more conservative, with institutional investors increasingly focused on cross-chain security, redemption mechanisms, and underlying asset transparency. Recent discussions within Lido regarding the choice of Chainlink CCIP for its wstETH cross-chain expansion also reflect this sector's gradual shift towards prioritizing security and liquidity management capabilities.
3.4 Aave Lending Volumes Continue to Decline, New Demand Concentrated in Emerging Markets
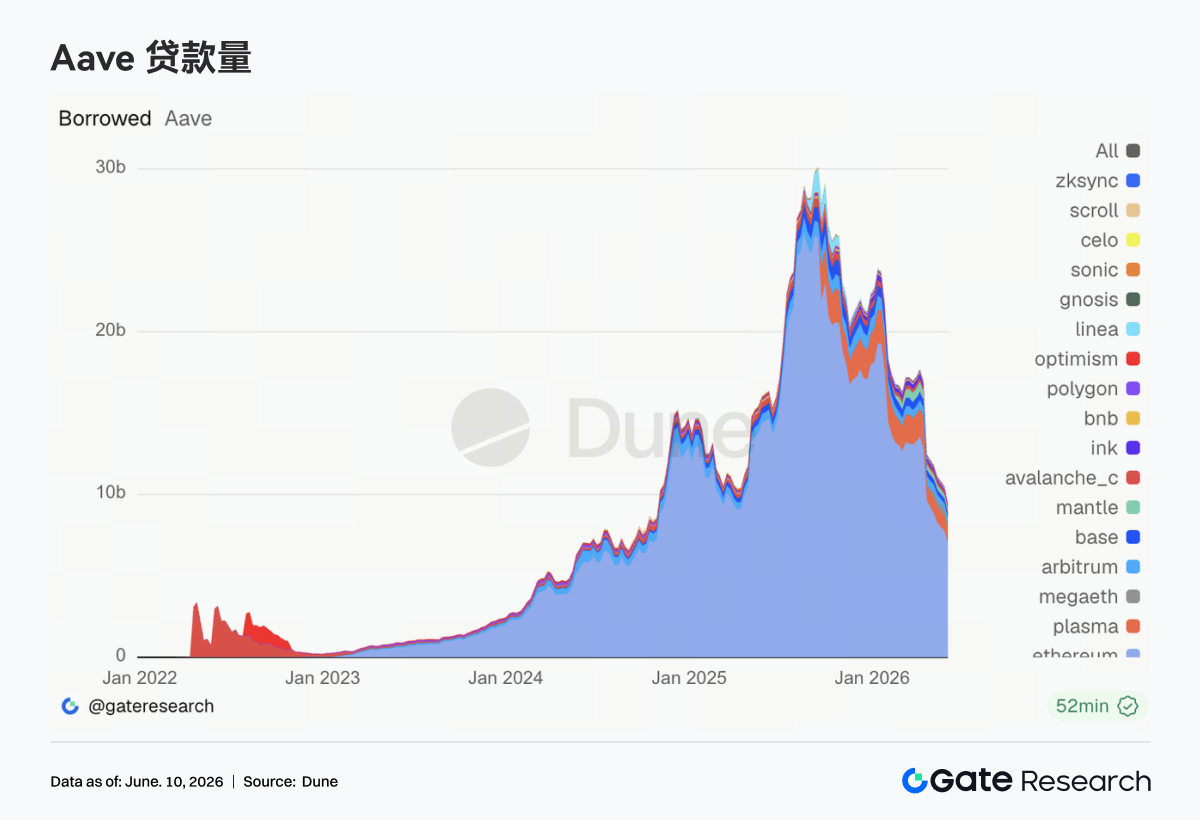
Aave's total borrowing balance continued its downward trend, with major markets like Ethereum Main, Plasma, Arbitrum, Base, and Mantle all seeing decreases compared to the previous week. Ethereum remains the largest lending market but was also one of the main sources of lending contraction this week. In contrast, MegaETH emerged as one of the few markets showing relative resilience, with new borrowing demand concentrating in emerging ecosystems offering stronger incentives and faster growth. However, this incremental growth is insufficient to offset the overall deleveraging impact on the main markets. Overall, the risk repair process following the rsETH/KelpDAO incident is ongoing. Users have become more cautious in collateral selection, leverage levels, and cross-chain allocation. On the governance front, the Aave community continues to advance discussions around the Emergency Guardian, USDC liquidity buffer mechanisms, and V4 architecture upgrades, with risk management capabilities becoming a crucial component of protocol competitiveness.
3.5 Aave Core Lending Rates Stabilize, Liquidity Pressure Eases Significantly
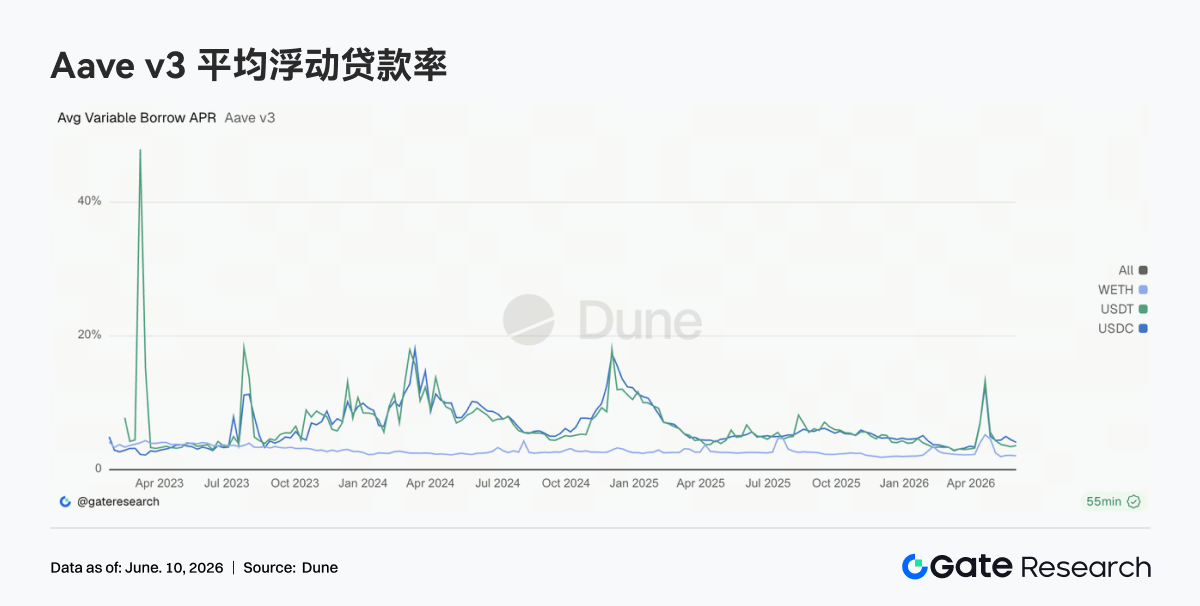
Lending rates for Aave core assets have generally stabilized. USDC borrowing rates have fallen from their previous highs, WETH continues to trade at low levels, and USDT saw only minor fluctuations. Compared to the liquidity shock period in April, the market has largely returned to a normalized funding environment. Although USDC experienced brief rate increases due to higher utilization in certain periods, the overall volatility has significantly subsided. Recent discussions within the Aave community regarding USDC liquidity buffers and interest rate model optimization also help reduce drastic cost fluctuations under extreme conditions. The current rate structure suggests the market prefers using stablecoins for short-term capital turnover rather than re-establishing significant directional leverage.
3.6 Hyperliquid Drives Revenue Growth, Derivatives Infrastructure Continues to Benefit
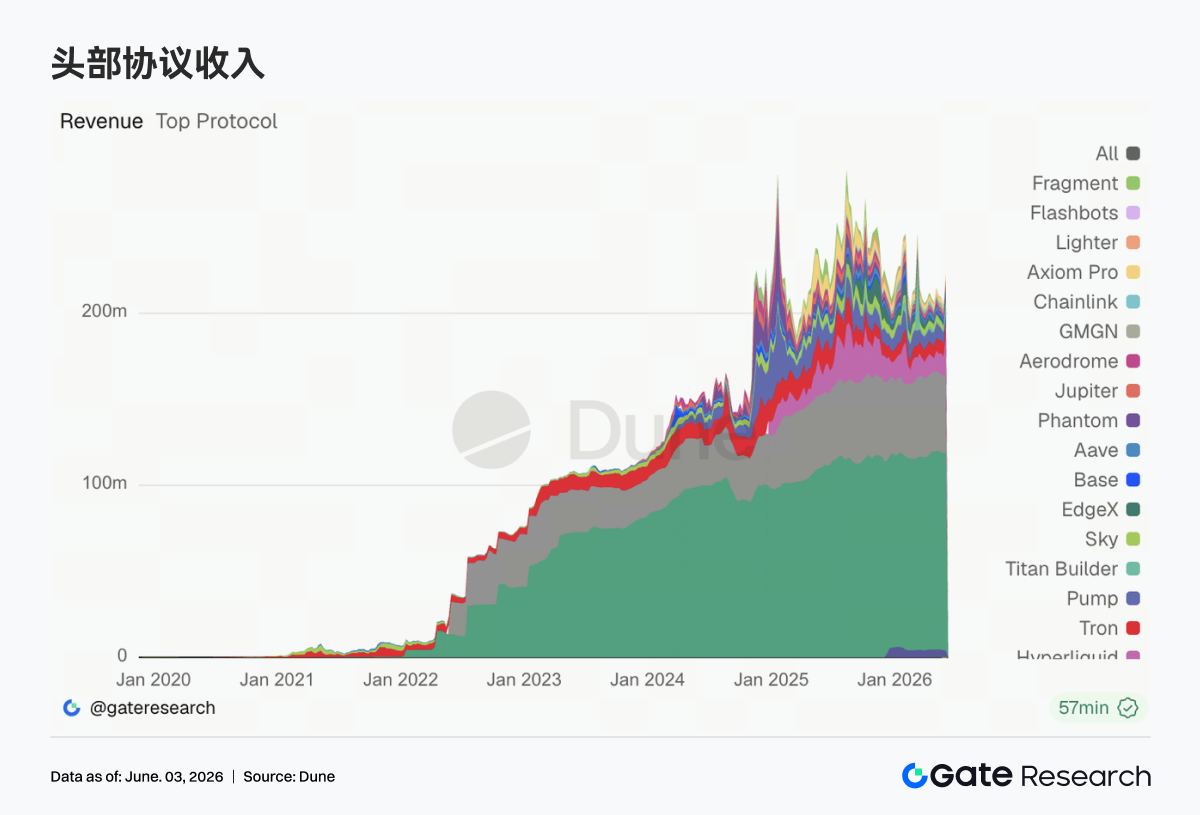
The biggest highlight in protocol revenue this week came from Hyperliquid. Revenue from its Perps business grew significantly, complemented by increases in spot order book and L1-related revenues, making it one of the strongest revenue growth protocols this week. This trend aligns closely with market focus. HYPE's market cap performance continued to strengthen in early June, with increasing market discussion about Hyperliquid's growing global market share in perpetual swaps. Concurrently, new products like equity index perpetuals and Pre-IPO Perpetuals are gradually attracting trading activity, with capital beginning to expand from traditional crypto asset trading into the broader on-chain derivatives market. Furthermore, Tether and Circle continued to contribute stable revenues, but with limited growth elasticity; Aave V3 revenue showed some recovery, driven more by spread income after risk premiums returned; platforms relying on Meme trading activity, like Pump and Axiom, continued to decline. From a revenue structure perspective, long-tail speculative assets are being neglected by capital, while core trading infrastructure capable of matching, clearing, and settling continues to gain favor. Hyperliquid's sustained growth further reinforces the capital appeal of derivatives protocols in the current market cycle.
4. Derivatives Tracking
4.1 BTC Funding Rate Maintains Positive but Price Declines Rapidly, Leveraged Longs Liquidated En Masse
From June 1st to June 7th, 2026, the BTC price experienced a significant decline, rapidly falling from around $73K at the start of the week to approximately $62


