






Gate Institutional Weekly: Warsh Takes Over as Fed Chair, Aave Lending Demand Continues to Migrate


- Core View: Last week, the crypto market showed caution against the backdrop of macro events (US-Iran negotiations, Fed leadership change) and continued ETF net outflows. BTC and ETH experienced deep pullbacks before recovering. On-chain capital structure is undergoing a shift, with TradFi trading focus moving back from commodities to equities. Cross-chain security risks are highlighted, and the derivatives market presents a weak consolidation pattern characterized by low leverage and low volatility.
- Key Elements:
- Macro Pressure & ETF Outflows: The shifting US-Iran negotiations, US bond yields rising to 4.56%, and the Fed leadership change suppressed risk appetite. BTC and ETH ETFs recorded weekly net outflows of $1.256 billion and $216 million respectively, indicating pessimistic market sentiment.
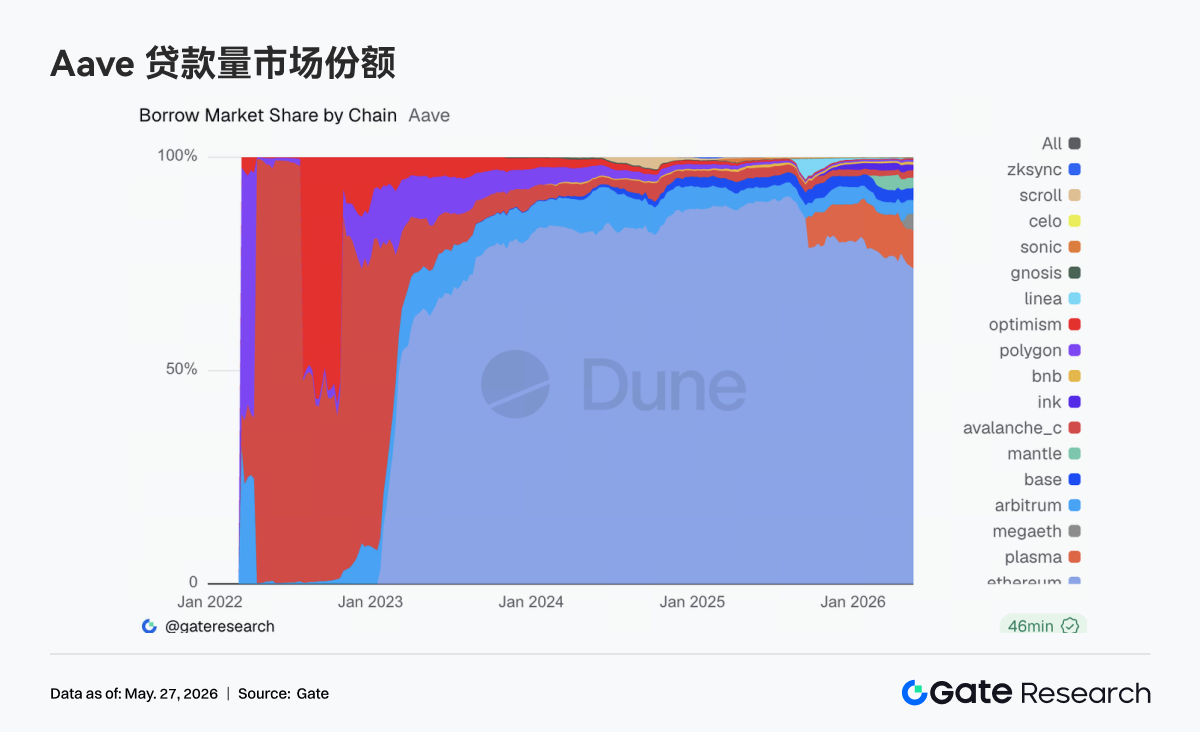
- On-chain Capital Migration: DEX trading is concentrating on leading protocols like Uniswap and PancakeSwap; Aave lending demand is migrating from Ethereum V3 to new markets such as Plasma and MegaETH.
- TradFi DEX Divergence: Gold and crude oil trading remain dominant but are cooling off, while trading activity in equities and AI-related assets has rebounded, suggesting capital is flowing back from macro hedges into risk assets.
- Cross-chain Security Losses: Cross-chain infrastructure has accumulated nearly $400 million in losses over the past month. Attack surfaces have expanded from bridge contracts to verification networks, TSS, and off-chain RPC, leading the market to reassess related risks.
- Derivatives Weak Structure: The BTC funding rate briefly turned positive but the price remained weak, with open interest (OI) oscillating at low levels. Options volatility (DVOL) declined to around 36, while the skew has recovered but remains negative, indicating no market panic but persistent demand for downside protection.
Summary
• Last week, the market was driven by US-Iran diplomatic negotiations, a surge in US Treasury yields, and a change in Fed leadership, leading to significantly increased volatility in global risk assets.
• Amidst continued net outflows from ETFs, both BTC and ETH experienced deep pullbacks before recovering, though overall market sentiment remained cautious.
• On-chain capital continued to migrate to execution layers like Arbitrum and Base, while capital flows into main chain staking, prediction markets, and macro trading themes notably cooled down.
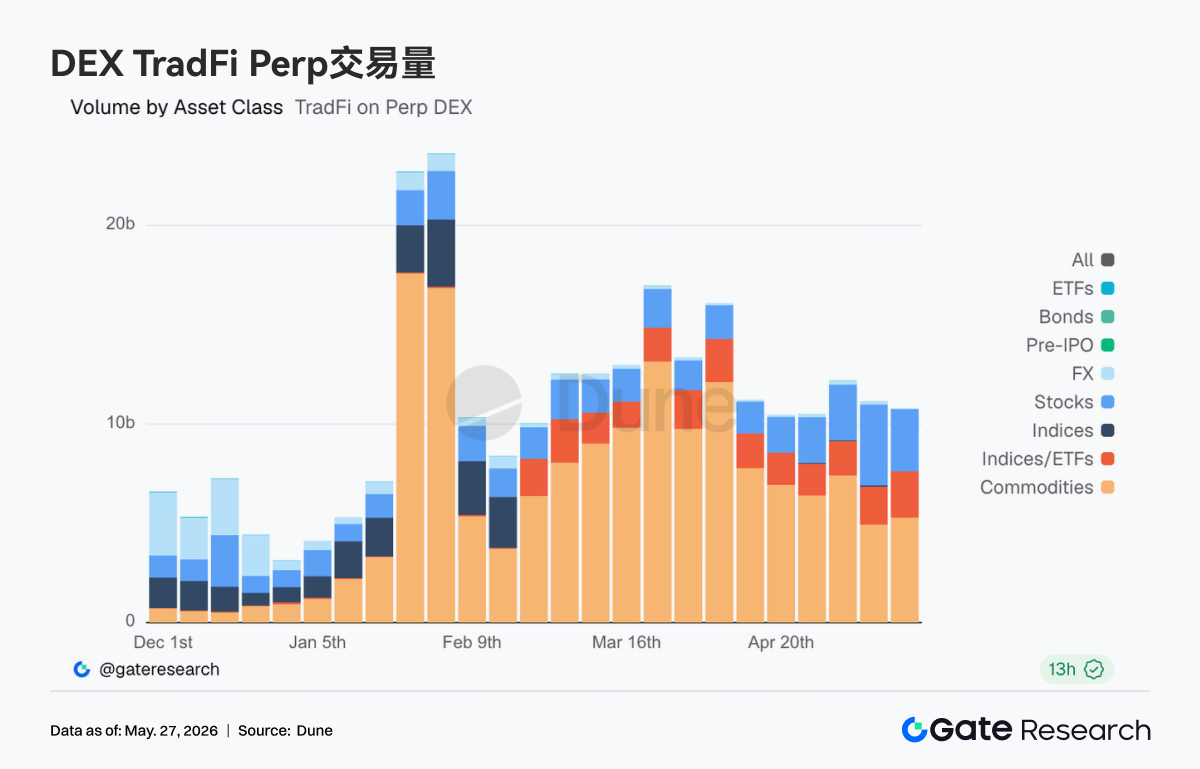
• TradFi Perp DEX trading remained focused on gold and crude oil as core themes, but activity in stock and AI-related assets began to pick up, indicating a renewed flow of capital back into risk assets.
• Cumulative losses in cross-chain infrastructure have approached $400 million over the past month. The attack surface has expanded from bridge contracts to validator networks, TSS, and off-chain RPCs, prompting the market to reassess cross-chain security issues.
• The derivatives market exhibited a "low leverage, low volatility, weak price" structure. While Skew has partially recovered, the demand for downside protection has not completely dissipated.
• Institutional contract and spot market share remained stable, with the market share of BTC/USDT and ETH/USDT increasing by 5% month-on-month. CrossEx added spot trading from a major exchange at the end of May.
1. Market Focus Interpretation
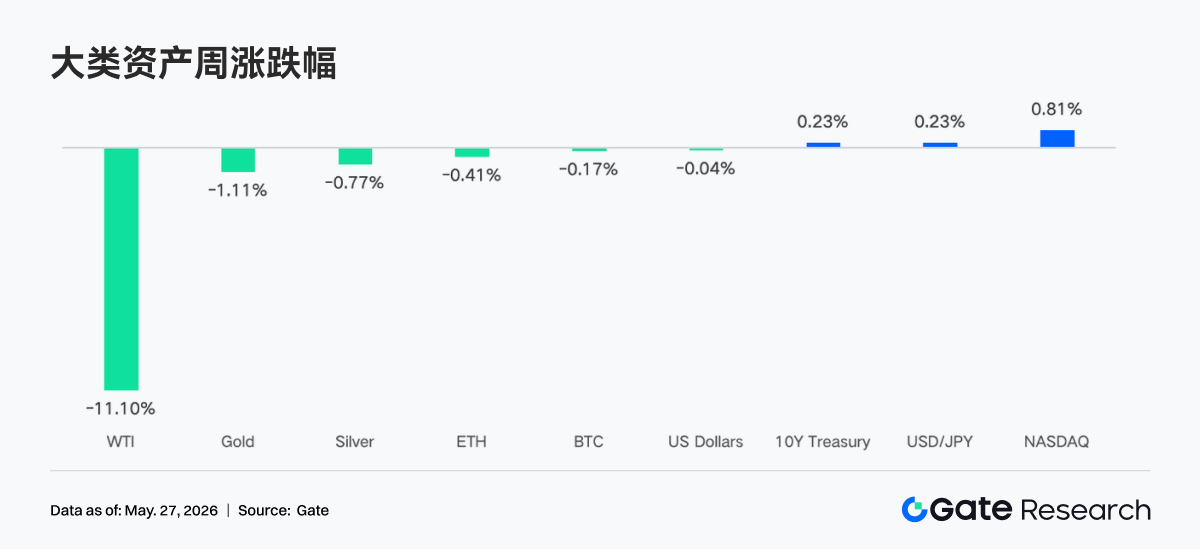
The main market narrative last week revolved around US-Iran diplomatic negotiations. Trump claimed they had entered the "final stage," but Secretary of State Rubio stated on Friday that "no agreement has been reached yet," leading to volatile movements in various assets due to geopolitical uncertainties. Suppressed by optimistic sentiments surrounding peace talks, WTI crude oil briefly fell to $98.88 per barrel. Fed Chair Powell's term ended, and Kevin Warsh was officially sworn in as the new Fed Chair on May 23rd. Although he hinted at being open to rate cuts, the market's short-term expectations for rate cuts have significantly diminished. The 10-year US Treasury yield surged to around 4.56%. US stocks rose for the eighth consecutive week, but with clear divergence. Nvidia reported Q1 revenue of $81.6 billion, an 85% year-over-year increase, significantly exceeding expectations, indicating persistent strong demand for AI infrastructure. However, the stock price reaction was muted, failing to rally significantly. SpaceX officially filed for an IPO, aiming to raise $75 billion, with a potential valuation of up to $1.75 trillion.
Overall sentiment in the cryptocurrency market last week leaned towards pessimism and caution. The sustained net outflows from Bitcoin and Ethereum ETFs reflect investor concerns about macroeconomic uncertainty, cryptocurrency price volatility, and the outlook for regulatory policies. In particular, the large-scale net outflows from Bitcoin ETFs for two consecutive weeks exacerbated market panic.
2. Liquidity Analysis
2.1 BTC and ETH ETFs Continue to Show Significant Capital Outflows
The BTC ETF market continued to show significant capital outflows last week. May 18th recorded a net outflow of $648.60 million, the largest single-day net outflow of the week. Total net outflows for the week amounted to $1,256.30 million, expanding from the previous week's $995.50 million net outflow, indicating persistently pessimistic market sentiment and continued减持 of Bitcoin exposure by institutional investors.
The Ethereum ETF market also faced capital pressure, experiencing sustained net outflows. May 18th saw a net outflow of $86.40 million, the largest single-day outflow of the week. The total weekly net outflow was $216.00 million, narrowing from the previous week's $255.20 million net outflow, but overall capital was still exiting, indicating cautious sentiment towards Ethereum ETFs as well.
• Top BTC ETF by Net Flow
○ MSBT (Morgan Stanley) recorded a weekly net inflow of $1.10 million
• Top ETH ETF by Net Flow
○ ETHB (BlackRock) recorded a weekly net inflow of $5.50 million
○ ETHW (Bitwise) recorded a weekly net inflow of $2.90 million
• Overall AUM: As of May 22nd, BTC ETF AUM stood at $98.87 billion. Ethereum ETF AUM was $13.45 billion. The BTC ETF market experienced net outflows exceeding $1.2 billion, causing a decline in total AUM, though it remained at relatively high levels.
• Institutional Movements: Institutional capital flows were clearly divergent this week. Regarding Bitcoin ETFs, most products continued to face capital outflow pressure, with BlackRock's IBIT seeing net outflows exceeding $1 billion, indicating减持 actions by large institutions. However, Morgan Stanley's MSBT bucked the trend with a small net inflow, suggesting some institutions might be engaging in tactical allocation or risk hedging. On the Ethereum ETF side, BlackRock's ETHB and Bitwise's ETHW achieved modest net inflows, possibly related to market expectations for Ethereum's future development or potential positive news, but the overall market was still dominated by outflows.
2.2 TradFi Liquidity
• TradFi Perp DEX: Over the past week, trading activity for TradFi assets on Perp DEXs remained high overall, but with a clear structural divergence. Commodity assets still dominated, particularly crude oil and gold-related trades continuing to generate the majority of volume. However, with the easing of US-Iran negotiations and declining oil prices, commodity trading volume has cooled from earlier highs. Simultaneously, the share of stock and index-related trading has increased, reflecting capital starting to flow back from macro and geopolitical trades to US equities and AI-themed directions. ETF and forex trading remained relatively stable, indicating that on-chain TradFi trading demand is gradually shifting from single event-driven to a more balanced multi-asset allocation structure.
• Gate TradFi Perp: Over the past week, trading volume on Gate TradFi Perp remained active overall but has clearly cooled down from its March peak. Structurally, precious metals still hold absolute dominance, with gold-related trades consistently contributing the majority of volume. This reflects the market's still strong demand for safe havens amidst the rapid rise in global bond yields and recurring geopolitical tensions. However, entering this week, daily trading volume has noticeably declined from previous cyclical highs, suggesting that the high-frequency trading heat around gold, crude oil, and macro events is subsiding. Meanwhile, the share of stock-related trading has picked up, especially in AI and tech assets, showing that some capital is starting to flow back from macro-hedging trades into risk assets. Trading for indices, forex, and commodities remained low and stable overall, indicating that current on-chain TradFi trading still revolves primarily around gold, but the market structure is gradually transitioning from "event-driven" to a more balanced multi-asset allocation.
• TradFi Order Book Depth: We selected XAUT, the TradFi asset with the highest trading volume, to analyze its order book depth (Delta). Last week, XAUT's order book liquidity structure underwent a transition from "bearish to bullish." In the early period of May 13th, there was an extreme negative Delta, reaching a low of nearly -$2.2 million, indicating significantly bearish market liquidity. This coincided with XAUT's rapid decline from around $4.70K to near $4.60K, suggesting strong selling pressure and liquidity order cancellations. From May 15th to 17th, Delta turned significantly positive, consistently remaining in the +$0.5 million to +$1.3 million range. This suggests buying orders began to accumulate again, with clear bid support appearing in the order book. However, the price did not rebound strongly in tandem, indicating this was more "absorptive liquidity" rather than active buying pressure. Notably, on the 24th-25th, there was a significant recovery, with green Delta bars expanding rapidly again, and the price rebounded back above $4.55K synchronously. Nevertheless, the volume of active buying orders was still insufficient to push XAUT into a strong upward trend.
3. On-Chain Data Insights
3.1 DEX Trading Maintains High Resilience, Volume Concentrates on Major Liquidity Hubs
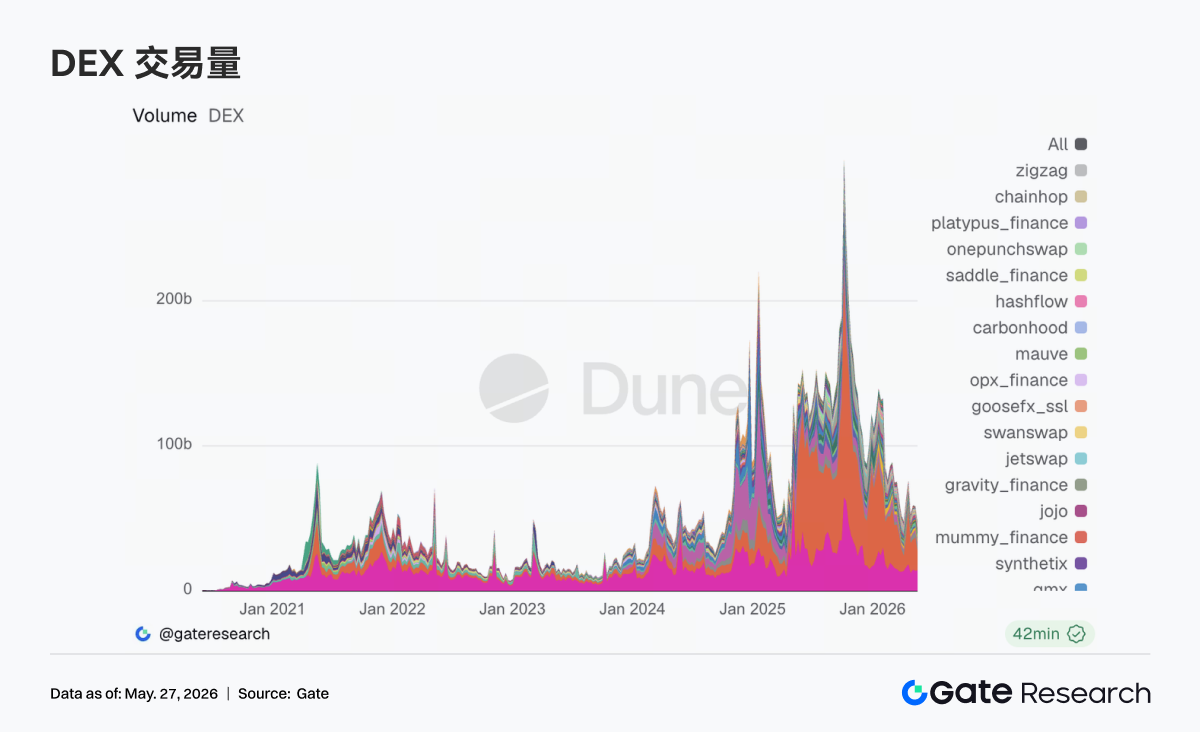
On-chain trading showed strong resilience this week despite the overall cooling of risk assets. After May 18th, Bitcoin briefly fell to a two-week low, but DEX trading volume did not correspondingly decelerate. Instead, capital further concentrated on mainstream protocols with deeper liquidity and more stable execution efficiency. Uniswap and PancakeSwap continued to hold core market share, while Aerodrome on the Base ecosystem saw further increases in activity. On-chain trading demand has not withdrawn; rather, it shows a preference for mature routing and low-slippage platforms in a volatile environment. On the Solana side, Raydium and Meteora remained at high levels, but the marginal growth rate has slowed significantly compared to previous weeks, with the heat around Meme and high-volatility pools cooling down. On the regulatory front, following the Senate Banking Committee's advancement of crypto market-related bills in mid-May, the market's valuation of compliant trading infrastructure has increased, and on-chain liquidity further consolidated towards top-tier protocols.
3.2 The Stablecoin Market Enters a Phase of Structural Repricing; Settlement Capability and Institutional Suitability Become Key Variables
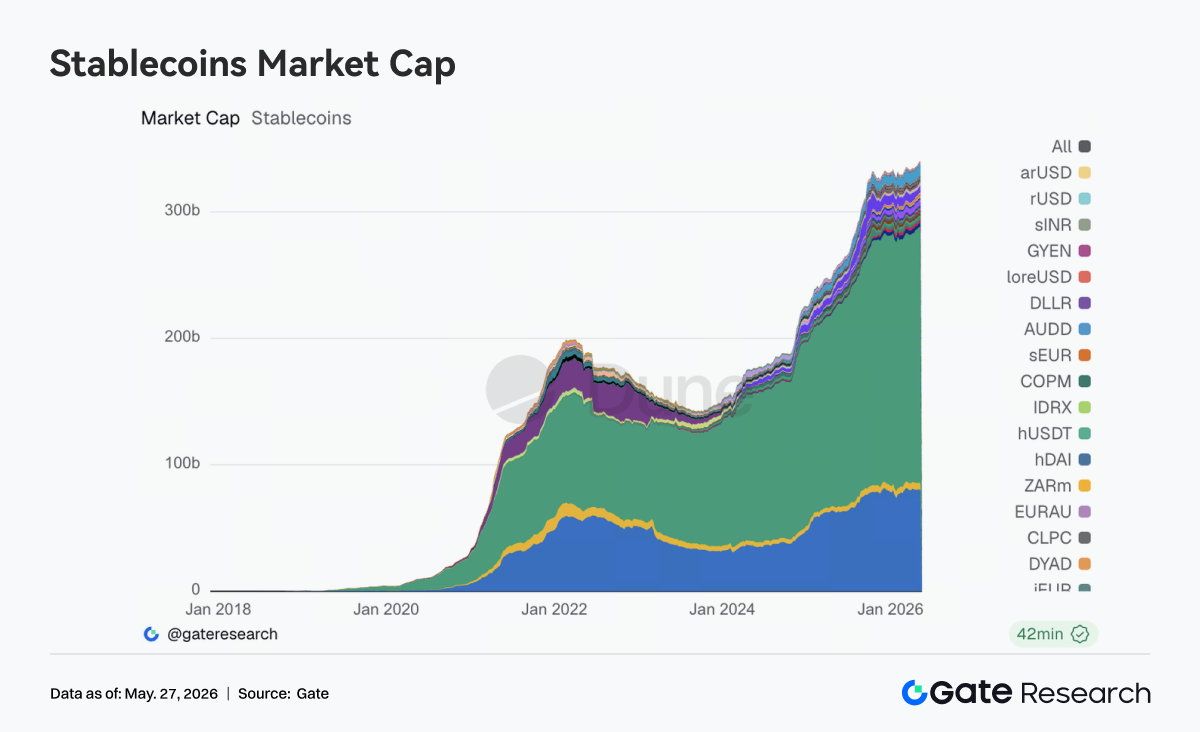
This week, the stablecoin sector did not experience rapid expansion in total supply, but internal structural adjustments continued to deepen. USDT and USDC remain dominant, however, the focus of new capital inflow has shifted from mere scale growth towards payment, clearing, cross-chain distribution, and institutional adaptability. Assets like USDS, USDe, and PYUSD still have some appeal, but the market's distinction between "yield-bearing stablecoins" and "general-purpose USD settlement assets" is becoming clearer. Circle continued to strengthen USDC's positioning in cross-chain settlement, high-frequency trading, and institutional distribution scenarios this week, refocusing the market on stablecoin assets that can directly integrate with the mainstream financial system. Concurrently, discussions at the regulatory level regarding stablecoin yield mechanisms and regulatory boundaries continue to advance, and the valuation logic for the stablecoin market is gradually shifting from prioritizing scale to prioritizing compliance standardization capabilities. Overall, sentiment in the stablecoin sector was stable this week, but the directional trend is fairly clear.
3.3 ETH LSTs Face Pressure, SOL Ecosystem Assets Relatively Stable
The liquid staking sector has entered a more pronounced phase of structural divergence. Core ETH ecosystem assets like Lido experienced some pullback, as large capital positions readjusted their holdings and duration configurations after previous recoveries. In contrast, SOL-side assets showed greater resilience, with Sanctum, Jito, and Jupiter Staked SOL remaining broadly stable, and no significant outflow pressure was observed in this sector. The key variable influencing LST risk appetite this week remained cross-chain security and asset standardization. In mid-May, Lido provided further explanation for choosing Chainlink CCIP for the cross-chain expansion of wstETH, reaffirming the market's focus on bridging security and standardized asset frameworks. Following the Kelp and cross-chain bridge incidents, the market has progressively differentiated risk levels between natively standardized LSTs and bridge-wrapped assets.
3.4 Aave Lending Demand Continues to Migrate; New Markets Show Increased Capacity
The main change for Aave this week centered on the structural adjustment of lending demand. Total borrowing across the platform decreased compared to the previous week. Ethereum V3 remains the core market, but its marginal contribution is weaker than in earlier stages. Concurrently, the borrowing capacity of newer markets like Plasma and MegaETH continues to strengthen. MegaETH, in particular, stood out, with significantly improved capital retention time and activity, gradually transitioning from narrative-driven to genuine liquidity absorption. On the governance front, on May 20th, Aave advanced the rotation of Emergency Guardian signers, elevating the priority of emergency response and cross-chain risk control. Previous governance actions concerning WETH unfreezing and LTV restoration also indicate that the protocol has progressively moved from the risk management phase following the rsETH/Kelp incident towards a phase of normalized rebuilding. Looking at the current structure, capital is flowing back into the Aave ecosystem, but it is more inclined towards on-chain scenarios offering new incentives and growth potential in new markets.
3.5 Aave Interest Rate Structure Normalizes; USD Liquidity Premium Remains Evident
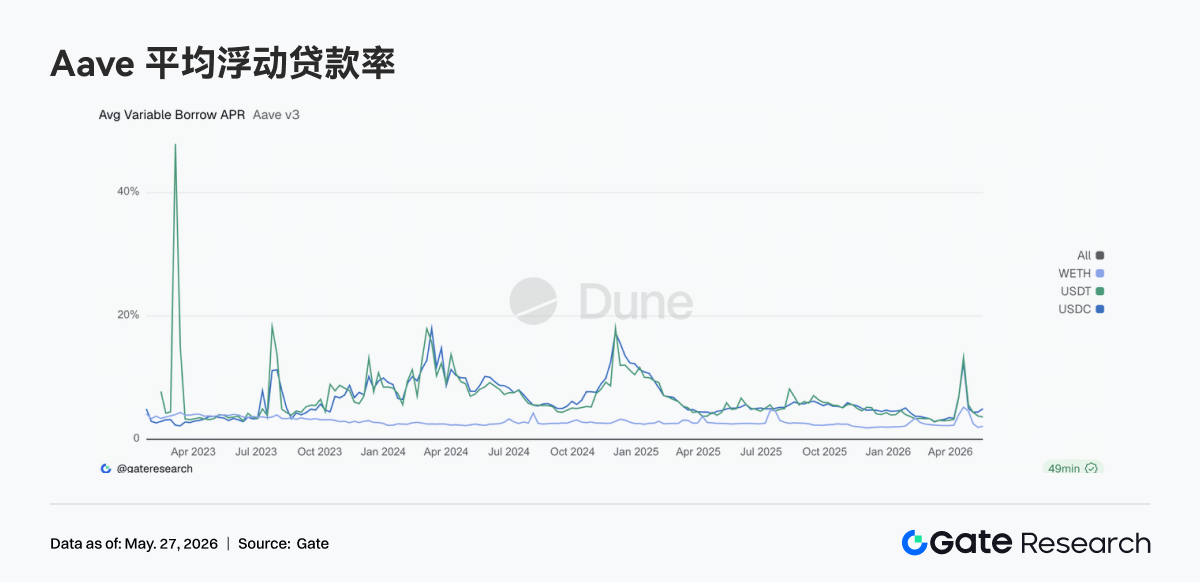
Stablecoin borrowing costs on Aave have clearly moved away from the high-stress levels experienced during the late April incident. USDT and USDC funding rates have fallen back into normal operational ranges, while WETH borrowing costs have declined further. The core change in the market currently is the return of capital usage to a normal structure. Stablecoin financing demand is mainly concentrated in arbitrage, neutral strategies, and liquidity turnover, while no new one-sided borrowing has emerged on the WETH side. However, USDC utilization remains relatively high, indicating that USD liquidity is still the asset class with the highest premium in the market. Nevertheless, the overall financing environment has significantly eased the tensions seen during the risk event period. Coupled with this week's governance actions to further strengthen the emergency mechanism and Guardian framework, the current changes in Aave interest rates represent a normalization repricing process following risk release.
3.6 Protocol Revenue Returns to a Structure Dominated by Stablecoins and Infrastructure
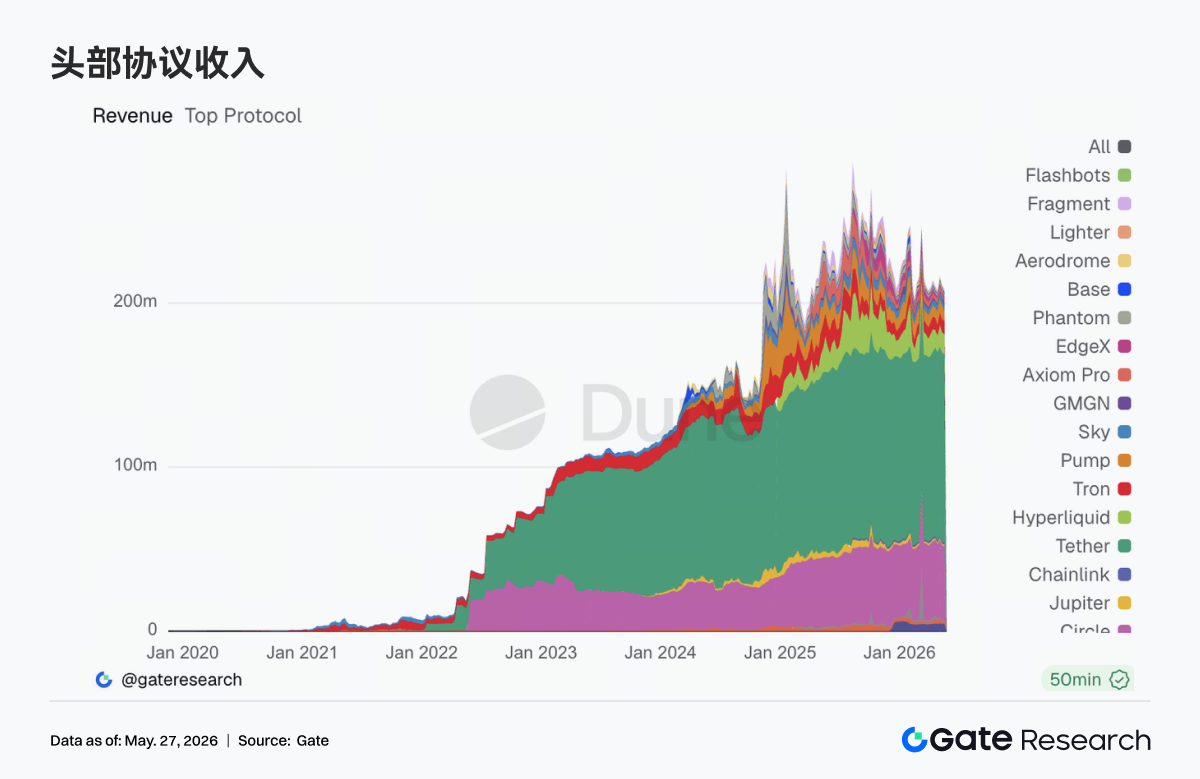
The structure of protocol revenue has become noticeably more stable compared to previous weeks. Tether and Circle continue to demonstrate the most stable revenue performance; stablecoin issuance remains the sector generating the highest quality on-chain cash flow. Regarding trading protocols, Hyperliquid's revenue continued at high levels, but the growth rate has clearly slowed down. Revenue from protocols driven by trading interfaces and high-frequency traffic, such as Pump, Phantom, and Axiom, has also begun to cool. In contrast, underlying infrastructure layers like edgeX and Titan Builder showed stronger resilience. Hyperliquid has recently continued to expand into validators, RWA perpetuals, and event markets, while Circle has simultaneously strengthened its USDC support for Hyperliquid. The market's long-term demand for efficient on-chain trading systems remains undiminished. However, this week's revenue structure indicates that the expansion of user activity is no longer limitless, and capital is refocusing on the underlying settlement, matching, and clearing layers capable of generating sustainable cash flow. Overall, the logic behind protocol revenue is gradually returning to being driven by cash flow quality.
4. Derivatives Tracking
4.1 BTC Funding Rate Remains Positive but Price is Weak; Leveraged Longs Under Pressure
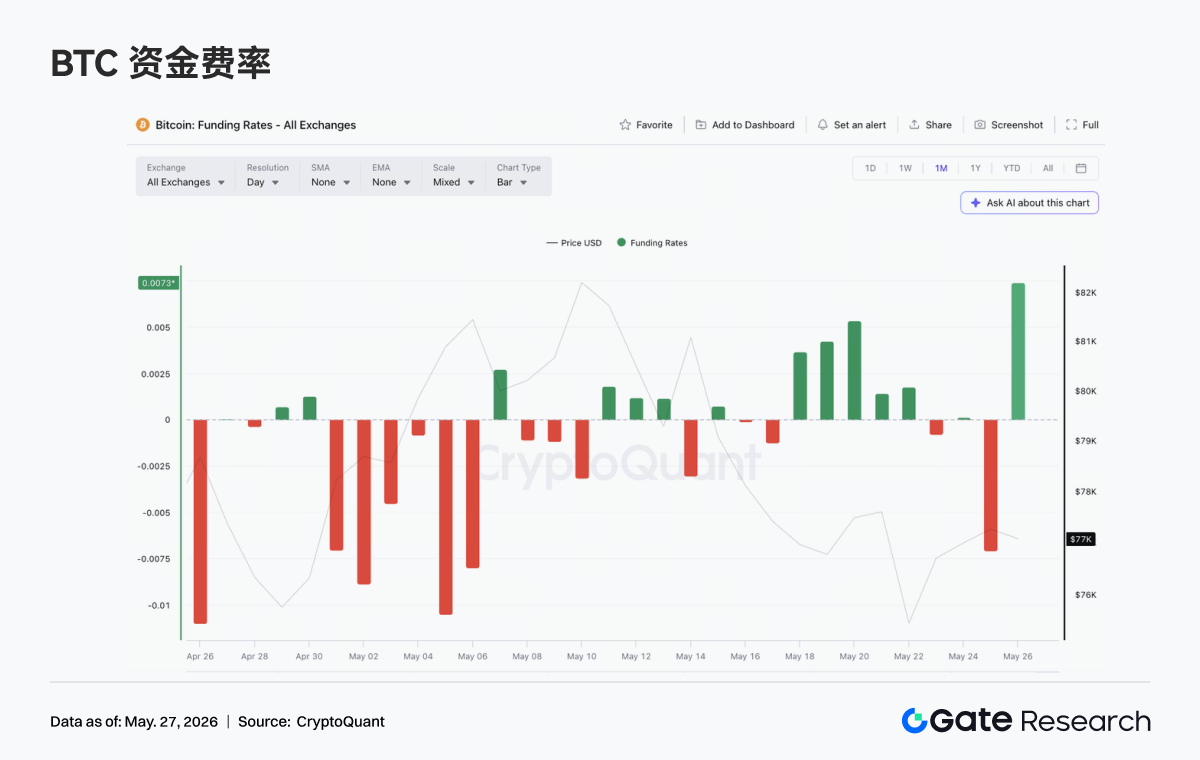
From May 18th to May 24th, 2026, BTC prices remained in weak consolidation. It traded around 77K at the beginning of the week, and despite periodic bounces, failed to effectively reclaim the 78K-79K range. Around May 22nd, prices dipped sharply before remaining at relatively low levels over the weekend. Somewhat diverging from the price action, the funding rate remained positive on multiple days between May 18th and May 22nd. Notably, the positive rate increased continuously from May 18th to May 20th, indicating that some long positions maintained leveraged exposure despite the weak price backdrop.
This combination of "weak price + positive funding rate" reflects the market's expectation for bottom-fishing or a rebound trade at the start of the week. However, as BTC failed to recover upwards, longs in a positive funding rate environment faced sustained costs. Subsequently, the funding rate gradually declined, indicating that bullish sentiment began to cool.
In terms of OI, it oscillated within the 25B-26B range this week, significantly lower than the previous high near 29B. During the rapid price drop on May 22nd, OI briefly increased back to around 26B, suggesting new directional positions entered during the decline. However, OI subsequently fell again, indicating that leveraged capital did not form a sustained accumulation. Overall, the derivatives market was in a state of low-leverage consolidation this week. The price decline reflected a reduction in risk appetite rather than a large-scale leveraged cascade.
4.2 Options Volume Declined Then Rose; Increased Proportion of Daily Options Indicates Stronger Short-Term Trading Demand
BTC options


