Monera Digital 6월 암호화폐 월간 보고서: 가장 큰 한계 구매자가 자리를 뜰 때


- 핵심 견해: 2025년 6월, 암호화폐 시장은 항복式 하락에서 장기 보유자의 조용한 흡수로 이어지는 바닥 형성 예행연습을 완료했다. 가격 반토막, ETF 사상 최대 자금 이탈, MSTR 신뢰 붕괴는 내부 청산이 깊은 물에 접어들었음을 의미하지만, 매도자 고갈이 예비 확인되었고, 물량은 약한 손에서 강한 손으로 이동하고 있다.
- 핵심 요소:
- 가격 및 레버리지 청산: BTC 월간 19.2% 하락하여 59,624달러를 기록했으며, 월간 최저 58,201달러로 사이클 고점 대비 -54% 하락하여 공식적으로 '반토막' 났다. 전체 월 파생상품 미결제약정(OI)은 누적 23억 달러 이상 감소하여 시장 디레버리징이 두드러졌다.
- 기관 매수 패러다임 붕괴: Strategy가 '절대 매도하지 않는다'는 약속을 깨고 처음으로 BTC를 매도했으며, 최대 12.5억 달러 규모의 BTC 화폐화를 승인했다. 과거 가장 가격에 둔감했던 구매자가 구조적 매도자가 될 가능성이 있다.
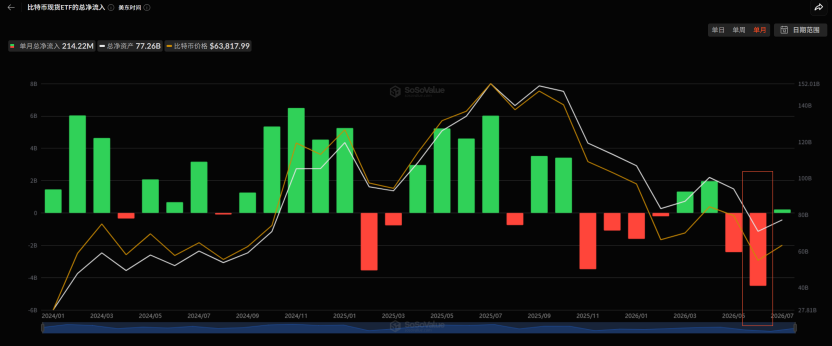
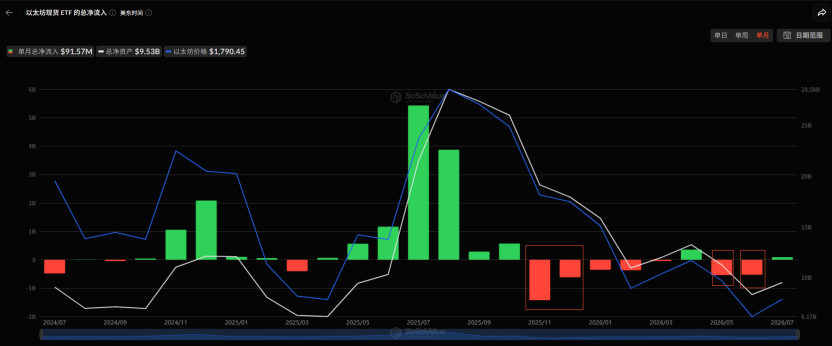
- ETF 사상 최악의 자금 이탈: BTC 현물 ETF는 월간 순유출 약 45.1억 달러를 기록하여 출시 이후 최대 월간 유출액을 기록했고, ETH 현물 ETF도 약 5.29억 달러 동반 유출되어 미국 채널 매도 압력이 주도했다.
- 거시 악재 3연타: 미국 데이터가 금리 인하를 완전히 부정했고(5월 고용 호조, CPI 및 PCE 예상치 상회), FOMC 매파적 점도표가 스태그플레이션 방향을 확인시켰으며, DXY가 주도권을 되찾아 BTC를 억눌렀다.
- 온체인 흡수 포착 및 밸류에이션 극한치: 장기 보유자(LTH)가 몇 달 만에 순매수로 전환했으며, LTH 공급 비중은 88.1%로 수년래 최고치를 기록했다. Ahr999 지수는 0.283의 '귀신 구역'으로 떨어졌고, 전체 네트워크의 손실 물량이 처음으로 이익 물량을 앞질러 물량의 대규모 이동이 진행 중이다.
- 월말 구조적 질적 변화: 베어트랩에 의한 신저점(57.8K)과 현물 매도 압력 고갈이 구분되었고, 옵션 시장의 감마 구조는 변동성 억제 쪽으로 전환되었으며, 마켓 메이커는 60-64K 구간에 가격을 매겼다. 그러나 반전의 세 가지 축(ETF, 달러, 가격) 모두 아직 성립되지 않았다.
Key Takeaways
June served as a public demolition of faith and a textbook rehearsal for bottom-building. In May, we recorded a "failure of liquidity transmission." In June, the market answered the next question: What follows that failure? It's an internal purge descending from "distribution" into "capitulation," it's the cycle's strongest narrative (the "never-sell" corporate treasury) completing its self-negation, and it's the macro environment deteriorating from "good news doesn't rally" to "actual tightening is here." But simultaneously, it was a month where long-term holders returned to net accumulation after months, and strong hands quietly absorbed coins amidst deep panic.
On the price front, BTC started the month at $73,764 and closed near $59,624, a decline of approximately 19.2% for the month. The two key lows within the month – $59,130 on June 5th and $58,201 at month-end – represent a drawdown of -54% from the cycle high of $126,000 in October 2025, officially marking a "halving" from the peak. ETH fell from $2,007 to $1,572, a monthly drop of about 22%, hitting a low of $1,505.
Three main themes defined June:
1. The Public Breakdown of the Institutional Buying Paradigm. Strategy broke its "never sell" promise early in the month, selling 32 BTC for the first time. By mid-month, its mNAV dropped to 1.02, and both equity and credit financing channels stalled. At month-end, it officially announced the "Digital Credit Capital Framework," with the board authorizing the monetization of up to $1.25 billion in BTC – turning "selling coins to pay interest" from a tail risk into an institutionalized reality. The largest price-insensitive buyer of the past two years may not only fail to return but could also become a reverse supplier of approximately 20,000 BTC.
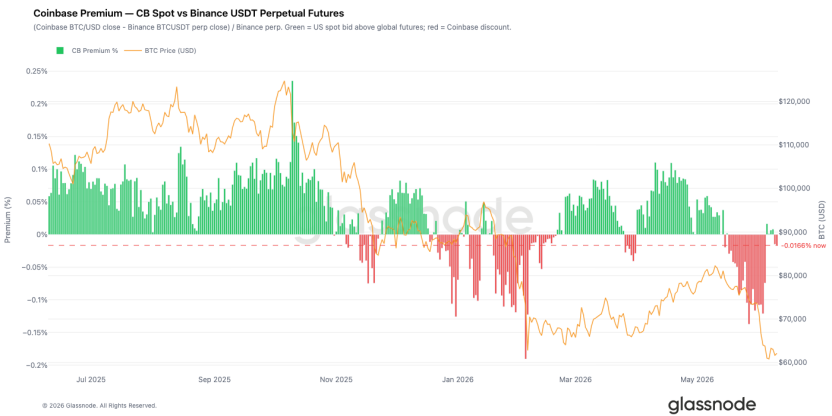
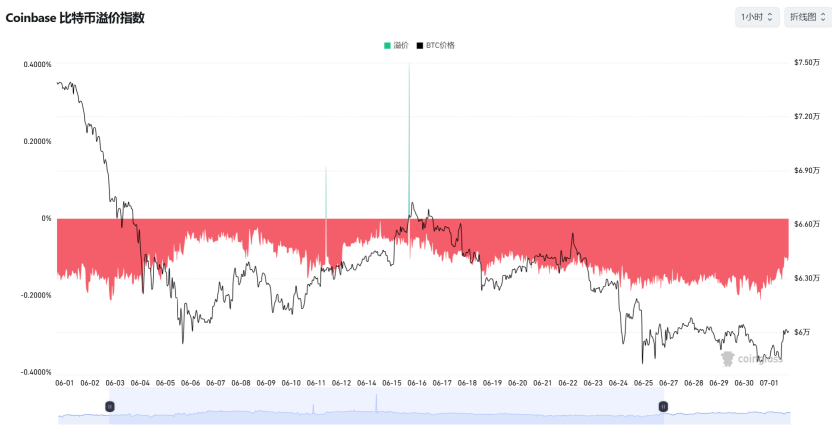
2. The Worst Single-Month Outflows in ETF History. BTC spot ETFs saw net outflows of approximately $4.51 billion for the month, the largest single-month outflow since the product's inception. This included a 10-day consecutive outflow streak and a panic-level redemption day of -$696 million. ETH spot ETFs concurrently saw outflows of about $529 million. Redemptions exhibited full-spectrum risk aversion, and with the Coinbase premium remaining negative, marginal selling pressure from US channels dominated the entire month.
3. The Complete Microstructural Evolution from Capitulation to Accumulation. The breakdown on June 24th was a "clean" capitulation driven by spot selling – pressure came from holders, with leverage merely amplifying it passively. The new monthly low of $57.8K on June 30th, however, was a bear trap – spot selling pressure was exhausted, and the final leg of the drop was purely driven by derivative shorts. This distinction is crucial: capitulation-driven declines require time for sentiment repair, while trap-driven declines only need the shorts to admit they are wrong.
Our assessment for the month: The deep bear market moved from the "mid-stage of liquidation" into the "deep zone of liquidation," completing a preliminary confirmation of "seller exhaustion" by month-end. Evidence is threefold: panic has been sufficiently released (Ahr999 dropping to 0.283, the historical "ghost zone"; unprofitable supply on the network exceeding profitable supply for the first time); strong hands have returned to accumulation (LTHs returning to net buying, their supply share rising to a multi-year high of 88.1%, with accumulation showing broad-based characteristics across cohorts); and a structural shift at month-end (BTC refused to make new lows on the day MSTR's negative catalyst was announced, and market makers shifted to long Gamma in the 60-64K range).
However, the sobering counterpoint is – none of the three conditions for a reversal were met by month-end: ETF outflows hadn't stopped, the USD hadn't weakened, and price hadn't reclaimed key resistance levels. The STH-SOPR was still 0.14 standard deviations away from the severe capitulation threshold, and the final capitulatory volatility spike often seen at historical cycle bottoms has yet to appear.
Extreme undervaluation and signs of accumulation define a bottoming zone, not a bottoming moment. June completed a preliminary, not final, confirmation of seller exhaustion. A bear trap can explain a tactical bounce, but it does not define a cyclical bottom.
I. Macro: From "When Will Rates Be Cut?" to "Rate Hikes Are Priced In"
In May, the market was still debating whether easing expectations could be repaired. In June, the macro environment delivered a triple blow to the contrary.
First blow: Data comprehensively disproved rate cuts. On June 2nd, JOLTS job openings hit 7.62 million, a nearly two-year high and 750,000 above expectations, pushing the 10-year Treasury yield back above 4.45%. On June 6th, the May non-farm payrolls report was "red hot," dousing hopes for rate cuts. The market immediately priced in a 25bp hike by December, with an October hike probability around 60%, triggering a stock market crash that day (NASDAQ -4.18%, Philadelphia Semiconductor Index -10% intraday). On June 11th, May CPI came in at 4.2% YoY, the highest since April 2023. On June 25th, Core PCE hit 3.4% YoY, the highest since October 2023, while Headline PCE at 4.1% breached 4% for the first time in three years – inflation stickiness was repeatedly nailed down by four major data releases.
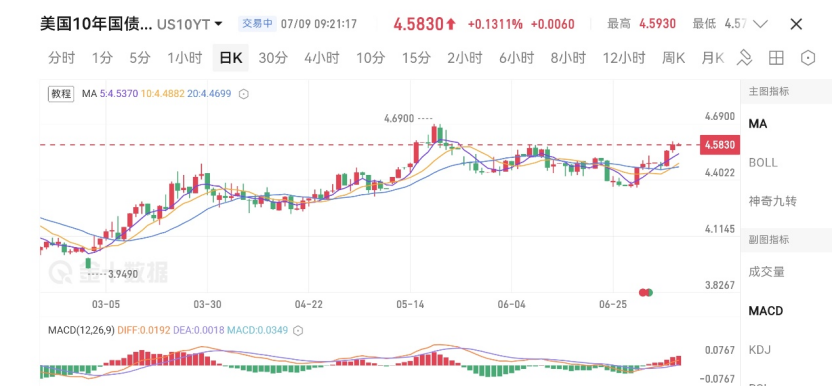
Second blow: The FOMC's hawkish dot plot delivered the final blow. On June 18th, the Fed held rates steady for the fourth consecutive time (3.5%–3.75%), but the SEP underwent a systematic revision towards stagflation: the 2026 median rate was raised from 3.4% to 3.8%, the PCE forecast was raised to 3.6%, and GDP was lowered to 2.2%. New Chair Warsh set the tone in his first press conference, stating "persistently high prices are a burden on the people." Market institutions have moved from pricing in rate cuts to pricing in rate hikes.
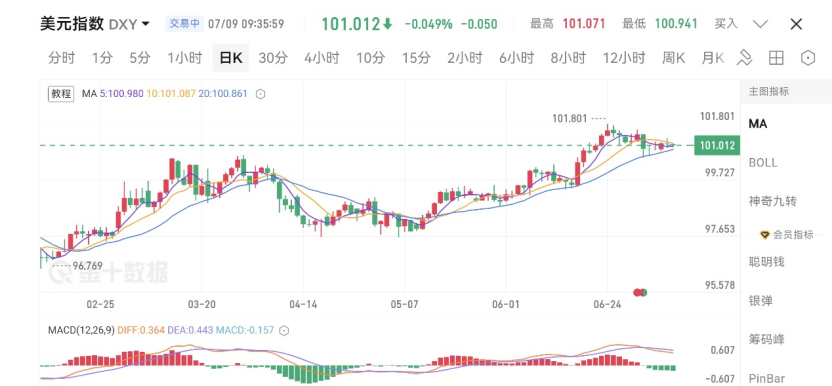
Third blow: The US dollar regained dominance. The DXY reclaimed its 200-day moving average ($101.80 vs. $98.72) in late June, the first time since the "Liberation Day" shock in April. The negative correlation of "strong dollar suppressing crypto" from 2022-23 re-established itself after a period of decoupling: the S&P 500 recovered its year-to-date losses and stood above its 200-DMA, while BTC ended the month at an 18% discount to its own 200-DMA ($76,466). Macro repair is a purely equity story; BTC didn't get a ticket. The Bank of Japan raised rates by 25bp to 1.00% (highest since 1995) on June 16th, but the Yen fell instead of rising, breaking through 162 at month-end to a nearly 40-year low, laying the fuse for intervention that threatens global risk assets.
Equity markets experienced extreme rollercoaster rides: early month, the NASDAQ broke 27,000 for the first time, the Nikkei pushed to 70,000, and the KOSPI repeatedly hit new highs with multiple bidirectional circuit breakers in a single month. The June 6th non-farm payrolls report triggered a global chain reaction crash (KOSPI -8.4% circuit breaker in one day). At month-end, the AI capex bubble was systematically priced in for the first time – the Philly Semi Index fell -7.87% on June 23rd, Apple dropped 6.1% in a single day on price increases due to "passing AI infrastructure costs to end-users," while Micron's explosive earnings and Korea's hundred-trillion-won national semiconductor investment repeatedly rescued the narrative. For crypto, the brutal reality of the month was: there was no spillover during the AI rally, but there was full resonance during the AI crash.
II. Geopolitics: Four Rounds of Rollercoaster, Crypto Only Absorbed the Bad News
The Middle East situation in June completed a full cycle of "breakdown – actual combat – agreement – re-escalation – ceasefire."
In early June, negotiations quickly deteriorated into live fire: June 2-3 saw mutual US-Iran military strikes; June 10-11 involved multiple US airstrikes on Iranian soil, Iran announcing the closure of the Strait of Hormuz, over 160 tankers stranded, and the IMO for the first time advising commercial vessels against transit – market pricing switched from a "geopolitical risk premium" to a "wartime discount rate," with WTI pushing to $96.
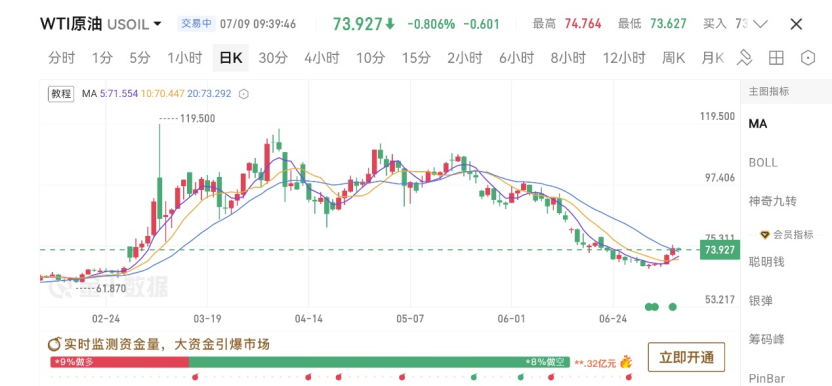
Mid-month saw a 180-degree turn: On June 14th, Trump announced a "birthday gift" agreement and the full opening of the strait. On June 17th, a Memorandum of Understanding was signed remotely and took immediate effect. Crude oil crashed from $86 to $76, gold's safe-haven premium evaporated, and BTC merely recovered to the 65-66K range – oil was repricing based on actual demand outlook, while BTC was merely repricing against a headwind that had disappeared.
Late month brought "ceasefire after agreement": On June 25th, a cargo ship was attacked by a drone, leading to renewed US airstrikes on June 26th and Iranian retaliation against US military posts. Another ceasefire was reached on June 28th with plans for Doha talks, which Iran promptly denied, and Israel publicly threatened "independent action."
Gold fell from a monthly high of $4,483 to below the $4,000 mark by month-end, losing about 10% for the month. Every injection and retracement of the geopolitical premium was fully priced by precious metals. However, BTC refused to benefit from any de-escalation and fell fully on each escalation. The "digital gold" narrative was thoroughly disproven in June. BTC was traded purely as a high-beta risk asset for the entire month.
III. Capital Flows: Largest Single-Month ETF Outflow in History, Diminishing Buyer Support
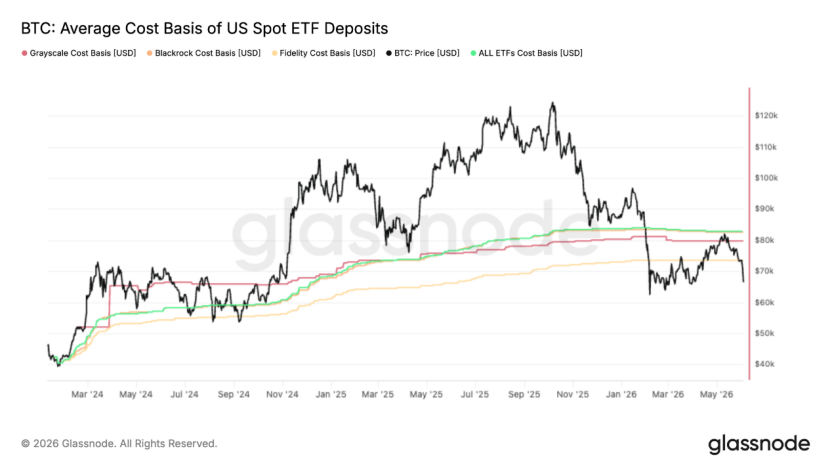
First, BTC spot ETF outflows hit a record, totaling approximately -$4.51 billion for the month, showing a pattern of "three waves of intensification": Early month during the crash saw 11 consecutive days of outflows totaling -$3.45 billion, with a peak daily outflow of -$520 million. Mid-month during the geopolitical détente saw only two or three days of small inflows, while the streak of consecutive outflow days became the longest since inception. Late month worsened despite the apparent geopolitical calm, with a new phase-high daily outflow of -$696 million on June 25th. These redemptions were "orderly but persistent," more reflective of rational profit-taking by institutions that built positions at much lower prices, rather than sheer panic – but this doesn't change the conclusion: "Good news fails to bring capital back, bad news accelerates flight." The most important marginal inflow channel was engaged in net withdrawals for the entire month. The rebound to $82.8K in mid-May was precisely rejected at the ETF aggregate cost basis of $83K. The average ETF investor was held in unrealized loss territory for the entire month, and "selling into the bounce from a losing position" created a structural supply overhead.
Second, ETH spot ETFs saw total net outflows of about $550 million for the month. The only source of offsetting buying power came from the DAT (Digital Asset Treasury) side: Bitmine increased its holdings by about 280,000 ETH against the trend, holding a total of 5.7 million ETH, while Sharplink restarted buying after an 8-month hiatus – yet overall industry DAT AuM has shrunk from $220 billion to $140 billion, and financing has largely halted except for the top two or three players. Corporate treasury net inflows plummeted from the peak of $500M+/day in April-May to near zero in June – yet another marginal buyer shut down.
Third, the Coinbase premium was deeply negative all month, but the most important marginal change appeared in late June: after BTC broke below $62K, the Coinbase Spot CVD Bias turned positive first, while Binance's remained negative – US institutions began absorbing spot, while offshore speculative capital remained on defense. Combined with Binance's order book depth imbalance turning into the strongest buy-side dominance in months, under the hedging structure of "selling ETFs + buying spot," genuine US buying power was actually reappearing at lower levels.
IV. On-Chain: Structural Shift from Rebound Invalidated to Accumulation Emerging
June presented the most contradictory yet informative on-chain picture of the entire month, showing a clear evolutionary chain of "Invalidation – Capitulation – Repair – Accumulation."
The core signal at the start of the month was the invalidation of the rebound. The 7-day moving average of the Realized P/L Ratio plummeted from 3.16 to 0.29, and the 90-day average failed to reach the 2.0 threshold. The $82K rebound was confirmed as a bear market rally, not a structural shift. The short-term holder cost basis fell below the True Market Mean for the first time since January 2022, solidifying the "late bear market" structure. Single-day realized losses swelled to $1.35 billion, with $770 million coming from the capitulation of cycle-top buyers, indicating material monetization of high-cost basis supply.
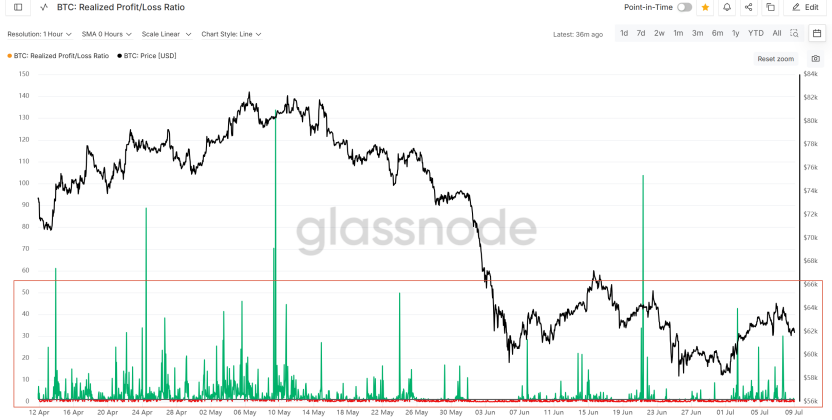
Subsequently, capitulation deepened but did not yet hit historical extremes. The AVIV z-score touched a low of -1.09, deep within the historically extreme discount zone. The percentage of short-term holder supply in profit briefly fell to just 0.6% (4-year average is 55%), meaning over 95% of new buyers were simultaneously underwater. The STH-SOPR z-score bottomed at -1.86, just 0.14 standard deviations away from the -2 "severe capitulation" threshold. The market was in a typical uncomfortable middle ground – loss realization was sufficient to confirm the deep bear market but had not yet reached the final intensity needed to catalyze a durable rebound.
In the latter half of the month, signs of repair began to appear. The short-term holder cost basis shifted down to $71.4K, marking the first time new buyers systematically built positions below the cycle average – a key early step in the formation of a bottom structure. The Net Realized P/L 90-day average remained at -$205 million per day, indicating continued downward pressure towards the Realized Price ($53.4K). The dense cluster of short-term holder supply between $66.8K and $70.7K was clearly identified as the most immediate overhead resistance zone.
The most important change at month-end was the emergence of accumulation, showing broad-based characteristics across cohorts for the first time. The LTH Net Position Change returned to positive territory, ending a prolonged phase of distribution. The Accumulation Trend Score rose significantly, with cohorts holding <1 BTC and 100–1,000 BTC showing near-perfect accumulation scores, and large holders (1k–10k BTC) simultaneously turning to net buyers. The LTH supply share rose to a multi-year high of 88.1%. Alongside this came a cycle-level milestone: the total unprofitable supply (10.83 million coins) exceeded the profitable supply (9.22 million coins) for the first time ever. Historically, this collapse in profit structure forms the breeding ground for a massive migration of coins from weak hands to strong hands.
Extreme signals on the valuation front are also worth noting. The Ahr999 reading at month-end was 0.283, a level historically seen only on a handful of occasions like the 2011 bottom, the 2018 bear market low, the March 2020 flash crash, and the November 2022 FTX crash. On the ETH side, the percentage of supply holding 3x or more unrealized profit fell to 11%, the lowest since February 2017 – the extreme compression in valuation also implies that the path of least resistance for a future rebound will encounter significantly less overhead supply compared to the previous two cycles.
In summary,