Anthropic filed three days ago—who's up 25%, and who's up just 2%? How does an IPO pull the supply chain?


- Core Viewpoint: After Anthropic filed its S-1, the market repriced the AI supply chain based on the "strength of order and cash collection verification" rather than promised amounts: power equipment maker Vertiv rose 25% over three days, while Nvidia gained only 2.1%, as AI pricing logic shifted from narrative to contracts and cash flow.
- Key Elements:
- Ranking of gains in the three trading days after the filing: Vertiv 25.0%, CoreWeave 17.9%, Oracle 14.4%, Broadcom 9.4%, and Nvidia only 2.1%.
- Anthropic's second-quarter revenue was $11.555 billion, up 144% quarter-over-quarter, with an operating margin of 8%, though it still posted an operating loss of $693 million in the first half.
- The S-1 names eight compute arrangements totaling about $657 billion, with fixed or minimum guaranteed commitments of about $265.6 billion and terms of up to 20 years.
- Cloud providers' combined quarterly capital expenditure reached $90.7 billion, Google's free cash flow was negative $9.07 billion, and Microsoft's off-balance-sheet lease commitments stood at $364.6 billion.
- Broadcom is both seller and financier: five-year rent of about $161.2 billion, plus a separate $63 billion SPV financing to purchase equipment.
- Revenue generated per $1 of compute rose from $0.40 to $2.08, with a net revenue retention rate of about 900%, though the low base warrants cautious interpretation.
- Key verification checkpoints: the January 2027 cancellation window and Broadcom's December 9 earnings report and SPV bond pricing.
The Market Gave Its Answer in Three Days
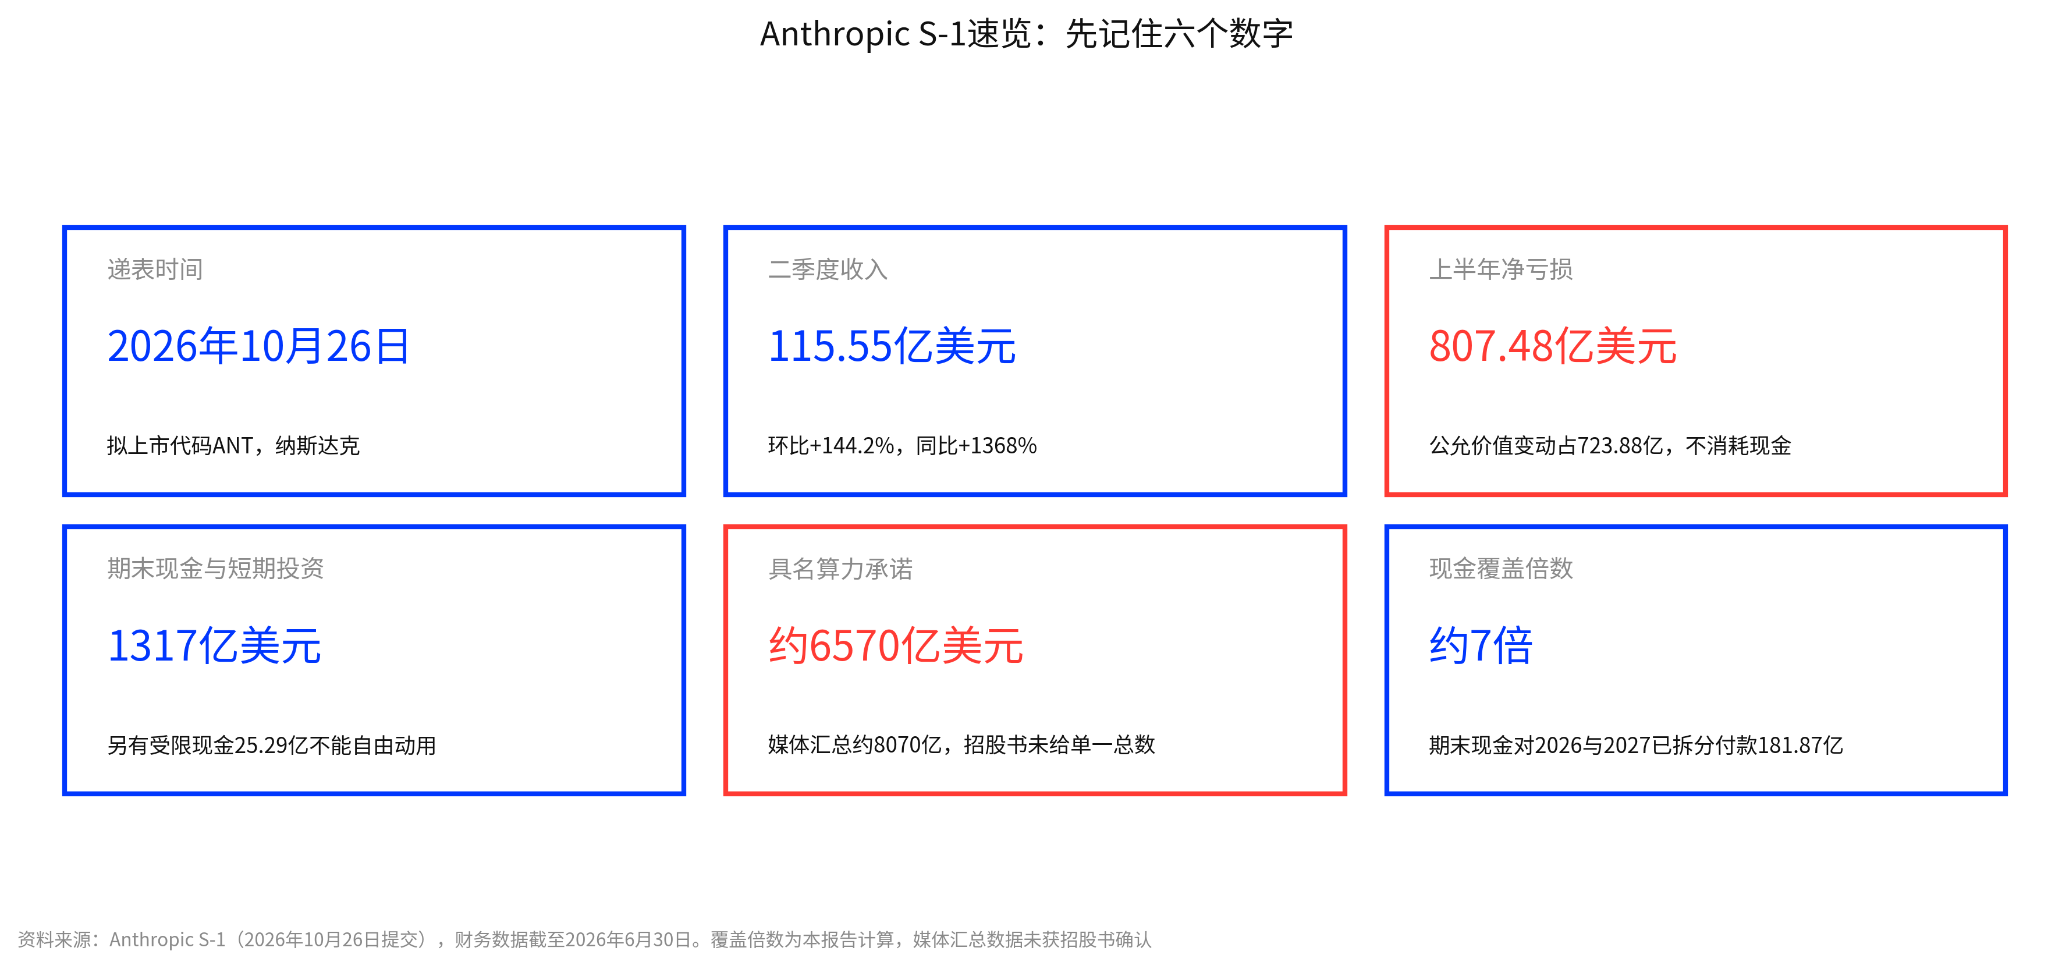
On October 26, Anthropic filed its S-1 registration statement with the U.S. SEC, planning to list on Nasdaq under the ticker ANT. Media outlets quickly summed up a staggering figure: $807 billion in compute commitments.
Three trading days later, the ranking of gains delivered a counterintuitive answer: Vertiv (power and cooling equipment) rose 25.0% cumulatively, CoreWeave (GPU cloud services) gained 17.9%, Oracle rose 14.4%, Broadcom gained 9.4%, and Nvidia rose just 2.1%.
This ranking upends conventional wisdom. Chips are the biggest piece, yet Nvidia rose only 2.1%. Instead, power equipment supplier Vertiv surged 25%. The market is voting with its feet: gains don't depend on the size of the commitment, but on whose orders get validated first and whose payments land first.
Key Takeaways
· One throughline: This S-1 pushes the basis for pricing the AI supply chain from narrative to contracts and cash flow. In the three trading days since filing, the market has already been repricing by order of validation: Vertiv up 25.0% cumulatively, Nvidia up just 2.1%. What rises isn't the largest commitment—it's whoever gets orders and payments validated first. Commitment size determines who's on the chain; orders and payments determine who gets priced.
· The money's been spent—who caught it: Anthropic's Q2 revenue was $11.555 billion, up 144% quarter-over-quarter. Cloud providers fronted $90.7 billion in a single quarter, and Google's free cash flow turned negative. The cloud layer caught the revenue but must buy chips and power downstream.
· Who gets paid first, who fronts the cash first: At the chip layer, Broadcom is both seller and financier ($161.2 billion in rent plus a $63 billion SPV). At the power layer, Vertiv's orders doubled but it has the most collection steps. Application software isn't collecting Anthropic's money—it's collecting end customers' workflow budgets.
· The other side of the bill: Of the $80.748 billion net loss in the first half, fair value changes accounted for 90%. Operating cash was positive at $3.929 billion. The $131.7 billion in cash covers about 7x the two-year payments but only about 20% of the $657 billion in contracts. The gap must be filled by operating cash and continued financing, with risk concentrated on whoever signed non-cancelable contracts.
Anthropic filed its S-1 with the U.S. SEC on October 26, planning to list on Nasdaq under the ticker ANT. The market's first impression was the roughly $807 billion in compute commitments aggregated by media, but the prospectus does not present this single total, and different outlets' sums don't agree. The market reacted before the offering: from the October 23 close before filing to the October 28 close, Vertiv rose 25.0% cumulatively, CoreWeave gained 17.9%, Oracle rose 14.4%, Micron gained 12.0%, Broadcom rose 9.4%, and Nvidia gained just 2.1%.
Filing is only the first step. The question that really matters to investors is: which layer will the money flow to, and what should we watch in advance? This article follows a single funding chain: first, who catches Anthropic's money after it's spent; then, among those who catch it, who receives cash first and who fronts it first; then back to Anthropic's own bills and contracts to see who's left holding the risk; finally, how much assumption is already priced in at current levels.
1. A Prospectus That Spends First, Earns Later
Anthropic's revenue and commitments are exploding simultaneously, but they are different in nature. Revenue just turned profitable in a single quarter; commitments are long-term minimum guarantees. The market has already voted by "strength of order and payment validation," not by commitment size:
Revenue is exploding, but a single-quarter profit doesn't mean a profitable half-year: The S-1 shows revenue grew from $376 million in Q1 2025 to $11.555 billion in Q2 2026, up 144.2% quarter-over-quarter and 1368% year-over-year. Compute and infrastructure costs grew 300% over the same period, with revenue growth more than four times cost growth. GAAP operating income was $974 million at an 8% margin, with the turnaround occurring in the most recent quarter. The first half as a whole still posted an operating loss of $693 million.
Commitments are larger, but look only at what can be confirmed: The eight named compute arrangements in the S-1 roughly total about $657 billion, plus an additional $125 billion to $150 billion in TPU compute at undetermined prices. Media aggregated about $807 billion, but the prospectus does not present this single total. What can be confirmed: fixed or minimum guaranteed commitments are about $265.6 billion, with terms up to 20 years, roughly 13.5x trailing twelve-month revenue of $19.708 billion, or roughly 33x based on the eight named arrangements. This prospectus is still about spending first and earning later. The market has already voted. In the three trading days since filing, the ranking of gains did not follow commitment size but the strength of order and payment validation. Vertiv's 16.48% single-day gain on earnings night contributed most of its rise, while Nvidia was weighed down by expectations that large customers would divert to in-house chips. Once official IPO pricing comes out, this ranking will have a clear reference point, and valuations are linked as well.
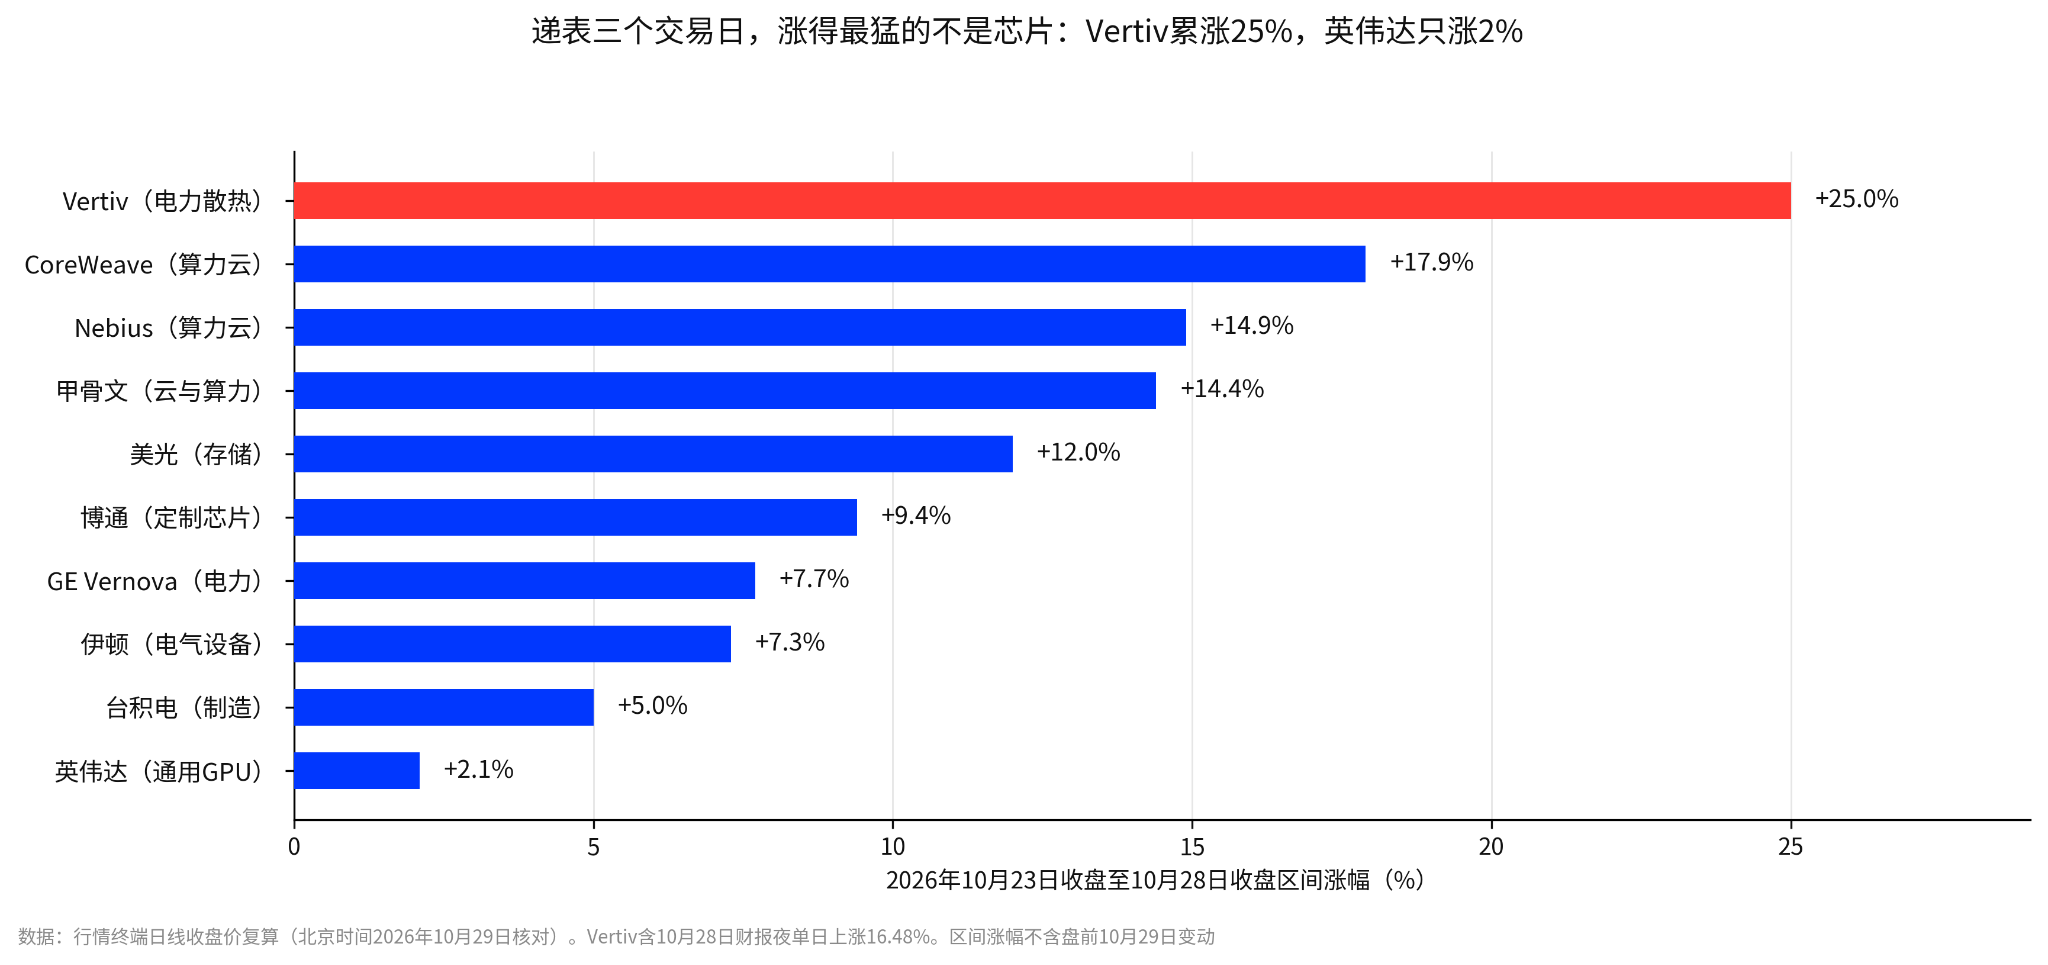
In the three trading days since filing, the biggest gainer wasn't chips: Vertiv up 25% cumulatively, Nvidia up just 2%
The market has already voted, and the biggest gainer isn't chips. In the three trading days after filing, the ranking of gains followed the strength of order and payment validation, not commitment size: Vertiv up 25.0% cumulatively, CoreWeave up 17.9%, Oracle up 14.4%, Micron up 12.0%, Broadcom up 9.4%, and Nvidia up just 2.1%. Vertiv rose 16.48% in a single day on earnings night, contributing most of its gain; Nvidia was weighed down by expectations that large customers would divert to in-house chips. Official IPO pricing will give this ranking an explicit anchor, and how that anchor translates into valuation is explored in Chapter 5.
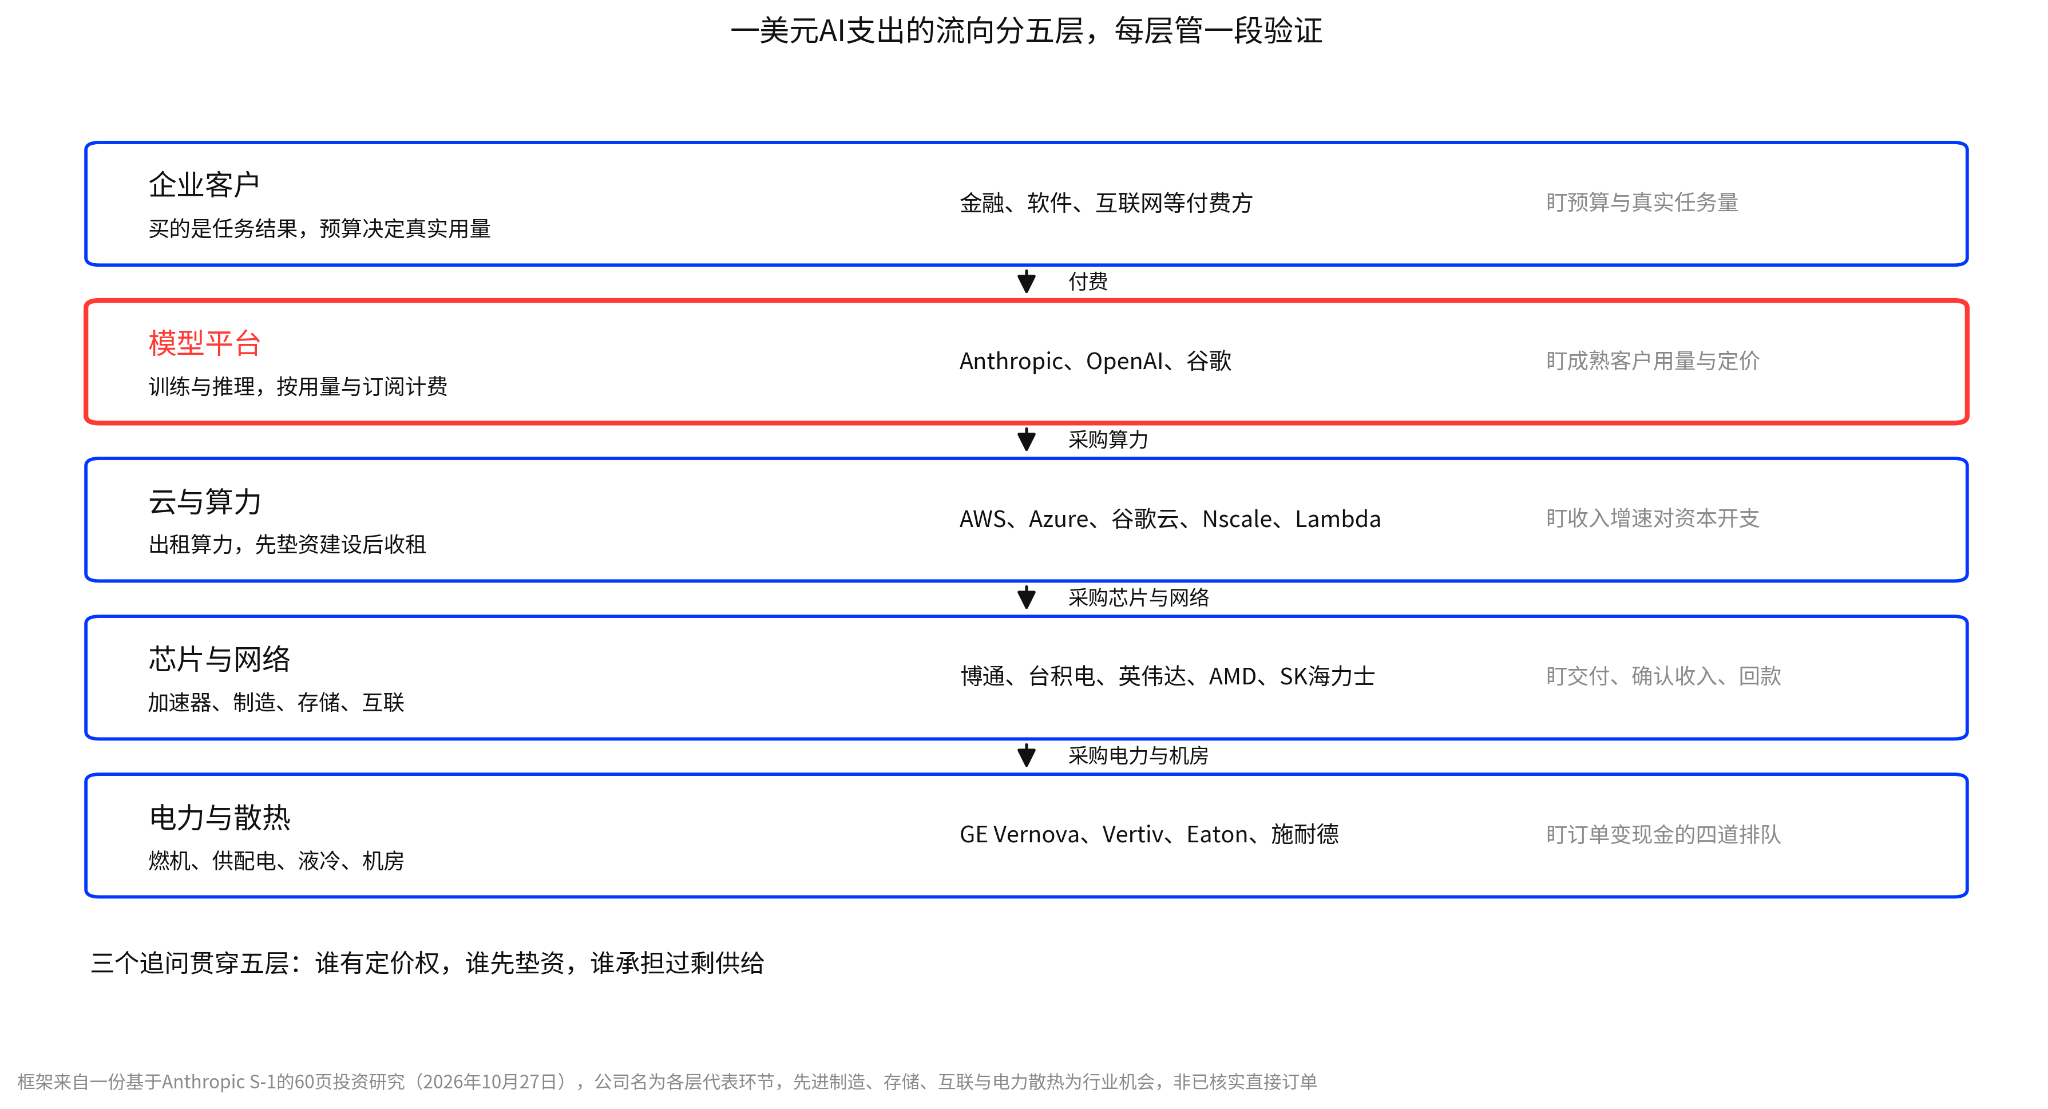
A dollar of AI spending flows through five layers, each governing a stage of validation
Enterprise customers pay the model platform, the model platform buys cloud and compute, cloud and compute buy chips, storage, and networking, below that is power and cooling, and the outermost ring is application software. Each layer asks three questions: who has pricing power, who fronts the cash, and who bears oversupply.
2. The Money's Been Spent—Who Caught It
How much did the model layer receive, and how much did the cloud layer front? The two layers are two ends of the same money. Anthropic's usage-based business model determines its revenue curve and also the cloud providers' fronting curve. The model layer mainly needs to answer two questions: Is Anthropic's revenue explosion driven by new customers flooding in, existing customers increasing usage, or price hikes? Is the margin driven by price hikes or efficiency gains?
2.1. Model Layer: Revenue Beats Compute Costs for the First Time—Quality Hinges on Customers and Retention
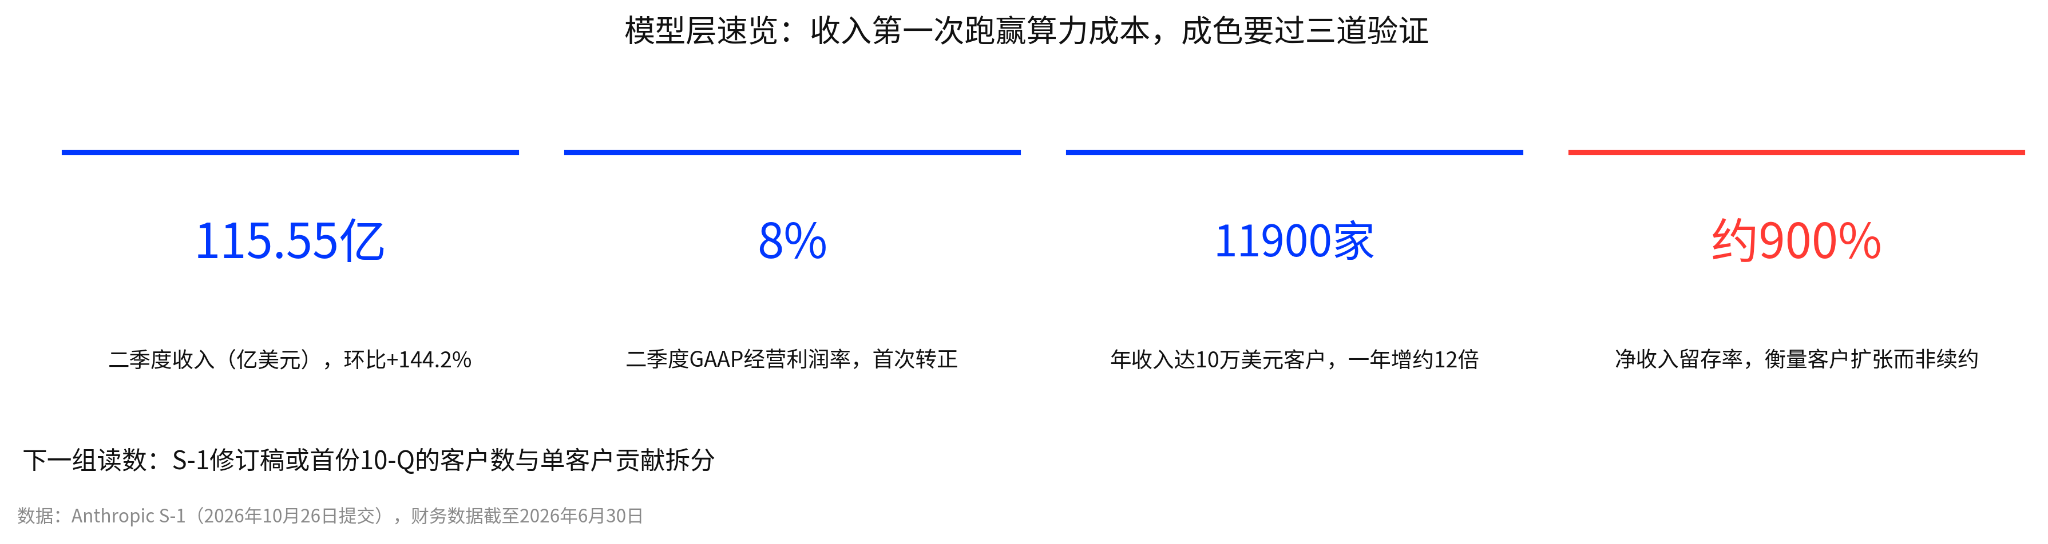
Model layer at a glance: Q2 revenue $11.555 billion, operating margin 8%, 11,900 customers, retention ~900%
On revenue structure, usage-based billing dominates, with fast version iteration. In the first half, consumption-type (billed by token usage) revenue was $13.1 billion, or 80%, and subscription-type was $3.2 billion, or 20%. Opus 5.5's per-task cost fell about 40% versus Opus 5 (per Guosen Securities), which is the product-side reason revenue can beat compute costs under usage-based billing. Regionally, the U.S. accounts for about 72% and overseas about 28%. More than 80% of revenue comes from model versions released in the prior six months, so the revenue position of current versions could be rewritten at any time.
Existing customers spending more is the main engine of the revenue explosion. Net revenue retention is about 900%, meaning the same cohort of customers spends about 9x its baseline a year later. The top five customers' share of revenue fell from 36% in Q1 to 25% in the first three quarters, and just 21% in Q3 alone, with no single customer over 10%. This shows the revenue explosion mainly comes from existing customers expanding usage; the new customer base is too small to support total revenue. If agent workload call volume growth slows, revenue growth will slow with it.
Margin turning positive relies on higher output per unit of compute: Revenue per $1 of compute rose from $0.40 in Q1 2025 to $2.08 in Q2 2026, a cumulative 5.2x increase (per Guosen Securities, based on the S-1). Q2 revenue grew 144% quarter-over-quarter while compute costs grew 300%—costs appear to grow faster, but unit economics are improving.
The improvement mainly comes from continued algorithm optimization and automatically selecting more cost-effective compute across different chips. So the margin turning positive is not from price hikes. The risk is: if multi-cloud scheduling headroom is exhausted and algorithm optimization returns diminish, whether 2.08 can still rise is the first variable for 2027 margins. Productivity gains are another aspect: by September 2026, over 90% of the codebase was written by Claude; over the past twelve months, revenue grew about 1200% while headcount grew only about 170%, with annualized revenue per employee rising from $1.4 million to over $6.6 million. The expense ratio declines because the model boosts productivity, not because of layoffs.

Revenue per $1 of compute invested: from $0.40 to $2.08 over six quarters

Anthropic's quarterly revenue grew about 14x in a year, with Q2 operating margin turning positive at 8%
Customer count grew 12x in a year, but single-customer dependence hasn't been resolved in tandem. Customers with over $100,000 in annual revenue grew from about 950 to over 11,900, those over $1 million to over 1,900, and those over $10 million to about 250. In 2025, customers A and B each accounted for 12% of revenue; in the first half of 2026, customer C accounted for 11%. More customers mainly improve diversification, but if customer C cuts usage in 2027, the revenue floor will still be more fragile than the customer count suggests. The top five customers account for 25%, with no reliable industry benchmark—only the company's own declining trend from 36% can be referenced.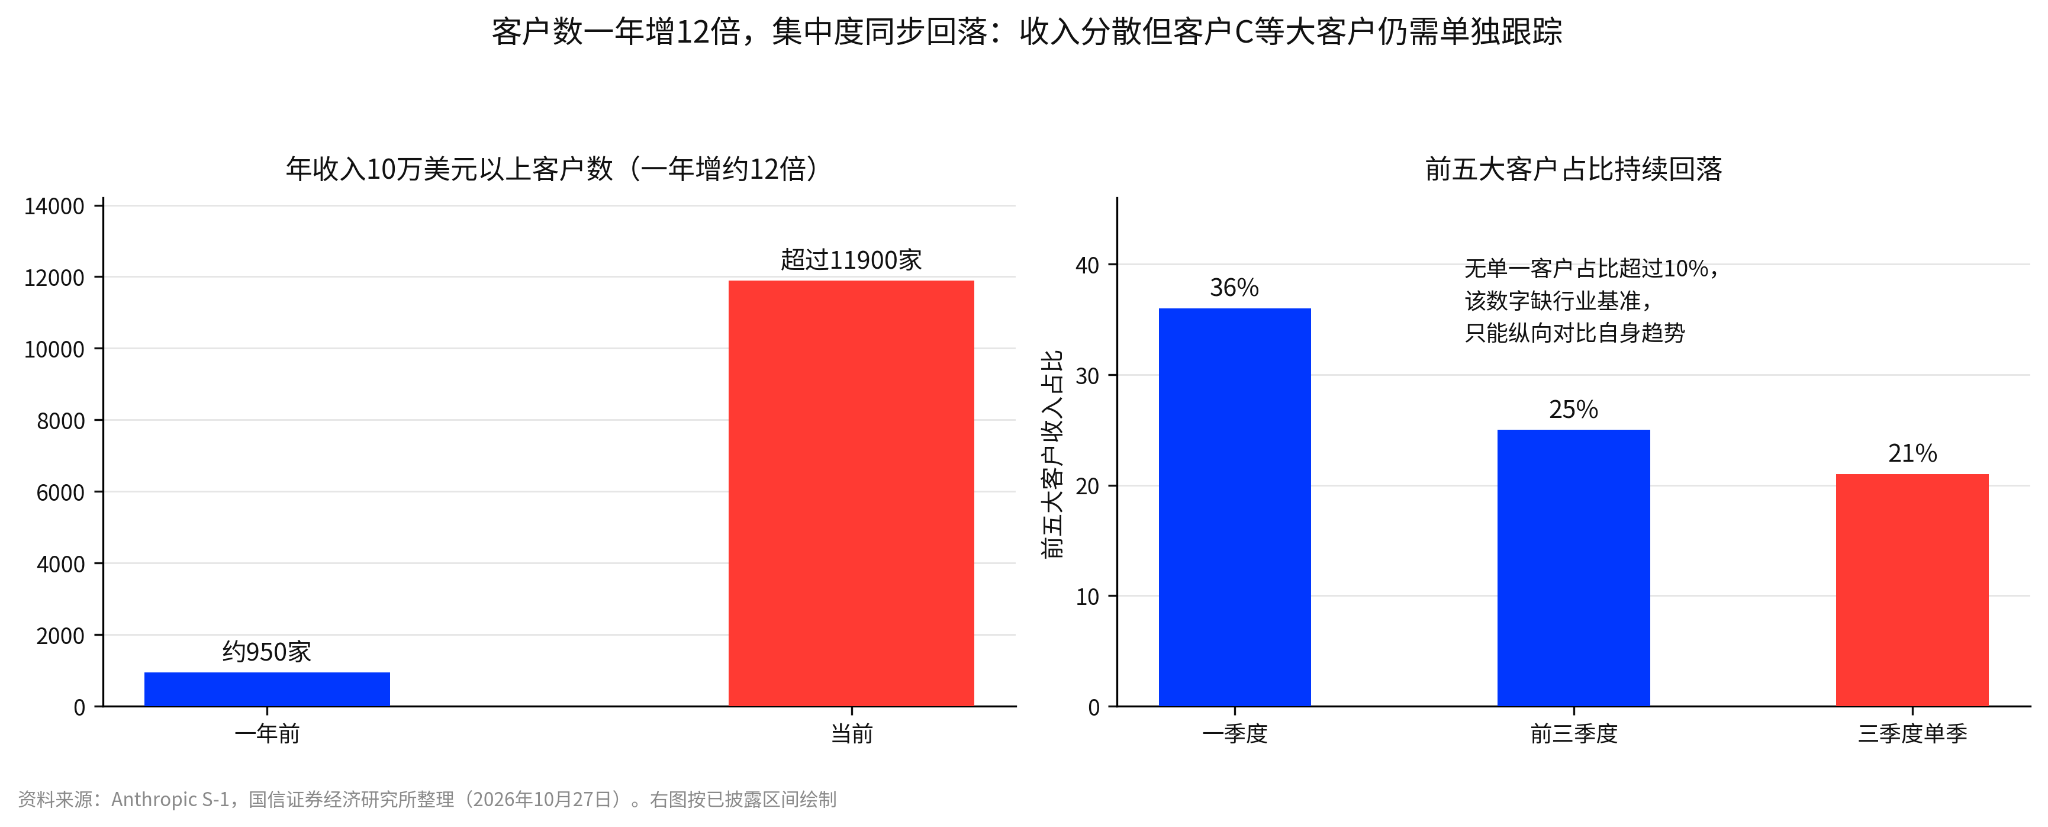
Customer count grew 12x in a year while top-five customer share fell in tandem: diversification is improving, but single-customer dependence still needs separate monitoring
Customer retention of 900% must first be viewed against its base: standard SaaS net revenue retention is typically 110% to 130%, so 900% is extremely high; but this metric only covers spending expansion of usage-based customers, excluding fixed-price Pro and Max subscribers, and a low base and early-adoption ramp also inflate the figure. So 900% first shows customer usage is still ramping—it cannot be taken as evidence of loyalty. What level it settles at after the ramp is the key to judging revenue sustainability.
Costs are also normalizing: total expenses by nature were $16.979 billion, equal to 104% of revenue; of which compute was $8.945 billion (53%), personnel $3.152 billion (19%), sales, marketing and channels $3.168 billion (19%), and other $1.714 billion (10%). Full-year 2025 expenses equaled 276% of revenue, now clearly falling, driven by higher compute efficiency per unit. Cost of revenue by function of $2.38 billion (85.4% gross margin) is only part of compute expenses, with the rest in R&D and sales line items, and cannot be added to the $16.979 billion. R&D spending was $9.741 billion, about 60% of revenue. Remaining performance obligations as of June 30 were $10.8 billion, about 75% to be recognized in the following 12 months; RPO only covers non-cancelable arrangements, so one cannot conclude a funding gap merely because RPO is below total procurement.
Overall, the model layer's revenue engine is usage ramp among existing customers, and the safety cushion is compute efficiency per unit. If either premise falters, the contracts signed downstream will become less reliable.
2.2. Cloud Layer: $90.7 Billion Fronted in a Single Quarter—Revenue Growth Must Be Viewed Alongside Capex
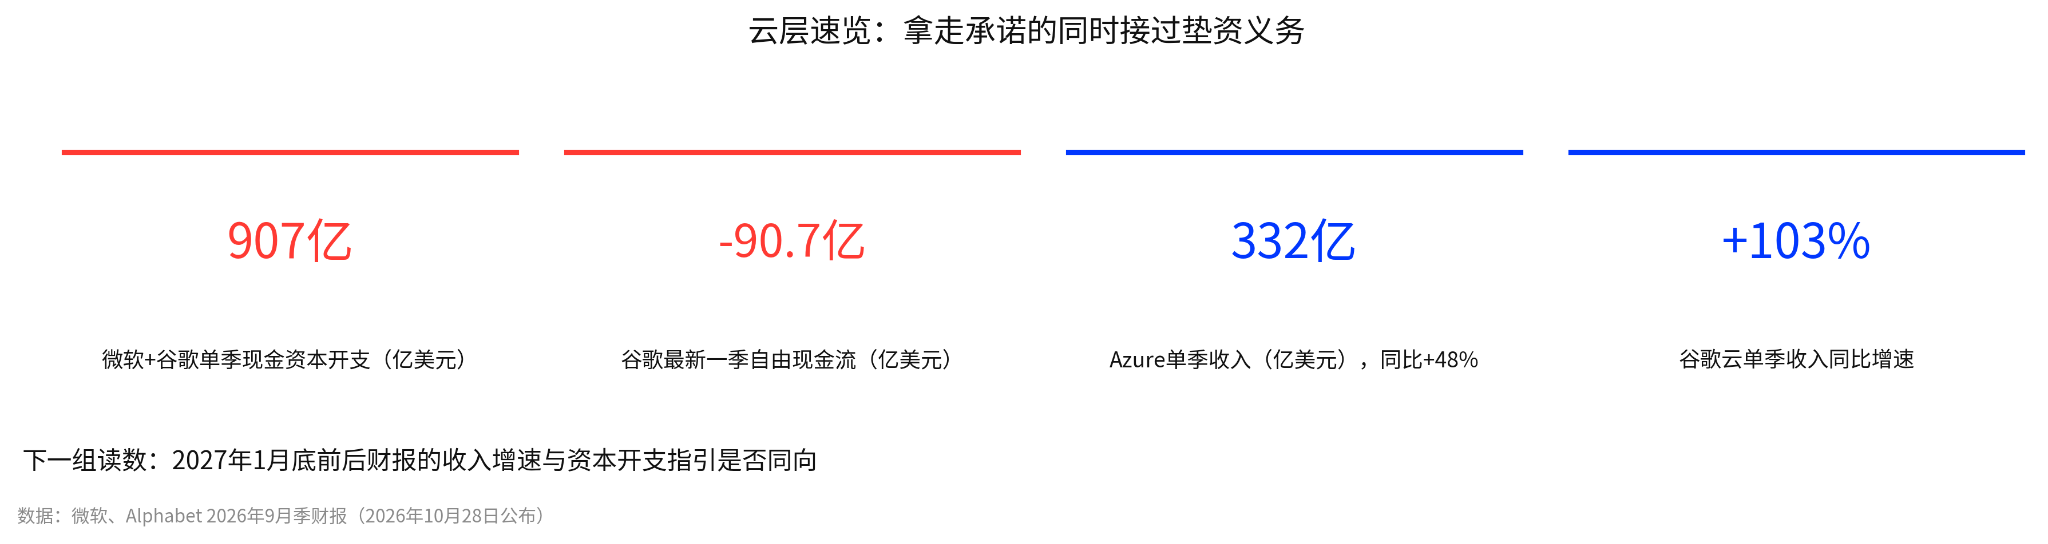
Cloud layer at a glance: two providers' combined quarterly capex $90.7 billion, Google free cash flow -$9.07 billion
Why are cloud providers willing to front the cash? Because the contracts have minimum consumption clauses: top-up if short, non-cancelable except for major breach. Cloud providers aren't betting Anthropic will grow; they're building capacity in advance under the premise that Anthropic has committed minimum payments. So the risk in this $90.7 billion isn't on the demand side but the delivery side: if capacity is built but usage falls short, Anthropic tops up; if capacity construction is delayed, Anthropic's usage growth gets constrained by supply instead.
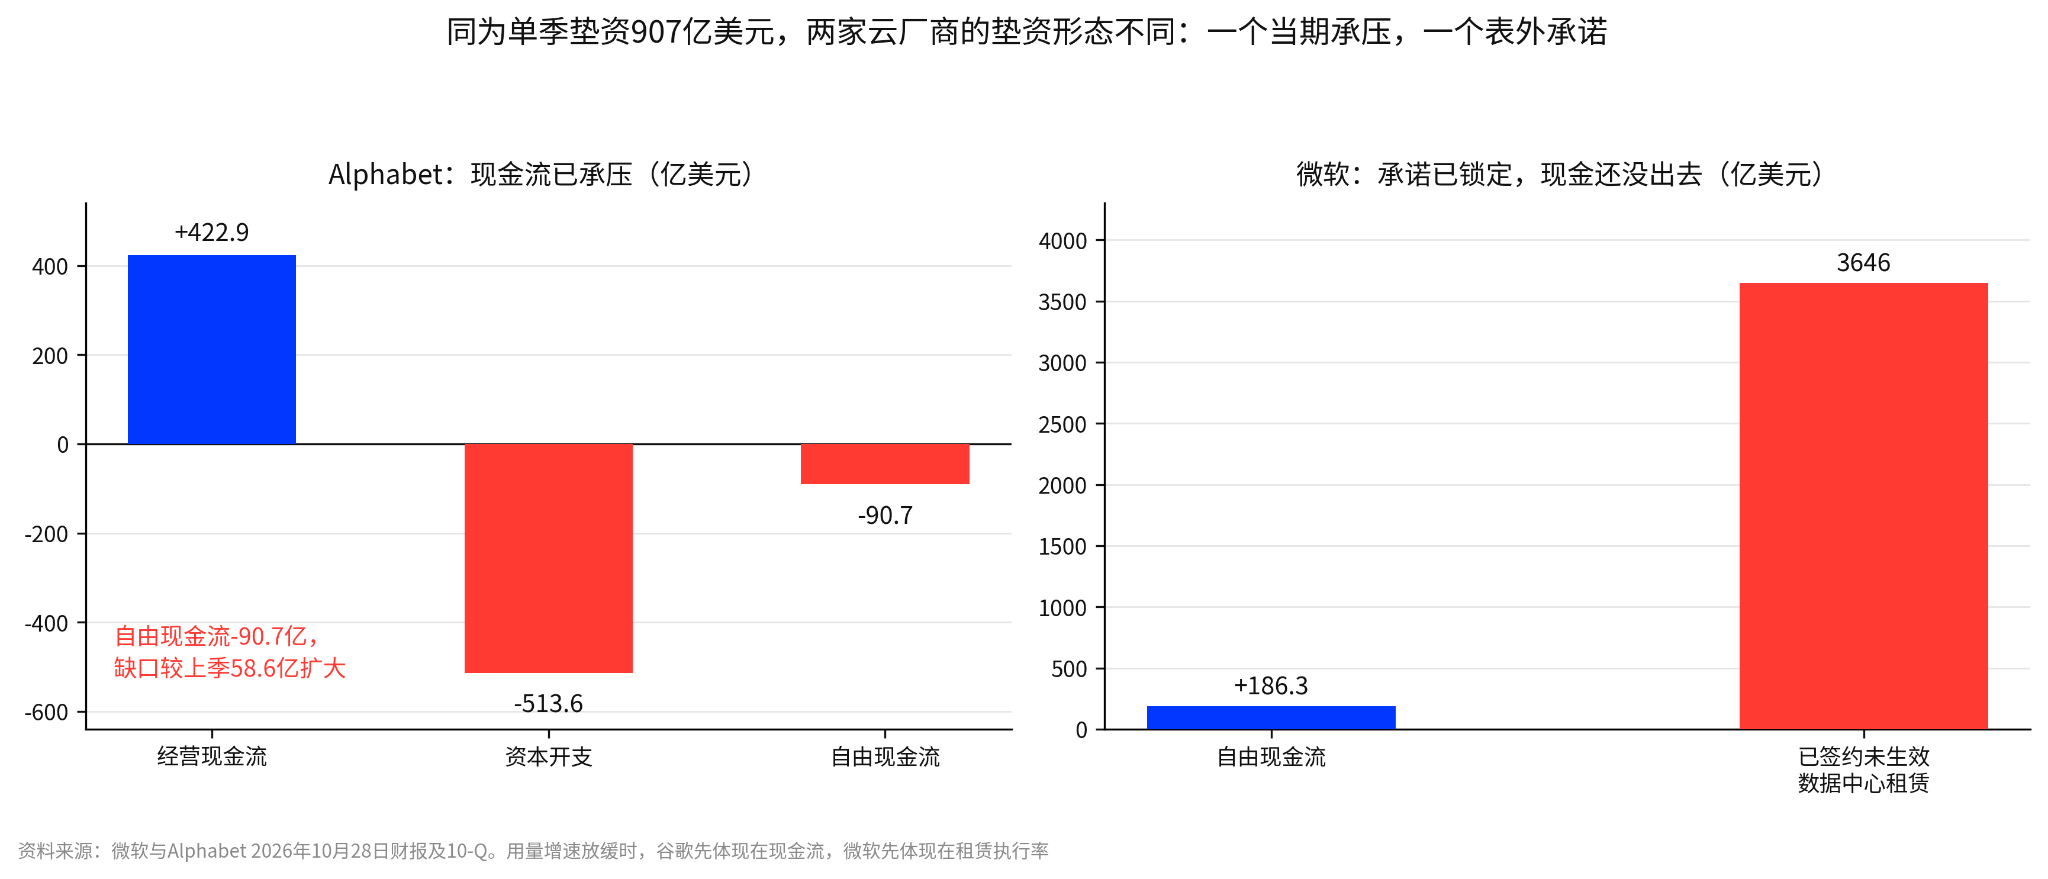
Both fronting $90.7 billion in a single quarter, but in different forms: Google bears it on-balance-sheet, Microsoft off-balance-sheet
Same single-quarter capex, but two different forms: Google bears it currently, Microsoft as off-balance-sheet commitments. The October 28 Q3 reports show Microsoft and Alphabet's combined quarterly cash capex at $90.7 billion; Azure revenue was $33.2 billion, up 48% year-over-year, and Google Cloud revenue was $30.7 billion, up 103% year-over-year. But the two face pressure in different places:
- Alphabet bears it currently: quarterly operating cash flow of $42.29 billion and capex of $51.36 billion produced free cash flow of negative $9.07 billion, with the gap widening from $5.86 billion the prior quarter—fronting has consumed all the operating cash flow headroom.
- Microsoft's pressure is off-balance-sheet: free cash flow remains positive at $18.63 billion, but signed yet not-yet-effective data center lease contracts total $364.6 billion, with fronting showing up more as commitments than current cash.
If Anthropic's usage growth slows in 2027, Google's pressure will show first in cash flow, and Microsoft's first in lease contract execution rates.
$90.7 billion is current spending; $807 billion is long-term commitments, the latter spread across multiple suppliers. This $807 billion corresponds to long-term compute commitments one customer, Anthropic, made to multiple suppliers—not any single cloud provider's expansion plan. Based on the two providers' combined quarterly cash capex of $90.7 billion, this commitment equals about nine quarters of their spending, and it's only one customer's commitment, spread across Google Cloud, AWS, Microsoft, Broadcom, SpaceXAI and others, so it cannot all be attributed to any one cloud provider. Of Microsoft and Alphabet's $90.7