Fed Decision Window: BTC and HYPE Chan Theory Structure and Trading Strategy Analysis | Guest Analysis


- Core View: This week's Fed interest rate decision has become the market's core variable. BTC is in a box-range tug-of-war near the 364-day moving average, while HYPE has shown topping characteristics after hitting an all-time high and has shifted into a downward correction. For both, it is recommended to wait for the decision to land before making trading decisions.
- Key Elements:
- BTC began rebounding from its July low of $57,820, forming a second daily-level upward pivot zone in the $75,500–$82,850 range. The upside is under dual pressure from the 364-day moving average (around $82,200) and $82,850, while the downside is supported by the 30-day moving average and the lower edge of the box range.
- BTC has been trading below the 364-day moving average for approximately 307 trading days, and the medium-to-long-term bearish structure has not reversed; on August 19, it reclaimed the 182-day moving average, and on September 3, it challenged the 364-day moving average for the first time, which is a positive signal.
- Two paths for the Fed decision scenario: a pre-announcement rebound or a spike higher that "lures bulls" before a pullback; if there is consolidation before the announcement, a rapid sell-off may occur followed by a rebound supported by the 182-day moving average, so shorting should not be chased.
- For BTC, maintain an empty position and stay on the sidelines for the medium term, use 30% position for short-term spread trading, with core resistance at $81,700–$82,850 and core support at $73,500–$75,000.
- HYPE launched a 14-segment upward move from its August 2 low of $51.11, and after hitting an all-time high of $89.76, momentum divergence appeared. The probability that this daily-level rally has ended is extremely high.
- HYPE has broken below the key $80 support, with a correction stronger than the previous segment. This week, focus on the rebound strength after stabilizing near $77. For trading, it is recommended to stay in cash and wait on the sidelines.
This week's Federal Reserve interest rate decision is the core variable for the market, and expectations for short-term volatility have risen significantly. On the technical front, the rebound structure in BTC that began from its July low has entered a critical phase of range-bound consolidation and pivot verification, with bulls and bears locked in a tug-of-war around the 364-day moving average; HYPE, meanwhile, has shifted into a pullback after completing a multi-stage uptrend on the 4-hour timeframe, with topping characteristics gradually emerging near its previous high. This article will combine Chan Theory structure, moving average systems, and position monitoring models to assess the weekly outlook for both, and provide corresponding trading strategies for reference.
Summary of core trading views for this week:
• BTC daily chart structure analysis (see Part One for details)
• BTC weekly outlook and medium- and short-term trading strategies (see Part Two for details)
• HYPE hourly chart structure analysis (see Part Three for details)
• HYPE weekly outlook and short-term trading strategies (see Part Four for details)
1. Analysis of Bitcoin's Daily Chart Structure
In last week's review, this column introduced the Chan Theory analysis framework and made a clear judgment on the rebound structure in BTC that began from its July 1 low of $57,820: the price would likely maintain range-bound consolidation within the $75,500–$82,850 zone in the short term, while simultaneously forming a second upward pivot on the daily timeframe. Actual price action last week showed that the price center consistently converged within the upper and lower boundaries of this range, with the pivot evolution rhythm highly consistent with prior expectations. This week, we shift our perspective to the moving average dimension and, combined with multi-timeframe moving average theory, further deconstruct and deduce the internal structure, trend evolution, and potential turning-point windows of this rebound.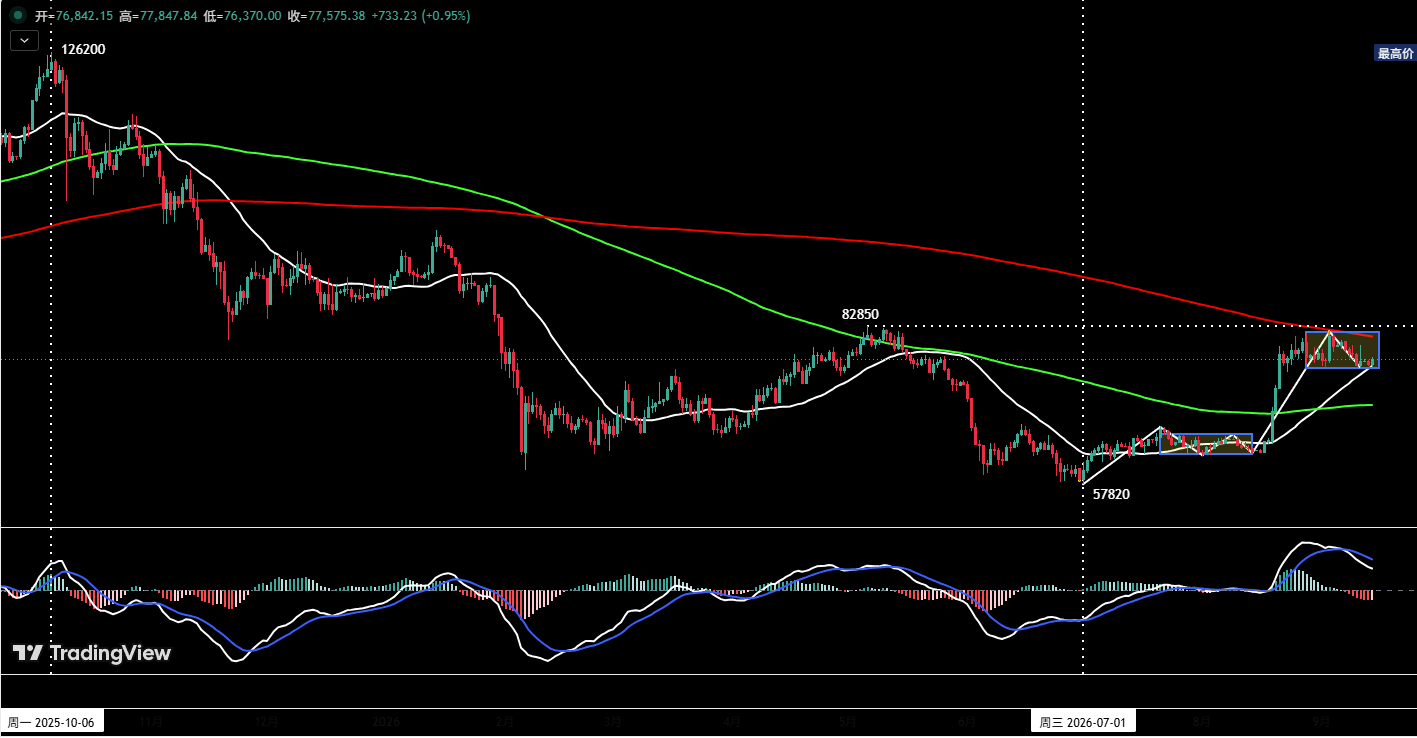
Figure 1: Bitcoin Daily Candlestick Chart
1. Overall Summary
①. As shown in (Figure 1), BTC has been in continuous correction since topping out at $126,200 in October 2025, lasting nearly 345 trading days so far. On October 29, 2025, the price first effectively broke below the 182-day moving average (green line), and two weeks later further lost the 364-day moving average (red line); we regard the 364-day moving average (i.e., the 52-week moving average) as the market's "bull-bear" dividing line, and its effective breakdown marked the market's formal entry into a deep bear market correction phase. As of now, the price has been trading below the 364-day moving average for approximately 307 trading days, and the medium- to long-term bearish structure has yet to show any reversal signal.
②. Regarding the current market environment, the biggest positive factor is that after nearly 300 trading days away, the price reclaimed the 182-day moving average (green line) on August 19 and challenged the 364-day moving average (red line) to the upside for the first time on September 3 — a move that opens up upside possibilities for the market's subsequent trajectory.
2. Short-Term Outlook and Scenario Analysis
①. The daily-level rebound in BTC that began from its July 1 low first broke above the 182-day moving average (approximately $68,940) on August 19 with increased volume, then continued rising to encounter resistance near the 364-day moving average (approximately $82,200), after which the market shifted into a high-level range-bound consolidation pattern. Currently, the price is in a "resistance above, support below" range state; to the upside, it faces dual pressure from the 364-day moving average and the key resistance level of $82,850, while to the downside it has dual support from the 30-day moving average (white line) and the lower boundary of the range at $75,500.
②. In the latter half of this week, the Federal Reserve will announce its interest rate decision. Therefore, the market has entered a critical window period. Based on the current situation, we outline two possible paths ahead.
Path One (rally before the announcement): The market continues its rebound in the first half of the week, and after the interest rate decision lands, a rapid surge influenced by the news cannot be ruled out, possibly even briefly breaking above the dual resistance overhead. However, investors are reminded not to blindly chase the rally, as upside potential would be relatively limited at that point, and caution should be exercised regarding pullback risk following a "bull trap" spike.
Path Two (consolidation or mild correction before the announcement): Supported by the lower boundary of the range and the 30-day moving average, the price consolidates in a narrow range or undergoes a mild correction around this level in the first half of the week. After the announcement, a sharp sell-off cannot be ruled out, possibly even briefly breaking below support. However, we believe it would be inadvisable to chase shorts at that point; instead, caution should be exercised regarding a rebound after the "shoe drops," with the market potentially leveraging the key support of the 182-day moving average below to stage a recovery and once again challenge the recent high of $82,500.
2. Bitcoin Weekly Outlook and Trading Strategies
1. BTC Weekly Outlook: Core view for this week — focus on observation in the first half of the week, and make trading decisions based on price positioning after the rate decision "lands" in the second half.
2. Key Resistance Levels
• First resistance zone: $81,700–$82,850 area (prior important level)
• Second resistance zone: $84,500–$86,500 area (prior important resistance zone)
• Third resistance zone: $90,000 area (key psychological level)
3. Key Support Levels
• First support level: $73,500–$75,000 area (prior important support level)
• Second support level: $67,300–$69,100 area (prior important support level)
4. Trading Strategies for This Week (excluding impact of unexpected news)
①. Medium-term strategy: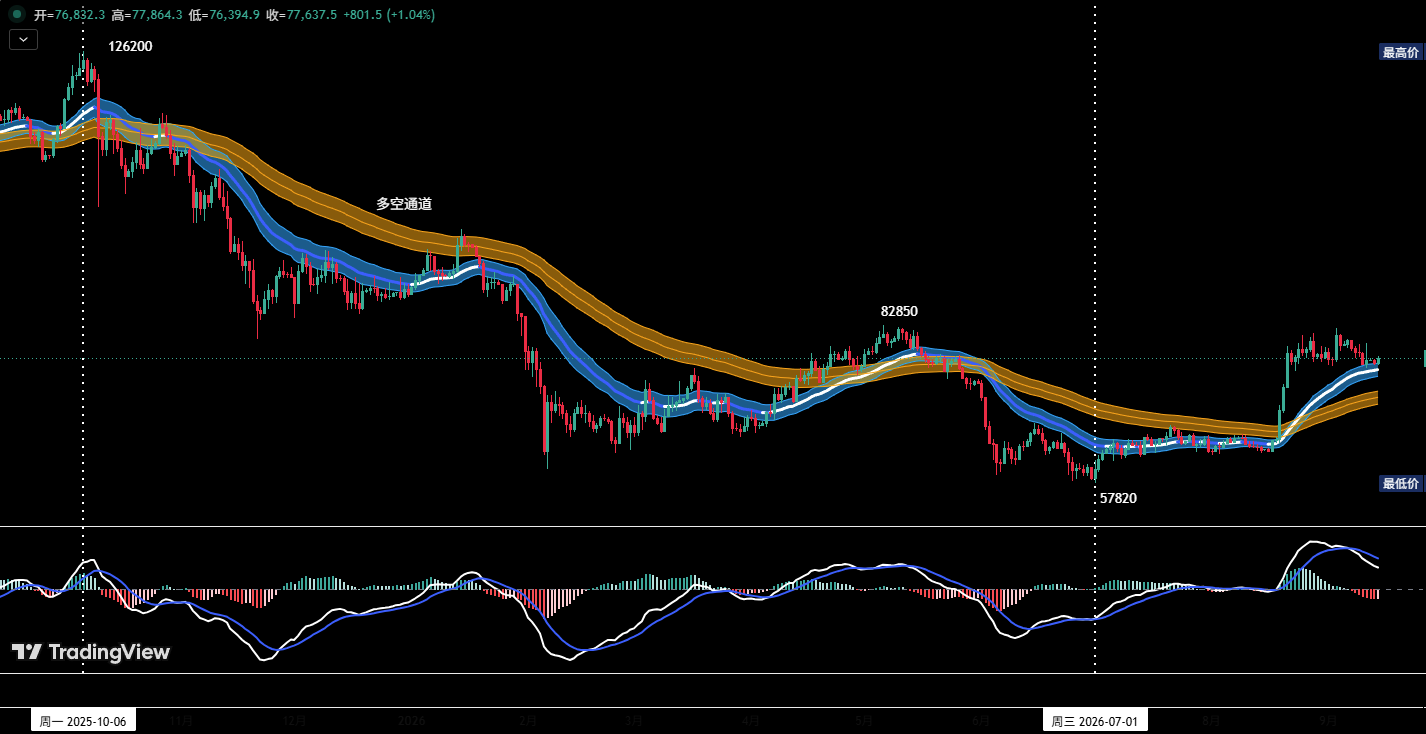
Figure 2: Bitcoin _ Daily Candlestick Chart: (Position Monitoring Model)
Position Monitoring Model: As shown in (Figure 2), the price has broken out of the "long-short channel," and the short-term market structure has consequently changed, but a pullback confirmation phase has not yet occurred after the breakout. In light of this, the current medium-term position remains at zero, with a focus on staying in cash and observing.
②. Short-term strategy: Use 30% of position, set stop-loss points, and look for "spread" opportunities based on support and resistance levels. (Use 30-minute/60-minute as the operating timeframe.)
③. In short-term trading, to dynamically adapt to complex market evolution, we have prepared two sets of contingency plans, A and B, in advance.
Plan A: Light long position in strong support zone.
• Entry: After the rate decision is announced in the second half of the week, if the price pulls back above the second important support level and shows a clear stabilization pattern with the quantitative model simultaneously issuing a bottom signal, a long position of approximately 30% may be established.
• Risk control: Set an initial stop-loss.
• Exit: When the price rebounds to near an important resistance level, combined with model signals, gradually close the position to take profits.
Plan B: Light short position in strong resistance zone.
• Entry: After the rate decision is announced in the second half of the week, if the price rises to the $82,850–$84,500 area and shows a clear pattern of resistance and pullback with the quantitative model simultaneously issuing a top signal, a short position of approximately 30% may be established.
• Risk control: Set an initial stop-loss.
• Exit: When the price adjusts to near an important support level, combined with model signals, gradually close the position to take profits.
3. HYPE Hourly Chart Structure Analysis
In this week's review, we will continue to employ the Chan Theory analysis framework to systematically deconstruct and analyze the rebound structure in HYPE that began from its August 2 low of $51.11.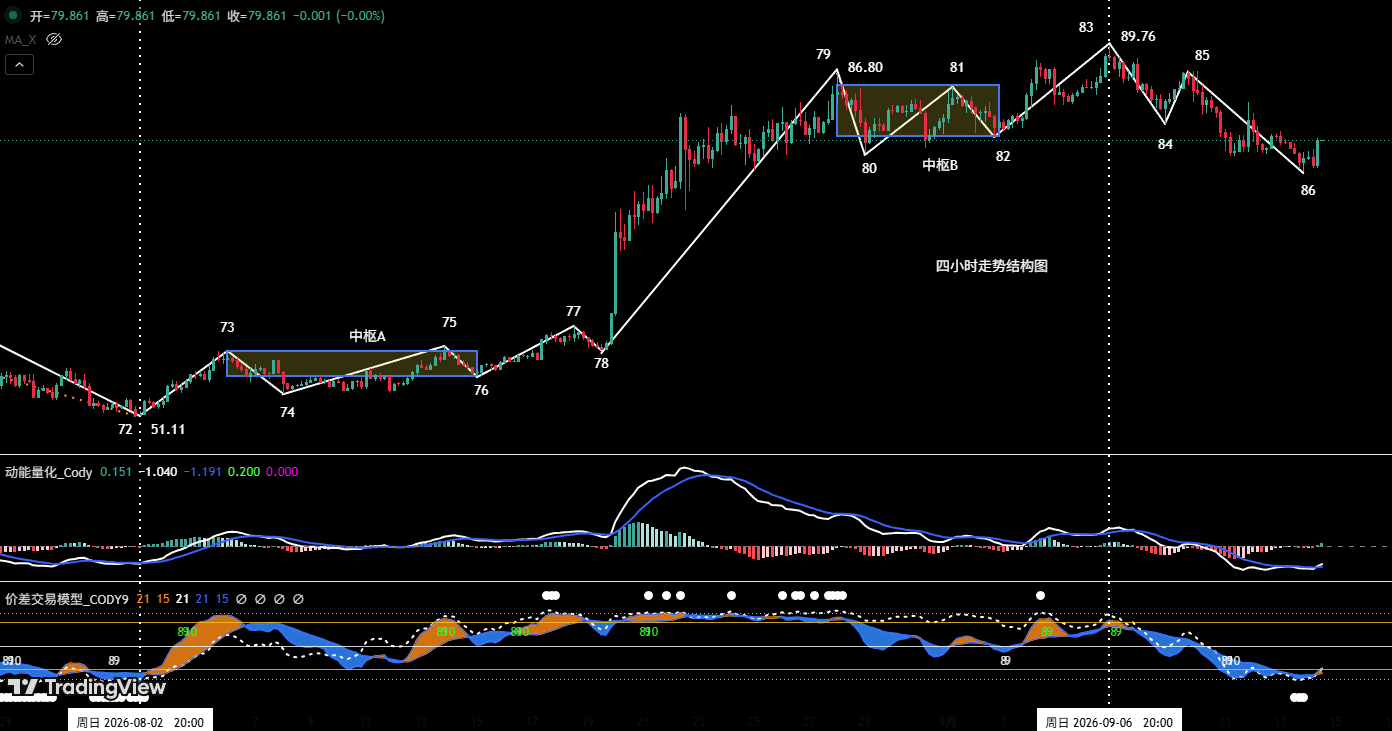
Figure 3: HYPE_4-Hour Candlestick Chart
1. Structure Overview
As shown in (Figure 3): The uptrend in HYPE that began from its August 2 low of $51.11 can be clearly deconstructed on the 4-hour timeframe into a 14-segment upward structure from (72-73) to (85-86).
2. Upward Pivot Construction
①. Pivot A construction: Based on the overlap of the three price ranges (73-74), (74-75), and (75-76), the first upward pivot (Pivot A) is formed. Here, (72-73) is the entry segment, and (78-79) is the exit segment. (See last week's review for details.)
②. Pivot B construction: Based on the overlap of the three price ranges (79-80), (80-81), and (81-82), the second upward pivot (Pivot B) is formed. (78-79) is the entry segment, and (82-83) is the exit segment.
3. Analysis Based on Pivot B Structure
The exit segment (82-83) of Pivot B experienced a significant pullback after hitting an all-time high of $89.76. Through comparison of upward momentum, this segment shows a clear momentum divergence relationship with the entry segment (78-79). Based on this analysis, the current daily-level uptrend structure that began from the August 2 low of $51.11 has a very high probability of terminating at the $89.76 level.
4. Analysis After Uptrend Termination: From "Endpoint 83," the market unfolded a three-segment corrective structure of (83-84), (84-85), and (85-86). As shown in (Figure 3), the termination point of (85-86) has already broken below the key support at $80, and the corrective momentum of this segment is clearly stronger than that of the (83-84) segment. These structural characteristics further confirm that the previous rebound has terminated at $89.76 and shifted into a downward correction phase.
4. HYPE Weekly Outlook and Short-Term Trading Strategies
1. HYPE Weekly Outlook
①. Key resistance levels:
• First resistance level: around $90
②. Key support levels:
• First support level: $76–$77 area;
• Second support level: $71.5–$73 area;
③. Core view for this week: Focus on the rebound strength after the price stabilizes near $77 — its magnitude is the key variable for assessing the duration of the subsequent correction cycle.
2. HYPE Short-Term Trading Strategies for This Week
The long positions previously established in the $50–$52 range according to plan were all closed for profit near $80 last week. With this week approaching the key interest rate decision window, it is recommended to stay in cash and observe for now.
5. Special Notes
- When opening a position: Immediately set an initial stop-loss.
- When profit reaches 1%: Move the stop-loss to the entry cost price (break-even point) to ensure capital safety.
- When profit reaches 2%: Move the stop-loss to the 1% profit level.
- Continuous tracking: Thereafter, for every additional 1% gain in the price, move the stop-loss up by 1% accordingly, dynamically protecting and locking in profits.
Financial markets are ever-changing, and all market analyses and trading strategies require dynamic adjustment. All views, analytical models, and trading strategies contained in this article are derived from personal technical analysis and are intended solely as a personal trading journal; they do not constitute any investment advice or basis for action. Markets carry risk, and investment requires caution. Please do not make decisions based on this article.