8 capitulation indicators triggered, is BTC's bear market just one last drop away?


- Core Viewpoint: Multiple crypto institutions and traders generally believe Bitcoin is in the mid-to-late stages of a bear market, with the correction nearing its end. However, short-term downside risks remain, and the后市 outlook hinges on macro liquidity and breakthroughs at key price levels.
- Key Factors:
- VanEck's model shows 8 of 12 capitulation indicators have been triggered. Based on historical cycle patterns (average 12.7-month corrections), a bottom is expected to form between September and November, followed by an accumulation phase.
- VanEck notes that average returns 90 and 180 days after extreme signals are triggered remain below long-term benchmarks, and this cycle's low may be shallower due to ETF and institutional participation.
- Glassnode points out market activity has fallen to its lowest since 2019. If the $58,500 support level is lost, the next support sits at $52,800.
- Bitwise believes Bitcoin's insensitivity to negative news (such as Michael Saylor's selling and declining odds of bill passage) signals a bear market bottom, with the next wave of buyers potentially coming from major wealth management platforms.
- Bitfinex analysis shows BTC's price is sandwiched between the long-term holder realized price of $52,699 and the short-term holder realized price of $67,176. Breaking below the $63,200 support could test $57,803.
- Arthur Hayes predicts that if the Fed expands its balance sheet through the FIMA repo facility (boosting the yen), it would bring positive dollar liquidity—historically highly correlated with Bitcoin rallies.
- Trader Killa notes that Bitcoin regaining the 200-day moving average at approximately $69,500 would be the official signal of a bullish reversal.
Original author: Ma He, Foresight News
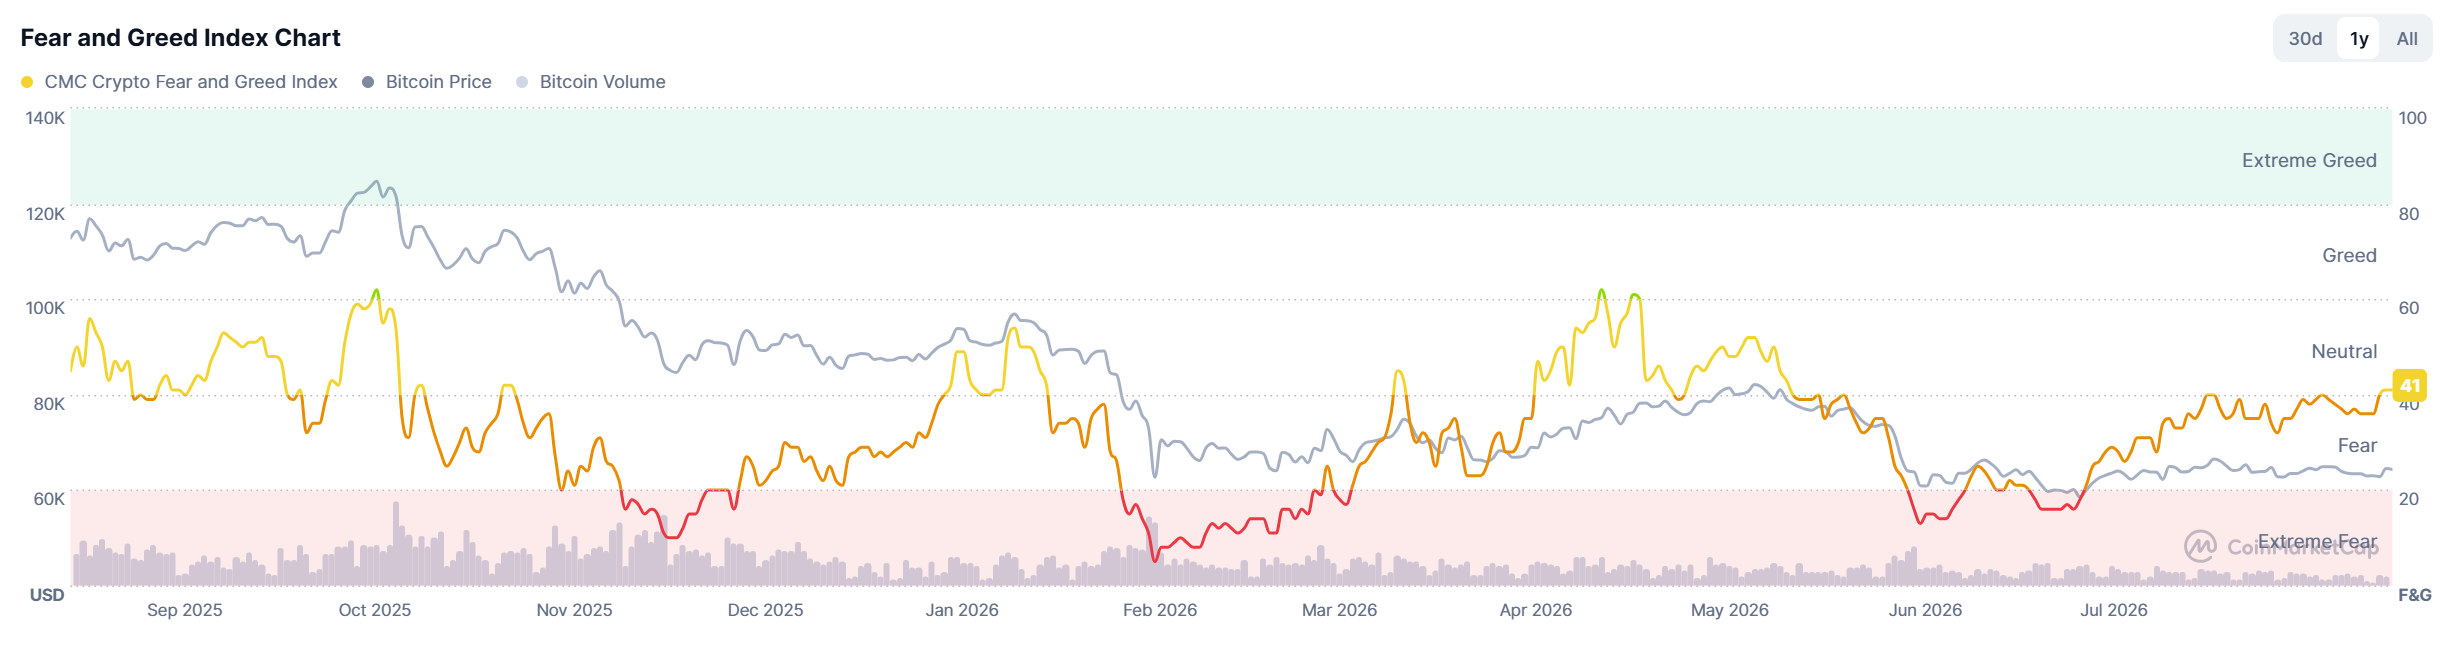
Since June this year, Bitcoin's price has remained near the $60,000 mark, showing a range-bound trend. According to Bitget market data, the latest Bitcoin quote is $64,333, up 0.42% in the last 24 hours. The latest CoinMarketCap data shows that the Crypto Fear & Greed Index has recovered to 41, indicating a neutral level.
According to Coinglass data, total liquidations across the network in the past 24 hours reached $203 million, with long liquidations accounting for $106 million.
Currently, how do crypto institutions, traders, and others view the future market direction regarding its bottom range and subsequent trend?
VanEck: Bitcoin May Be Near the End of Its Correction, 8 of 12 Capitulation Indicators Already Triggered
VanEck stated that Bitcoin's correction, lasting nearly 11 months, may be nearing its end, and the market could be entering a new accumulation phase. VanEck's research team, including Digital Assets Research Head Matthew Sigel and Senior Investment Analyst Patrick Bush, found through its 'Bitcoin Market Capitulation Check' model that 8 of the current 12 market indicators have shown extreme bearish signals, and all 12 indicators have entered panic-selling territory within the past three months.
The researchers indicated that these data points suggest the Bitcoin market appears to have already experienced a price 'capitulation' phase and is approaching or has already entered an accumulation period. Meanwhile, signs of capital inflow into the market are improving. US spot Bitcoin ETFs recorded nearly $300 million in net inflows on Monday, marking the highest single-day inflow since May 5.
In the past three Bitcoin bear market cycles, the average duration from market peak to maximum drawdown was approximately 12.7 months. The current correction has now entered its 11th month. Based on historical cycle patterns, the market may gradually complete its bottoming process between September and November and enter an accumulation phase.
However, VanEck cautioned that market capitulation signals cannot serve as a definitive indicator for short-term buying. Historical data shows that when 8 to 12 indicators simultaneously flash extreme signals, Bitcoin's average returns over the next 90 and 180 days tend to be lower than long-term benchmark levels. It is anticipated that the cyclical low point this time around may be more moderate than in previous bear markets, primarily due to the development of spot Bitcoin ETFs, broader institutional investor participation, and the absence of a cascade of shocks similar to the collapses of FTX, Celsius, and Terra Luna in the current market.
Glassnode: Bitcoin Could Dip to $52,800 If It Breaks Below $58,500
On-chain data analytics firm Glassnode stated that the Bitcoin market is in a state of high contraction, with sell-side pressure weakening, but buyers have yet to enter the market significantly. Currently, BTC is primarily oscillating within the $63,000 to $68,700 range, with market trading activity dropping to its lowest level since 2019. Glassnode data shows that the 30-day 'seller exhaustion indicator' has fallen to its lowest level since 2013, but a historic market bottoming signal has not yet been confirmed. Should BTC lose the $58,500 support level, the next support could potentially dip to $52,800.
Bitwise CIO: Bitcoin No Longer Reacts to Bad News, Bear Market May Have Bottomed Out
Matt Hougan, Chief Investment Officer at Bitwise, said in an interview with Bloomberg that Bitcoin is releasing an important 'bottoming signal': the market is starting to lose its reaction to bad news. Over the past few months, whether it was Michael Saylor selling Bitcoin or the significantly diminished probability of the CLARITY Act passing, Bitcoin has not seen significant declines and has even risen against the trend. Hougan believes this typically suggests the bear market may be nearing its bottom. He predicts the crypto market could experience a stronger rally by the end of this year, with the next wave of significant buyers coming from large wealth management platforms. Compared to past bull runs driven by retail investors, this cycle may be slower, less volatile, and more institutional in nature.
BIT: Bitcoin Currently Has 20% Downside Risk and 60% Upside Potential
BIT tweeted that historically, Bitcoin has traded approximately 40% below its long-term market average during bear market phases. If this pattern repeats, the price could potentially dip to around $45,500. However, this is not the base case scenario; BIT remains relatively optimistic about the outlook, although macroeconomic risks could still push Bitcoin to test lower levels again.
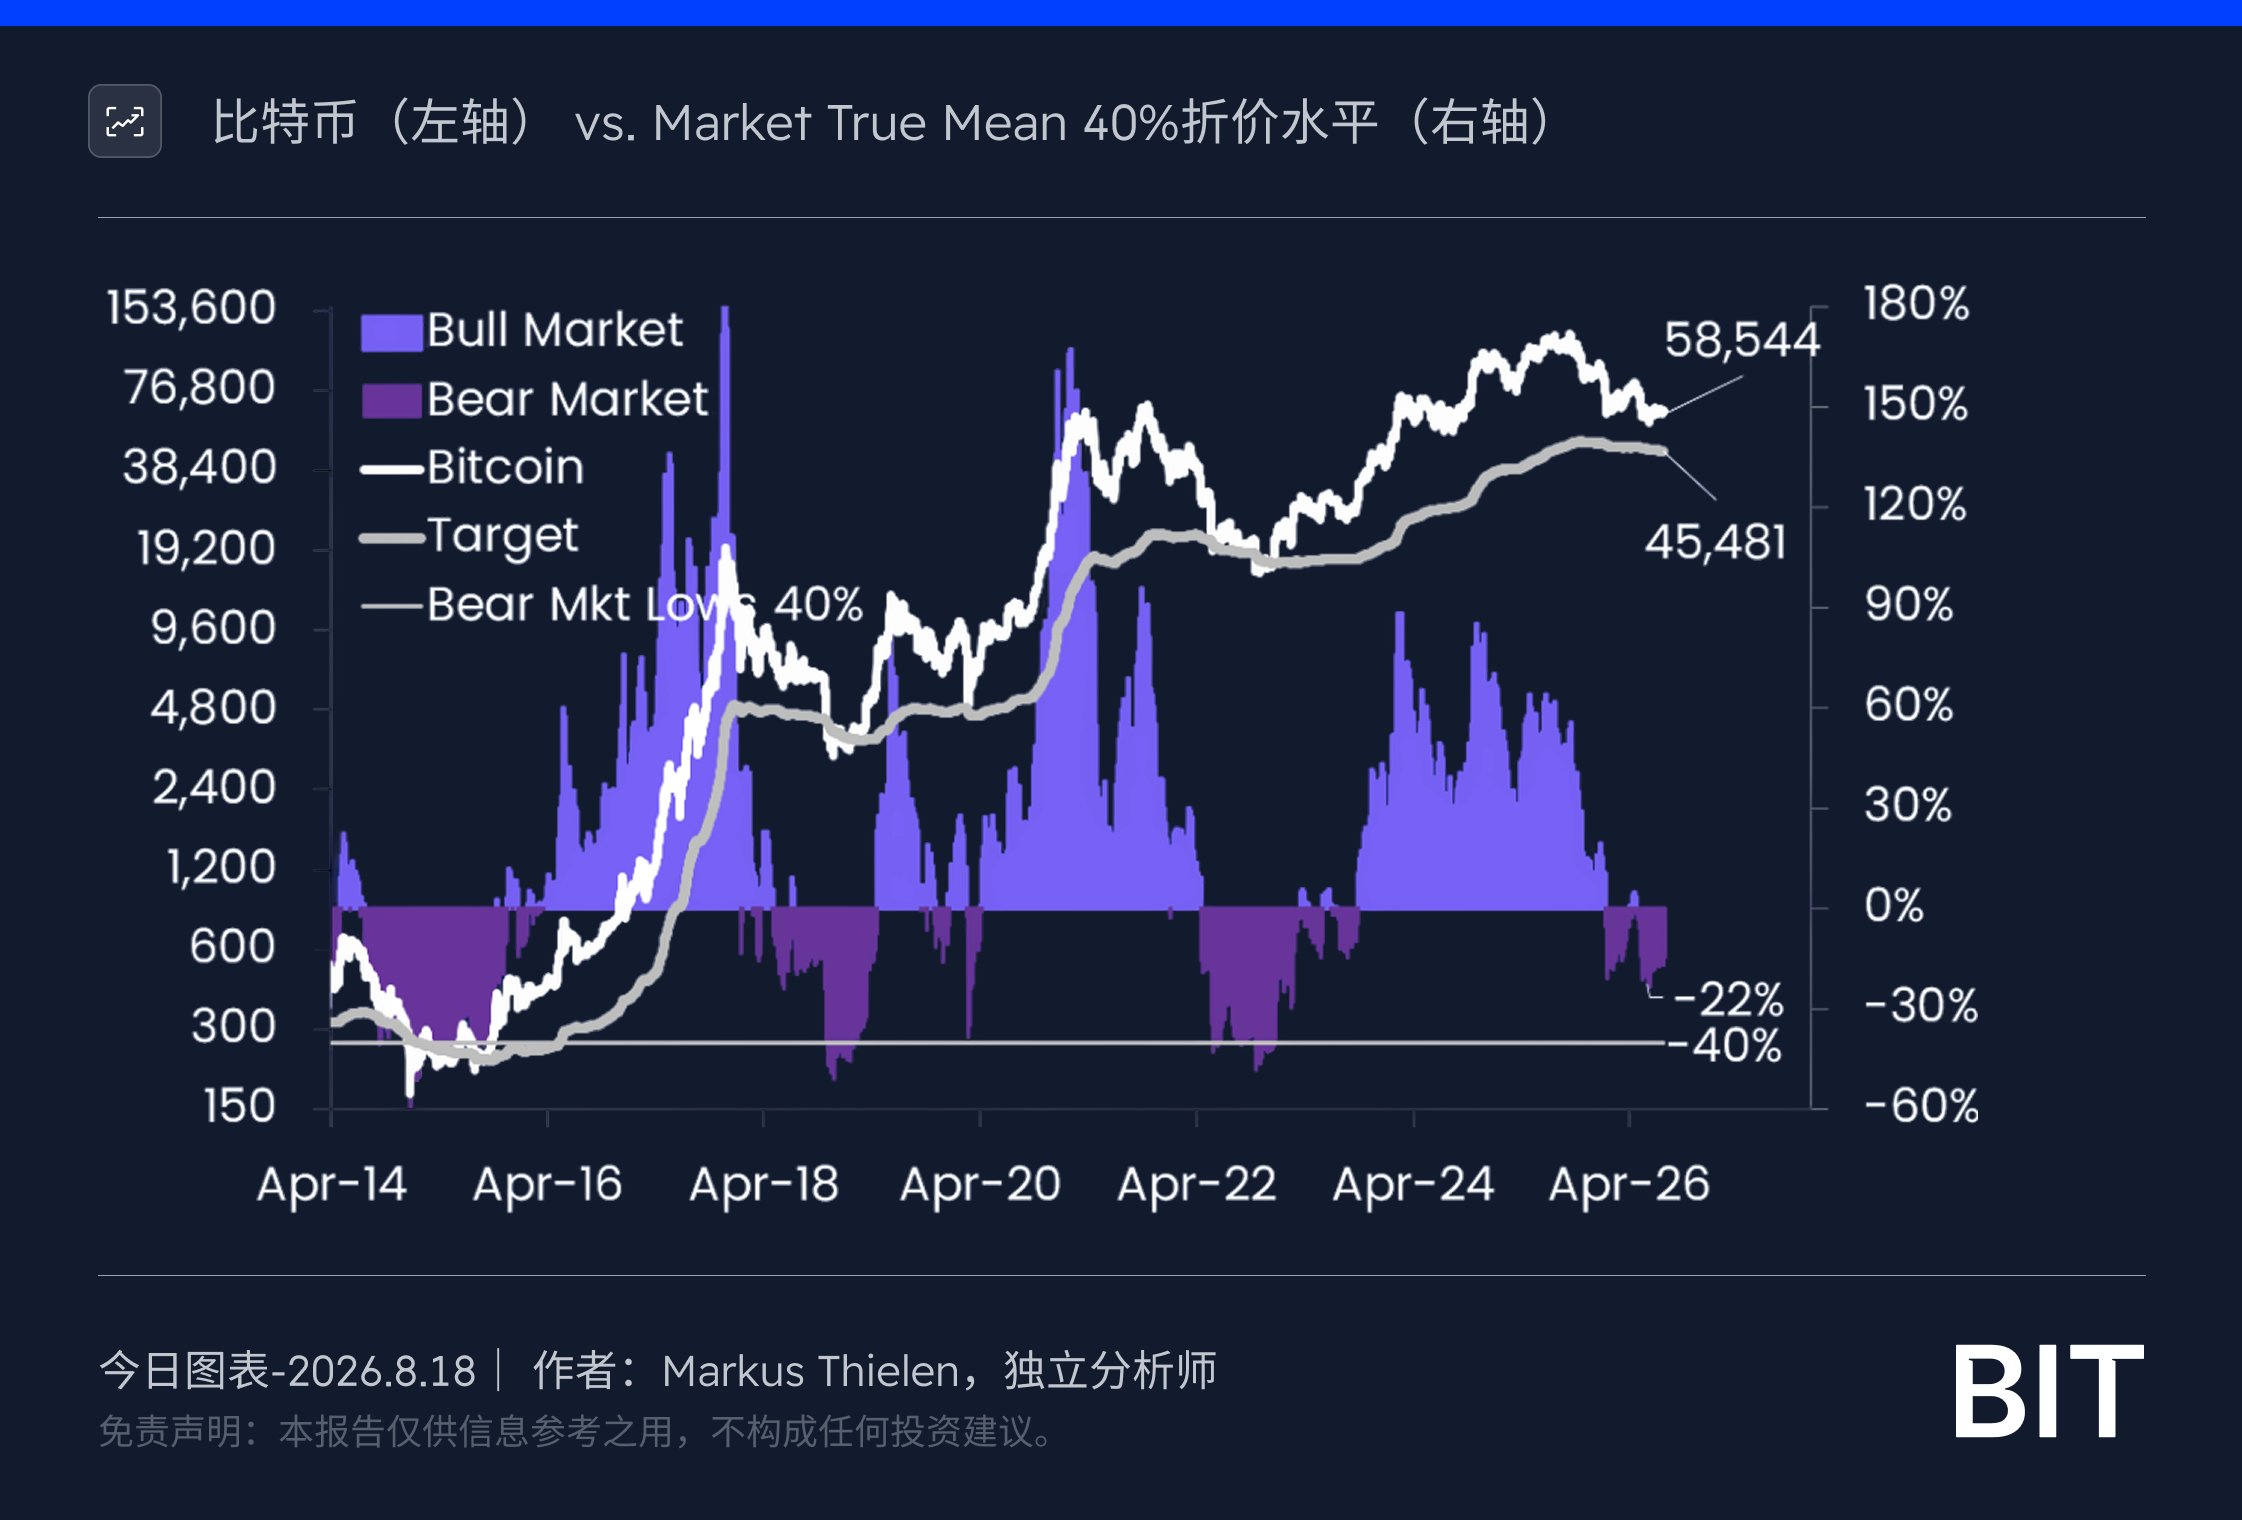
From current levels, the potential downside risk is approximately 20%, corresponding to roughly 60% potential upside space, making the risk-reward ratio increasingly attractive.
Bitfinex: Bitcoin Is in the Mid-to-Late Stages of a Bear Market
Bitcoin currently exhibits characteristics of a mid-to-late stage bear market. The price is sandwiched between the long-term holder realized price of $52,699 (the bear market floor, where long-term holders remain in profit) and the short-term holder realized price of $67,176 (where recent buyers are all at a loss). The median realized price for BTC is approximately $63,200, which has been providing support over the past two weeks. A break below this level could lead to a retest of $57,803.
Arthur Hayes: Fed Balance Sheet Expansion Would Be Bullish for Bitcoin
BitMEX co-founder Arthur Hayes published an article titled "Yen-quake," stating that the Japanese yen is currently the most undervalued currency and must appreciate under pressure from the US, China, and domestic political forces in Japan. He analyzed three possible paths and believes the most likely scenario, favored by both the US Treasury and Japanese political circles, is: Japan's Ministry of Finance uses the Federal Reserve's FIMA repo facility to pledge its US Treasury holdings to the Fed in exchange for US dollars, then sells dollars in the foreign exchange market to buy yen, and channels the yen proceeds back into Japanese government bonds and equities. This move would expand the Fed's balance sheet, boost dollar liquidity, promote yen appreciation, and orderly unwind yen carry trades. Furthermore, historically, Fed balance sheet expansion has been highly correlated with Bitcoin rallies. He expects that once this operation moves forward, it will bring significant liquidity benefits to Bitcoin and the crypto market.
Trader Killa: Bitcoin Could Officially Confirm a Bull Market Turn If It Reclaims $69,500
Trader Killa posted that Bitcoin has now returned above the Mayer Multiple level of 0.8, after previously breaking below this level. He noted that in 2022, BTC also briefly broke below this level before subsequently reclaiming it.
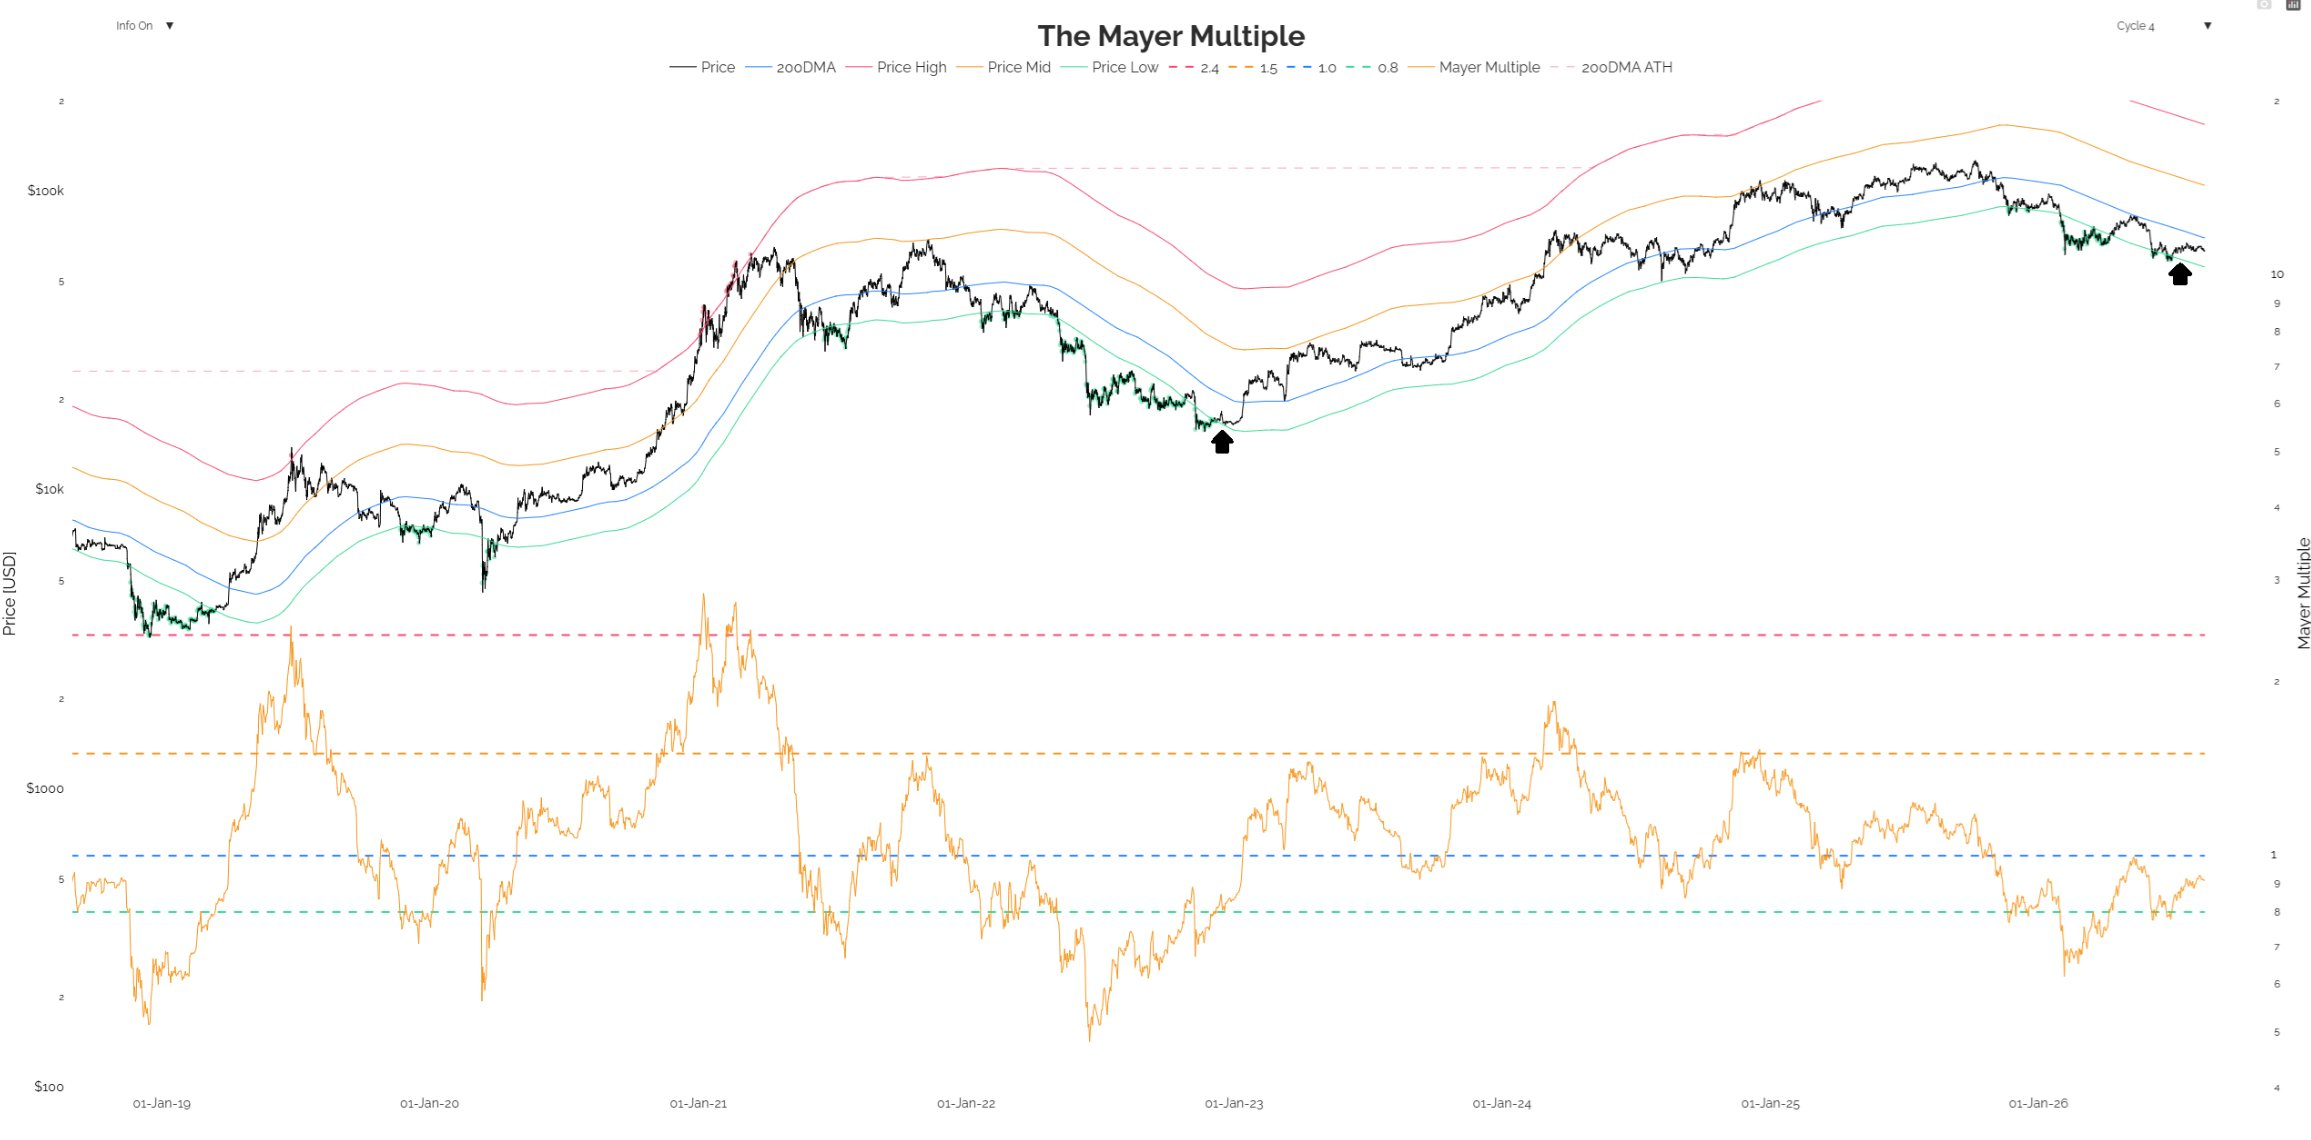
Killa stated that in 2022, the real confirmation signal came when Bitcoin reclaimed its 200-day moving average, which was followed by the onset of a bull market. Currently, BTC's 200-day moving average is located around $69,500. He believes that all that is needed now is for Bitcoin to break above and hold the 200-day moving average; once this occurs, the market can be considered to have officially turned bullish.