






Gate Institutional Weekly: BTC Price and OI Recover Simultaneously, LST Sector Rebounds Alongside SOL Recovery


- Core View: Last week, the crypto market experienced a "first decline, then recovery" under the impact of CPI exceeding expectations and geopolitical risks in the Middle East. Both BTC and ETH achieved rebounds; ETF capital flows improved significantly. However, the market rebound was primarily driven by existing capital, with limited new on-chain liquidity. The derivatives market transitioned from deleveraging to a stable phase of price recovery and volatility compression.
- Key Elements:
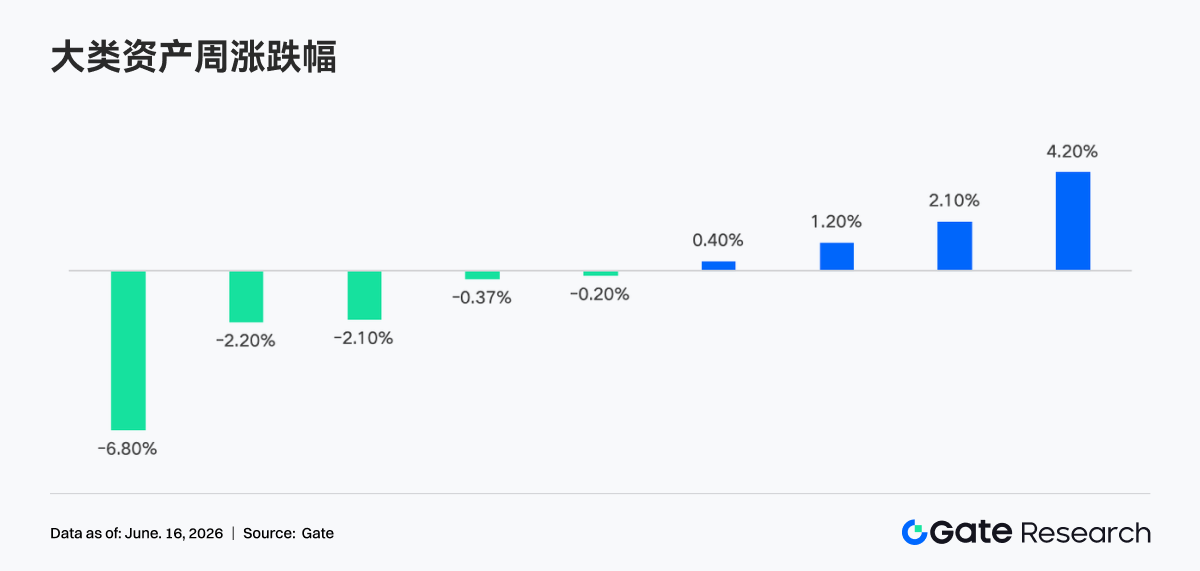
- CPI data exceeding expectations and the situation in the Middle East triggered a brief risk-off, but risk assets quickly recovered. BTC posted a weekly gain of about 4.2% to $65,000, while ETH gained about 2.1% to approximately $1,726.
- Bitcoin ETF flows shifted from significant outflows to net inflows. Ethereum ETFs performed even better, with positive capital inflows into Fidelity's FETH and BlackRock's ETHB product with staking features.
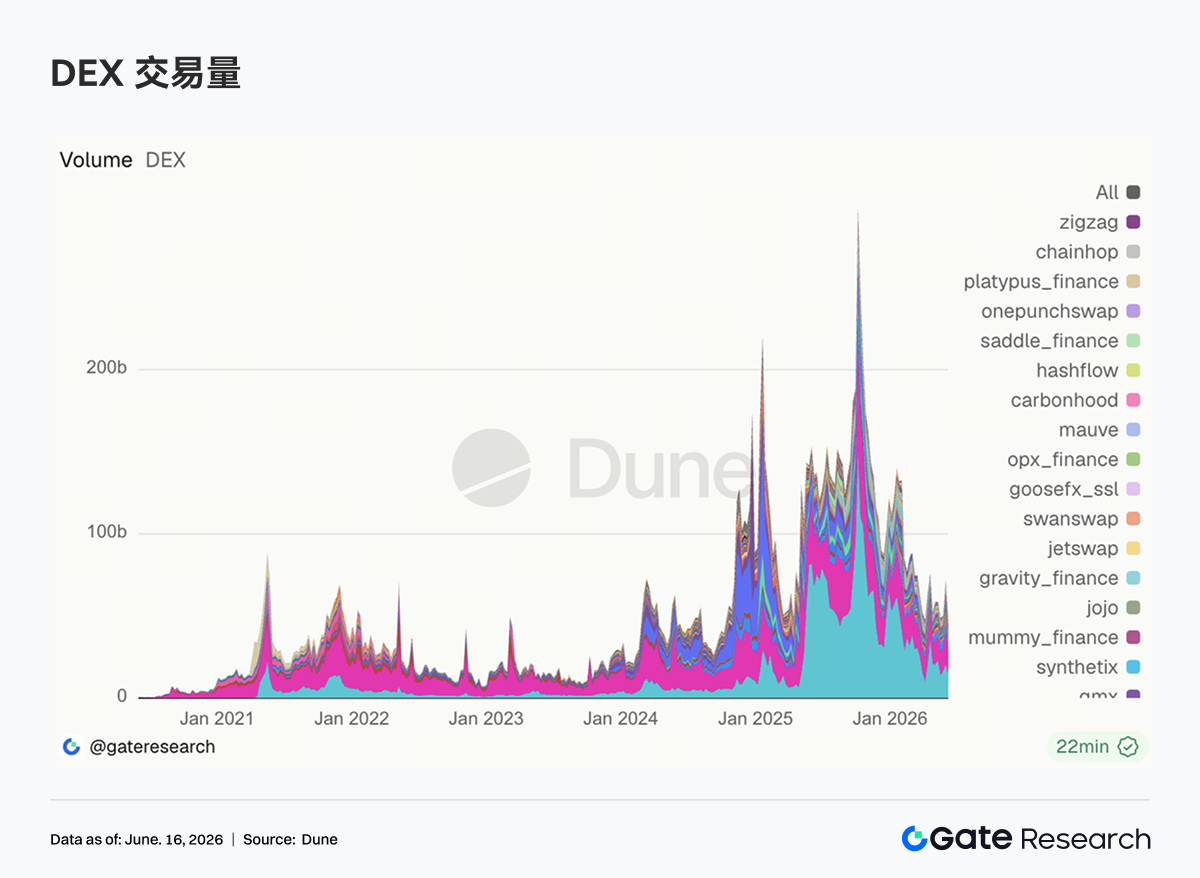
- DEX trading volumes generally cooled from their highs, and the supply of major stablecoins continued to contract, indicating that the market rebound relied more on churn among existing capital than on new on-chain dollar inflows.
- Aave's lending scale stopped declining and recovered, but the increase was primarily concentrated in the Ethereum main market, with capital aggregating towards the core ecosystem with more mature liquidity and risk control.
- The derivatives market recovered alongside the BTC rebound, with leveraged capital re-entering the market. Options trading volume and implied volatility continued to decline, signaling that the market has entered a phase of "price recovery and volatility compression."
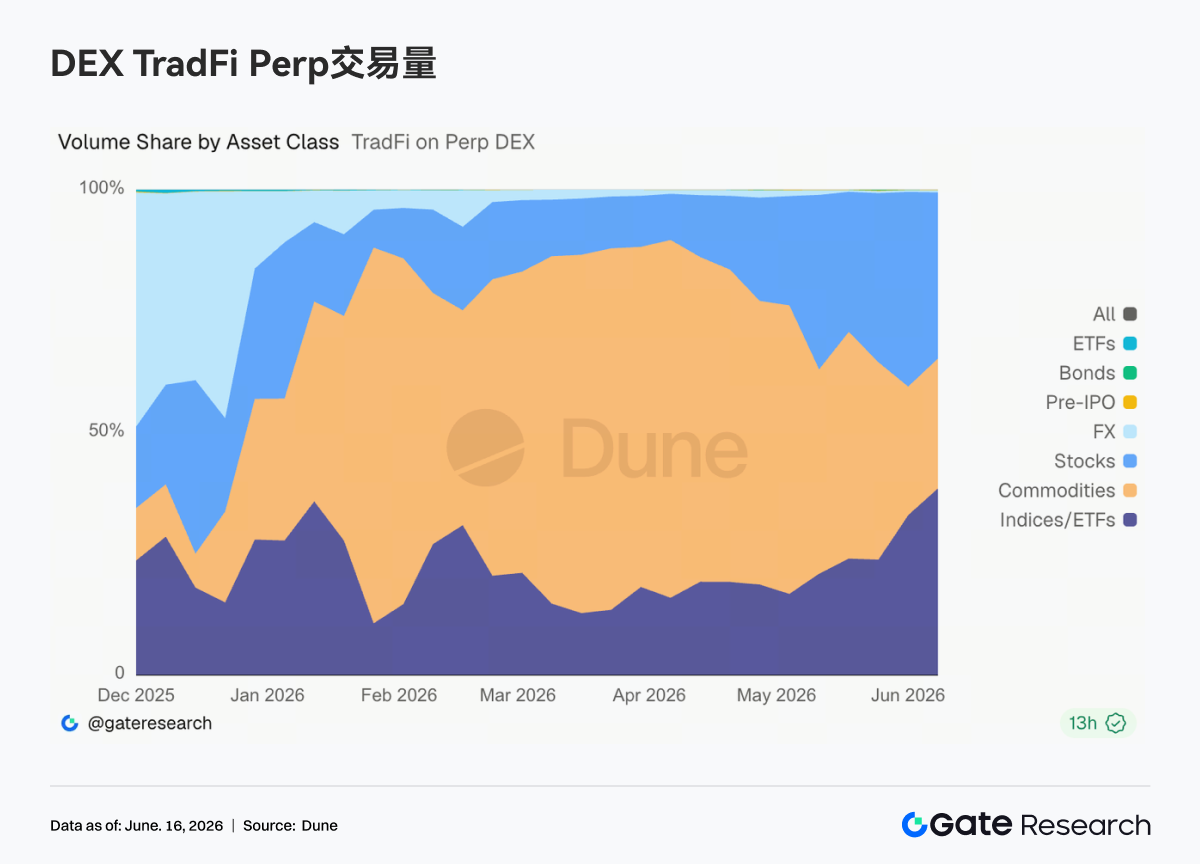
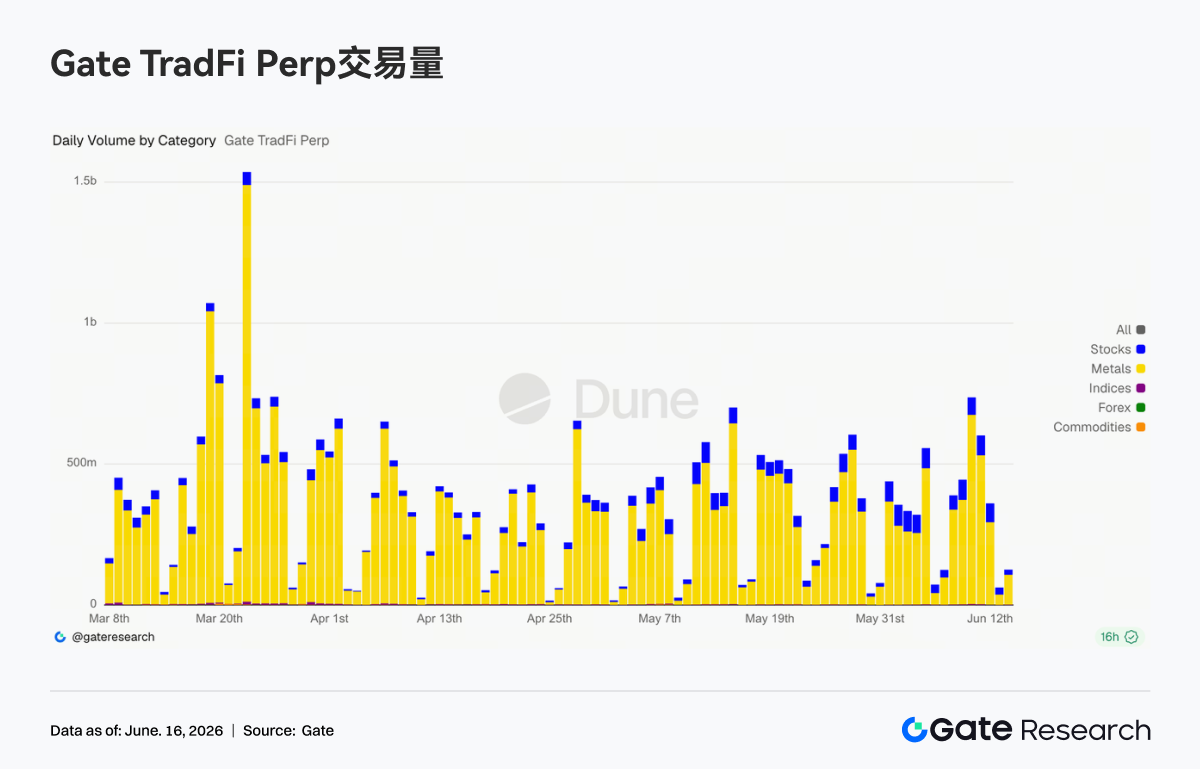
- TradFi Perp trading remained active, with daily trading volume breaking through $500 million multiple times. The proportion of stock and index ETF trading increased, as some speculative capital shifted from crypto assets to traditional financial instruments.
Summary
• Last week, the market briefly entered a risk-off mode under the impact of higher-than-target CPI data and geopolitical risks in the Middle East. However, as risk assets rapidly recovered, BTC, ETH, and the broader crypto market experienced a 'first dip, then rally' reversal. ETF fund flows showed significant improvement.
• Over the past week, Gate TradFi Perp saw single-day trading volumes exceeding USD 500 million multiple times, with a notable surge around June 11th, peaking near USD 700 million. The proportion of stock trading volume increased significantly compared to the previous period, with tech stocks, Pre-IPO shares, and popular US stocks attracting more capital participation.
• DEX trading volumes generally declined compared to the previous week, with leading protocols like Uniswap and PancakeSwap cooling off from their highs. Meanwhile, the supply of major stablecoins continued to contract, suggesting the market rebound relied more on the turnover of existing capital, and high-exposure events have not yet led to significant new on-chain dollar inflows.
• The LST sector recovered alongside the price rebound of ETH and SOL, with staked assets on the SOL ecosystem showing stronger performance. Aave's lending scale stabilized and rebounded, but the increase was primarily concentrated in the Ethereum main market, with capital re-aggregating towards the core ecosystem with more mature liquidity and risk control.
• Aave's borrowing rates remained low, and the pressure on USDC capital eased, indicating the market has not yet restarted large-scale leverage expansion. Concurrently, protocol revenues generally returned to normal levels, with the short-term heat from derivatives, MEV, and on-chain trading quickly fading.
• The derivatives market recovered in tandem with BTC's rebound, with leveraged capital re-entering the market and demand for downside protection significantly cooling. Options volumes and implied volatility continued to decline, suggesting the market is shifting from the previous deleveraging and defensive phase to a relatively stable stage of 'price recovery, volatility compression'.
• Gate's institutional trading volume share increased by 7.5% QoQ; BTC and ETH spot trading outperformed the market, with their global market share increasing by 9.62% QoQ. CrossEx trading volume rose 22.6% WoW, with support added for 37 new trading pairs.
1. Market Focus Analysis
The biggest macro event last week was the May CPI data released on Wednesday. The data showed CPI rose 4.2% year-over-year, while Core CPI was up 2.9% YoY, accelerating for the third consecutive month, reflecting the lagged impact of higher energy prices earlier in the quarter. US stocks fell sharply after the data release, with the Dow Jones Industrial Average plunging over 950 points in a single day, the S&P 500 falling 1.62% to 7,267 points, and the Nasdaq also following suit with heavy losses. Geopolitically, tensions in the Middle East remained high. After a temporary phase of easing, rifts reappeared in US-Iran relations. Market risk aversion initially heated up following the CPI shock but gradually subsided as risk assets stabilized.
Entering Thursday, market sentiment quickly recovered from extreme pessimism, leading to a sharp rebound in risk assets. The overall crypto market trend followed a pattern of declining first and then rising: BTC recorded a weekly gain of approximately 4.2%, starting the week around USD 63,000, dipping to a weekly low of USD 60,000 in the middle, before strongly rebounding to close above USD 65,000. ETH saw a weekly gain of about 2.1%, opening high near USD 1,680, testing a low of USD 1,604, and finally closing around USD 1,726. Altcoins generally recovered in tandem with the majors, but the magnitude varied. The total crypto market cap largely recovered after a significant mid-week contraction. The Fear and Greed Index touched the 'Extreme Fear' zone early in the week but gradually rebounded alongside the rally, though it remained in the weak sentiment territory.
Regarding the Fed, the policy path is quite clear. The 4.2% headline inflation rate and strong labor market data support maintaining a high-interest rate policy stance for an extended period. However, over the past month, Brent crude oil prices dropped from around USD 113/barrel to USD 87/barrel. This significant decline in oil prices, coupled with softer core inflation data, suggests that the inflation shock from energy may be starting to reverse. The current federal funds rate is maintained in the 3.50%—3.75% range, and the market's implied probability of the Fed 'holding steady' at the FOMC meeting on June 16-17 is close to 99%. Furthermore, the market still sees a greater possibility of further monetary policy tightening before year-end, but this expectation could change if falling energy prices translate into slower headline inflation in the coming months.
2. Liquidity Analysis
2.1 Market Confidence Recovers Quickly, BTC and ETH ETF Outflows End
Last week, spot Bitcoin ETFs underwent a structural shift of 'outflows first, recovery later'. The week started poorly, with BlackRock's IBIT seeing net outflows of approximately USD 233 million on Monday, dragging the entire market of spot Bitcoin ETFs to net outflows of about USD 91.37 million that day. This continued the pessimistic trend from the previous week, which saw net outflows exceeding USD 1.67 billion, as institutional capital remained cautious or even reduced positions amid heightened macro uncertainty. IBIT recorded its first net inflow of the week on Wednesday, marking a clear inflection point in market sentiment. After the CPI risk was fully digested, market confidence recovered quickly. On Thursday, spot Bitcoin ETFs recorded total net inflows of approximately USD 85.85 million, with none of the 12 Bitcoin ETF funds experiencing net outflows, ending the multi-day period of net withdrawals.
BlackRock's IBIT currently has an AUM exceeding USD 70 billion, leading the market by a significant margin; Fidelity's FBTC ranks second with an AUM of about USD 17.7 billion. Together, they hold over 90% of the spot Bitcoin ETF market share. Looking at the full week, the fund flows for Bitcoin ETFs showed some resilience after the negative shock, with institutional bargain-hunting evident near the price lows. However, whether sustained net inflows can form a trend requires confirmation from subsequent data.
Last week, spot Ethereum ETFs significantly outperformed spot Bitcoin ETFs. Against the backdrop of large net outflows from BTC ETFs, ETH ETFs surprisingly recorded net capital inflows first, exhibiting a 'seesaw effect'. On Monday, spot Ethereum ETFs saw total net inflows of approximately USD 82.37 million, led by Fidelity's FETH with about USD 28.57 million, while BlackRock's new staking-enabled product ETHB attracted around USD 26.96 million. Analysts believe the approximate alignment between the net outflows from Bitcoin ETFs and net inflows into Ethereum ETFs on that day reflects institutional rebalancing operations between major crypto asset classes, rather than a sign of a full-scale retreat.
Looking at the full week, fund flows for Ethereum ETFs maintained a positive trend. The total AUM for spot Ethereum ETFs currently stands at about USD 21.5 billion. Institutional interest in Ethereum appears to be heating up, particularly in new products featuring staking yield functionality, where the momentum of capital inflows is relatively strong. This might indicate a market reassessment of the value of the Ethereum ecosystem.
2.2 TradFi Liquidity
• TradFi Perp DEX: Over the past week, the trading structure of TradFi Perp DEXs has seen notable shifts. The share of commodities trading has continued to decline, while the proportion of stocks and indices/ETFs has increased significantly. Since mid-May, the commodity sector's share has gradually fallen from a previous high of nearly 70% to around 25%—35%. Meanwhile, the stock sector's share has rapidly recovered to about 30%, and the index/ETF share has risen to approximately 35%—40%, becoming the primary source of recent incremental volume. This shift is closely related to the recent market environment. On one hand, safe-haven trading spurred by Middle East tensions drove commodities like gold to highs before entering a consolidation phase, leading to marginally cooling related trading interest. On the other hand, the SpaceX IPO and continued activity in tech sectors like AI and semiconductors have attracted capital to reallocate towards US stocks and related index products. For TradFi Perp platforms, user demand is expanding from simple gold trading to a more diverse set of asset classes including stocks, ETFs, and Pre-IPO opportunities.
• Gate TradFi Perp Trading Volume: Over the past week, Gate TradFi Perp trading volume remained generally active, with single-day volumes repeatedly exceeding USD 500 million. Volume notably expanded around June 11th, peaking near USD 700 million. In terms of asset structure, precious metals still hold an absolutely dominant position, with gold-related products contributing the vast majority of volume. The share of stock trading has increased compared to the prior period, indicating users are increasingly participating in trading tech stocks, Pre-IPO shares, and popular US equities. Notably, against the backdrop of generally cautious capital within the broader crypto market, TradFi Perp trading activity did not decline concurrently, suggesting some speculative capital is shifting from native crypto assets to traditional financial instruments like gold, stocks, and indices.
• Gate TradFi US Stock Asset Count: Gate officially launched its US stock trading service on June 2nd. Leveraging advantages such as real underlying asset support, direct USDT trading capability, no overnight holding fees, and high liquidity, the service has continuously gained market attention since its launch, with trading volume growing steadily. Currently, Gate supports 7 major asset classes: ADRCs, Stocks, ETFs, ETNs, ETS, ETVs, and PFDs, and continues to expand its product coverage. In terms of the number of assets, the total number of tradable instruments has doubled since launch. The stock category has seen the most significant growth, with its share of total assets increasing from about 70% at launch to 85%, further enriching users' investment choices. Looking ahead, Gate will continue to promote access to more markets, integrate global liquidity, and build cross-market trading capabilities, constantly expanding diversified asset coverage to further strengthen its strategic positioning as a global asset trading and market access platform.
• TradFi Order Book Depth: We selected XAUT, the highest volume TradFi asset, for order book depth (Delta) analysis last week. XAUT's order book liquidity exhibited a 'weak first, strong later' characteristic overall. Between June 10th and 12th, influenced by escalating Middle East tensions and heightened risk aversion, order book depth contracted significantly, with Delta repeatedly falling below -1 million USD, indicating notable order withdrawals and liquidity pressure. As gold prices stabilized and rebounded around USD 4,050, liquidity quickly recovered after the 13th. On the 14th, a positive Delta peak exceeding USD 2 million was observed, with numerous orders re-entering the market. Overall, current XAUT depth has significantly improved, with liquidity supply strengthening, providing better market support for gold prices remaining at elevated levels.
3. On-Chain Data Insights
3.1 Market Rebound Fails to Sustain Volume, DEX Activity Cools from Highs
DEX trading volumes this week contracted notably compared to the previous week. Uniswap, PancakeSwap, Aerodrome, and Curve all pulled back from their highs. The turnover demand generated by the market rebound did not persist for the full week. PancakeSwap overtook Uniswap again, but the gap between them is narrow, with top-tier liquidity concentrated in the BNB Chain and Ethereum ecosystems. Meteora, Raydium, and Whirlpool on Solana also cooled off. While PumpSwap maintained active user counts, the capital scale did not grow in tandem, indicating low per-trade value in retail high-frequency trading. Concurrently, speculative capital began flowing towards tech IPOs, oil prices, and on-chain equity perpetual swaps, meaning traditional crypto assets are no longer the sole risk trading entry point.
3.2 Stablecoin Supply Continues to Contract, High-Exposure Events Haven't Brought New On-Chain Dollars
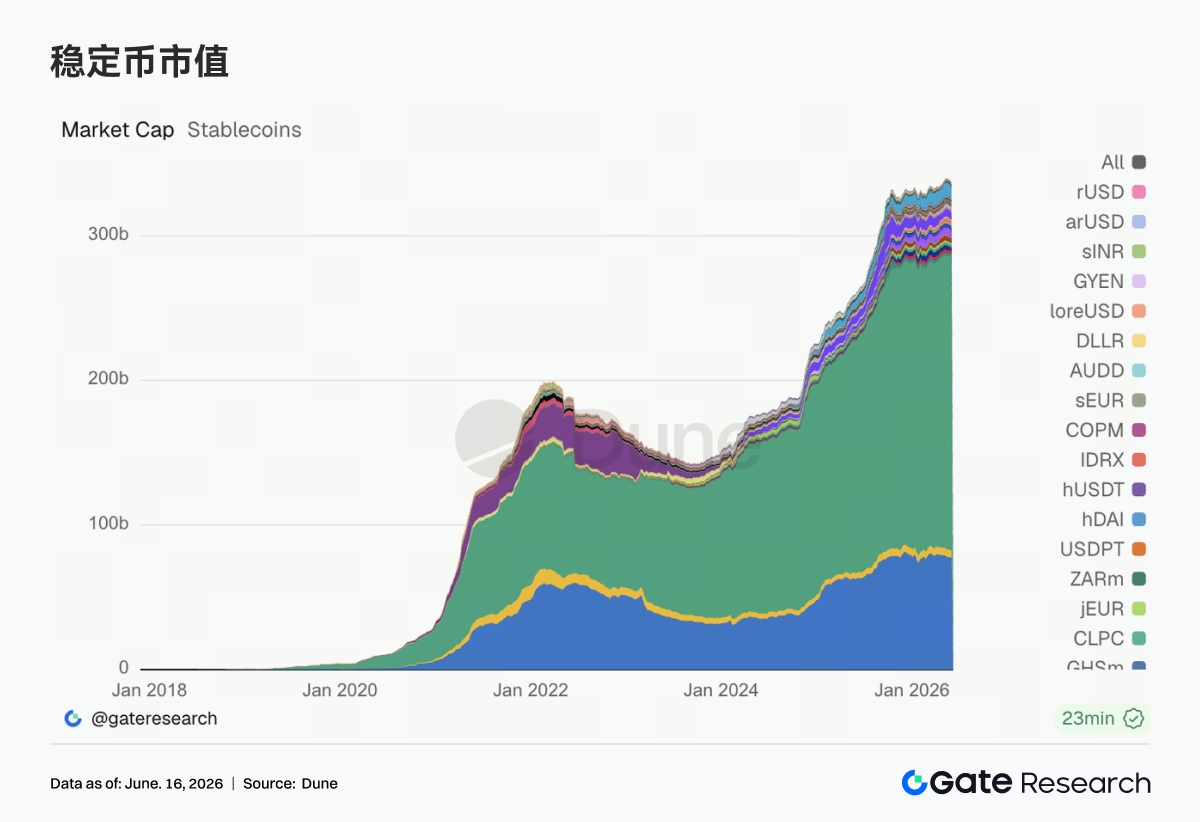
This week, the supply of major stablecoins generally decreased. USDT and USDC edged lower, while declines in USDS, USD1, DAI, and PYUSD were more pronounced. USDe's supply remained roughly stable; GHO bucked the trend and grew, making Aave's native stablecoin one of the few assets recording expansion. The contraction in stablecoins corroborates the cooling DEX trading activity, suggesting this week's market was primarily driven by the turnover of existing capital. Notably, World Liberty Financial's USD1 was announced for use as fighter bonuses for UFC events, garnering significant off-chain exposure, but supply data has yet to reflect corresponding growth. The market is clearly distinguishing between brand marketing and actual settlement demand; short-term publicity is insufficient to alter existing network effects. Regulation, reserve transparency, and cross-chain liquidity remain more important criteria for institutions when choosing stablecoins.
3.3 LST Sector Shifts to Valuation Recovery, SOL Staked Assets Rebound Faster
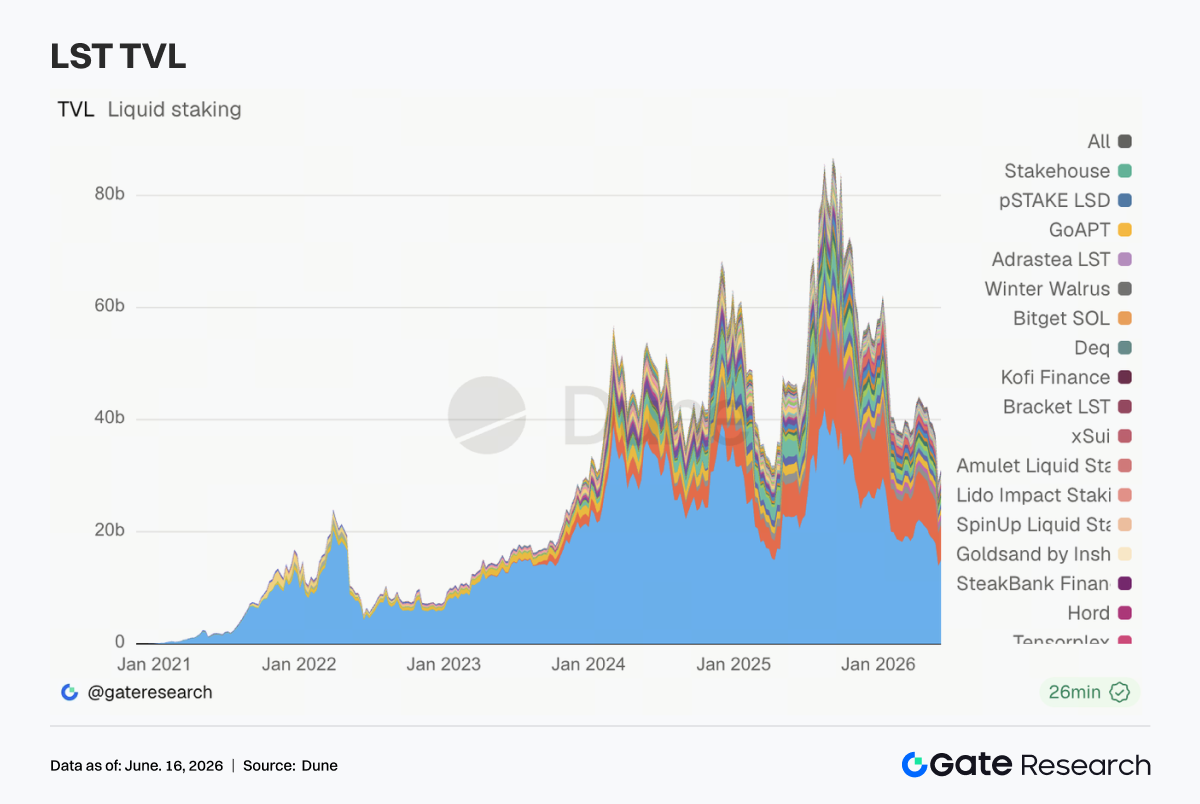
This week, the LST sector ended the synchronized decline of the previous week, with major protocols on both ETH and SOL sides showing recovery. Lido, Rocket Pool, and StakeWise experienced a modest recovery, with no further capital flight from ETH staking. The Solana side showed stronger elasticity, with TVL increases for Sanctum, Jito, and Jupiter Staked SOL generally outpacing their ETH counterparts, with Sanctum performing most prominently. However, as these figures are USD-denominated, the TVL rebound largely stems from the price recovery of ETH and SOL, and cannot be directly equated to net staking token inflows. The impact of the KelpDAO cross-chain incident remains, leading institutions to clearly differentiate their risk assessments of standard LSTs, re-staking wrapper assets, and cross-chain versions. This week represents primarily a valuation recovery and position refilling, insufficient to confirm a new round of staking capital expansion.
3.4 Aave Lending Supported by Ethereum Main Market, Multi-Chain Expansion Yet to Recover
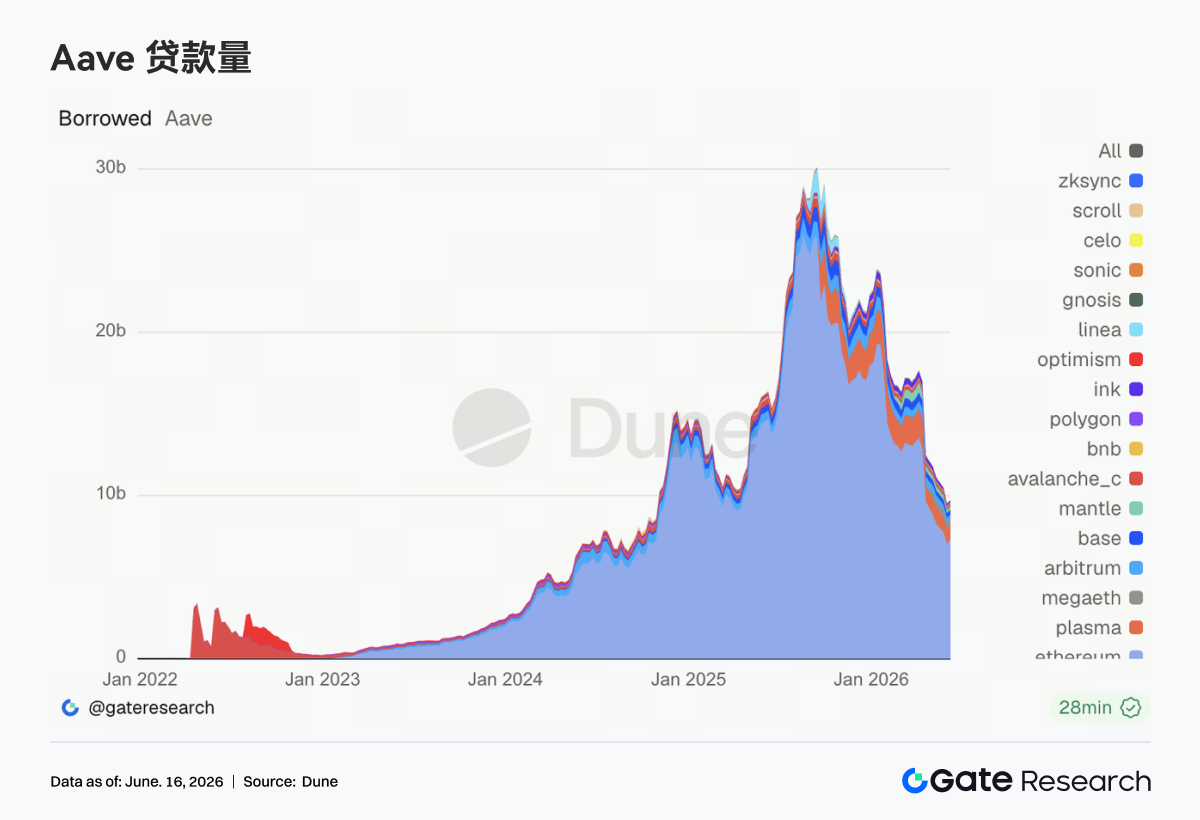
Aave's lending scale halted its continuous contraction, with significant recovery observed in the Ethereum market, becoming the primary source of stability for the total lending pool. Base, Mantle, and BNB Chain showed slight improvement, but Plasma, MegaETH, Avalanche, and Ink saw declines, with Ink experiencing the most significant contraction. Capital is flowing back from emerging markets to Ethereum, reflecting that borrowers currently prioritize collateral depth, liquidation liquidity, and the predictability of risk parameters. The cautious sentiment following the rsETH/KelpDAO incident has not fully subsided. The market is still observing the actual effects of WETH restoration, Emergency Guardian adjustments, and risk isolation measures. Against this backdrop, Aave V4's Hub-and-Spoke architecture holds greater practical significance, as it can reduce the probability of risks from a single collateral type or a single market transmitting to the entire protocol. Although the lending sector has seen an inflection point, this is currently a core market repair.
3.5 Aave Lending Rates Stabilize at Lows, USDC Tail Risk Further Eases
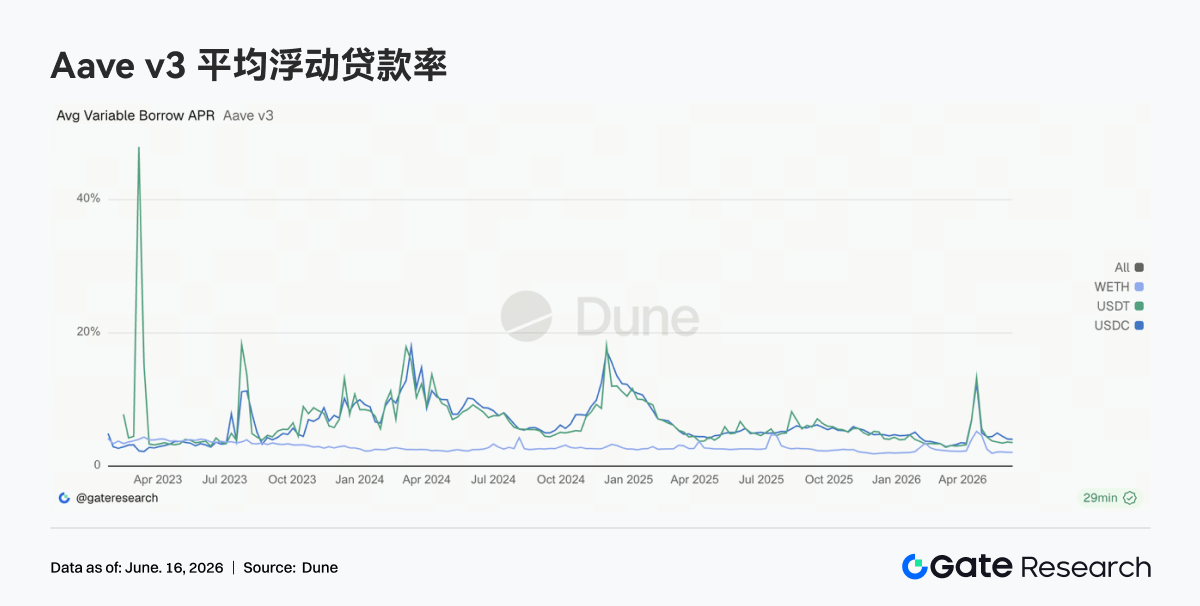
The average borrowing rates for USDC, USDT, and WETH remained broadly stable overall. USDC and WETH rates declined slightly, while USDT also traded in a narrow range. The peak rate for USDC within the week was lower than the previous week, indicating that short-term capital tightness caused by extreme utilization is easing. WETH rates stayed low; the recovery in lending balances did not trigger a surge in funding costs, suggesting directional leverage on ETH is restrained. The average cost of USDC is higher than USDT, with USD funding demand favoring core assets that offer deep liquidity and high institutional acceptance. The current environment is suitable for capital rotation, carry trades, and market-neutral strategies, but there are no signs yet of borrowers competing for liquidity. The read from the rate side is more moderate than from the balance side: Aave has moved past the stress phase following the incident, but risk appetite recovery still needs time.
3.6 Protocol Revenues Fully Return to Normal, Impulses from Derivatives & Infrastructure Rapidly Fade
This week, most top-tier protocols recorded lower revenues than the previous week. Industry profitability shifted from localized spikes to a broad-based cooldown. Tether and Circle still occupy the top two spots, but their reserve





