
Gate Institutional Weekly Report: Geopolitical and Economic Dual Drivers, Cautious Game Before FOMC and CPI
- Core View: Last week's market was driven by fluctuating geopolitical conflict expectations and strong economic data. Macro uncertainty dominated risk appetite, crypto market fund flows were cautious, on-chain activity showed structural adjustments, and the derivatives market entered a neutral gaming phase.
- Key Elements:
- Macro Drivers Move Markets: Fluctuating U.S.-Iran tensions and stronger-than-expected economic data like retail sales and non-farm payrolls jointly drove sharp volatility in oil prices, U.S. stocks, and precious metals. Cryptocurrencies participated in the risk-on/risk-off trades in sync.
- Cautious ETF Fund Flows: BTC ETFs saw a weekly net inflow of approximately $22.3 million, an improvement from the prior week but limited in scale. Influenced by mechanistic factors like end-of-quarter rebalancing and holidays, flows showed a V-shaped pattern, indicating an overall cautious sentiment.
- On-Chain Liquidity Concentration: DEX trading volume concentrated towards high-efficiency protocols like Meteora, showing internal divergence within the Solana ecosystem. Incremental stablecoin capital flowed towards DeFi-native assets like USDS and DAI, rather than USDT/USDC.
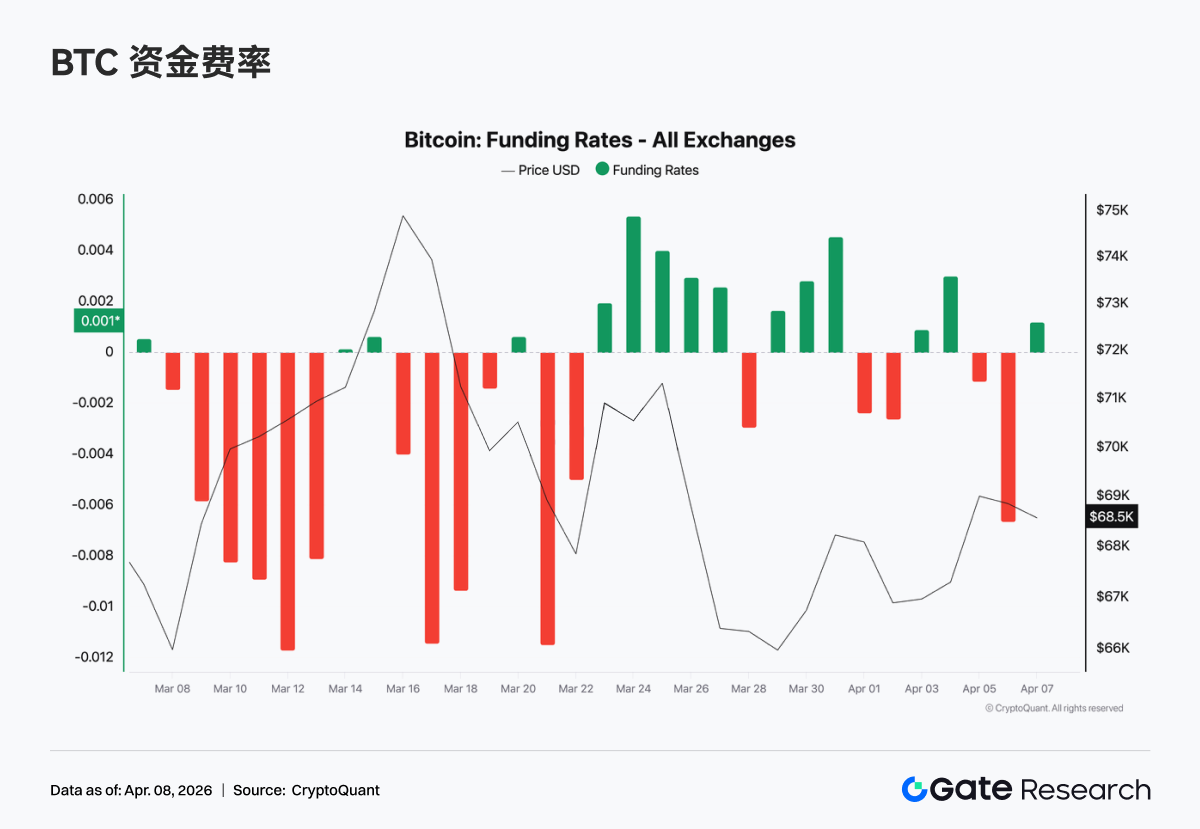
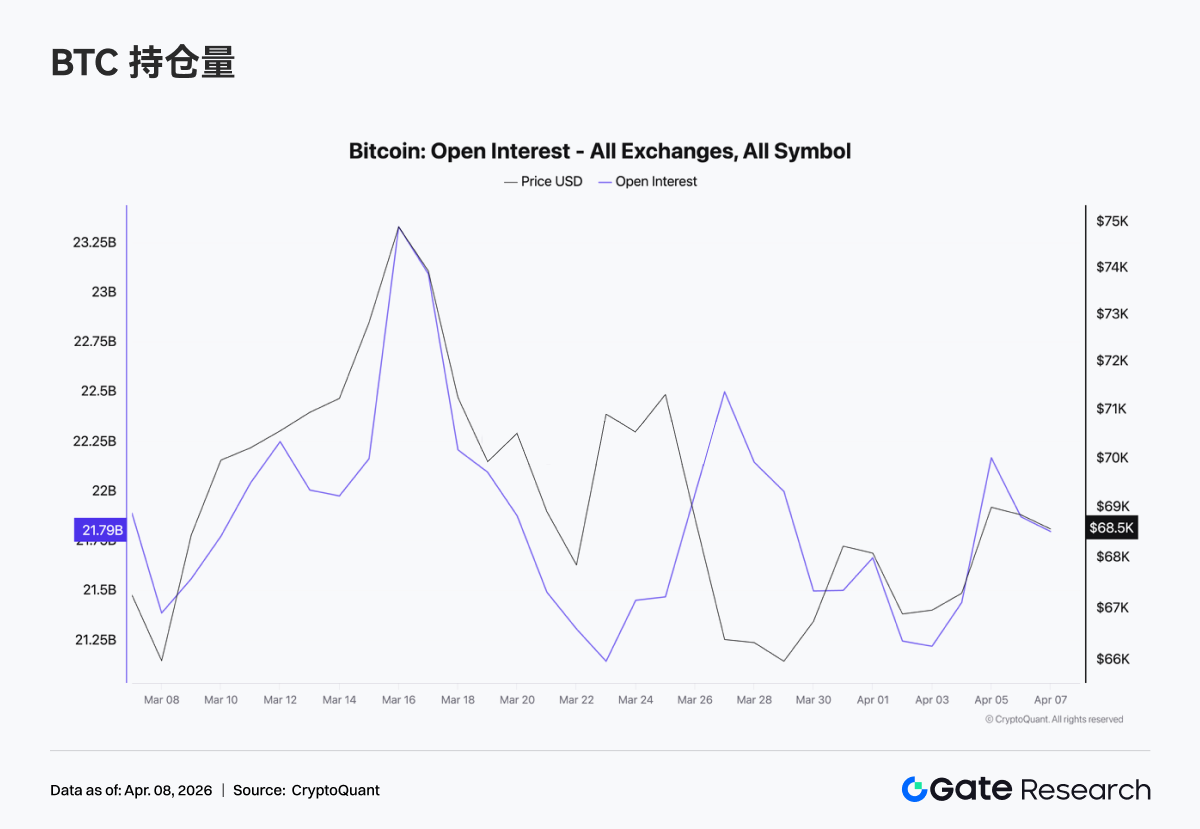
- Neutral Derivatives Sentiment: BTC funding rates recovered to near zero, open interest surged then retreated. Option skew remained negative, and positions concentrated towards the short end, indicating the market is pricing in short-term uncertainty without forming a clear trend.
- Protocol Revenue Structure Shift: Stablecoin issuance (e.g., Tether) remains a core revenue source, while exchange platform revenues declined. Front-end traffic entry points like Pump and Phantom saw rising revenues, suggesting capital flowing back to distribution channels.
Summary
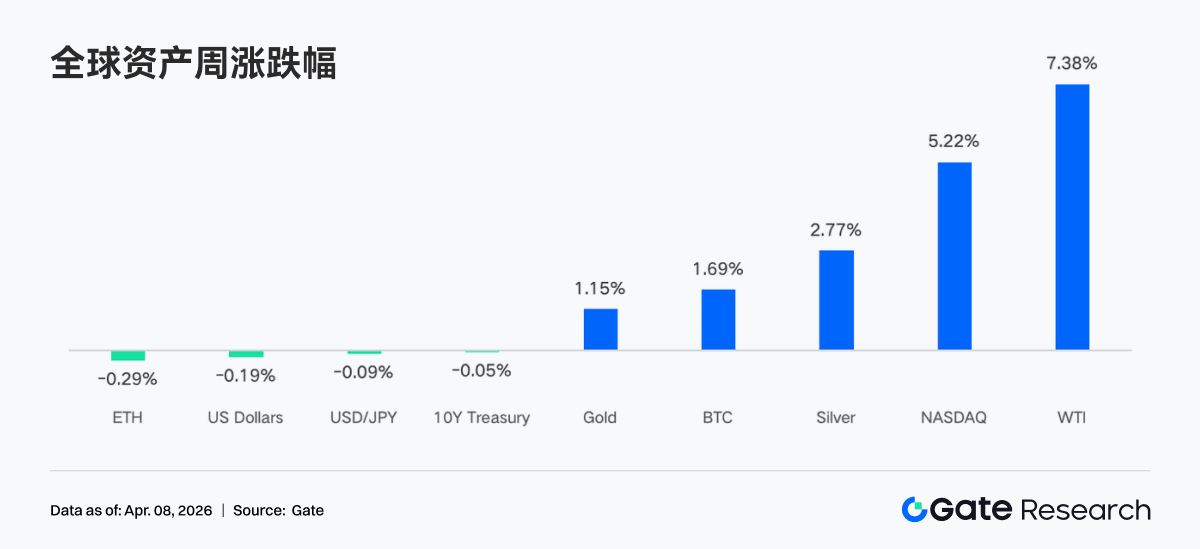
• The market's core drivers over the past week were the fluctuating expectations around geopolitical conflict and stronger-than-expected economic data. Repeated shifts in US-Iran rhetoric regarding ceasefire and military strikes drove significant volatility in oil prices, with WTI gaining over 7% for the week. Concurrently, retail sales, ISM, and non-farm payroll data all exceeded expectations, with economic resilience fueling a strong rebound in US stocks. Gold and silver continued to hit new highs, driven by a confluence of inflation and safe-haven demand.
• Capital flows exhibited low-amplitude fluctuations with structural disruptions. BTC ETFs saw a modest weekly net inflow of approximately $22.3 million, a clear improvement from the previous week but still limited in scale. ETH ETFs continued to experience net outflows. End-of-quarter rebalancing combined with holiday factors led to a V-shaped pattern in flows, with capital inflows in late March/early April followed by rapid outflows, reflecting that institutional allocation pace remains dominated by macro and mechanistic factors.
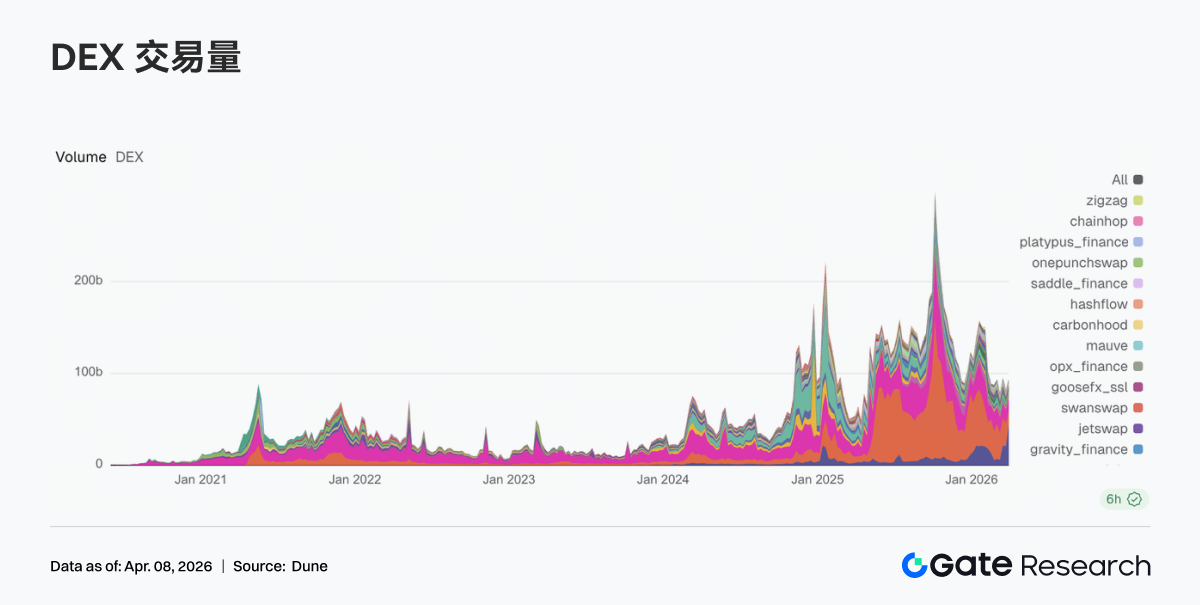
• On-chain and trading structures concentrated on high-volatility assets. TradFi trading volumes on Perp DEXs and CEXs notably tilted towards crude oil and precious metals, with the energy sector's share rising significantly and precious metals remaining elevated. The DEX landscape underwent a significant reshuffle, with Meteora's volume surging to claim the top spot, indicating liquidity concentration towards a few high-efficiency protocols and divergence within the Solana ecosystem.
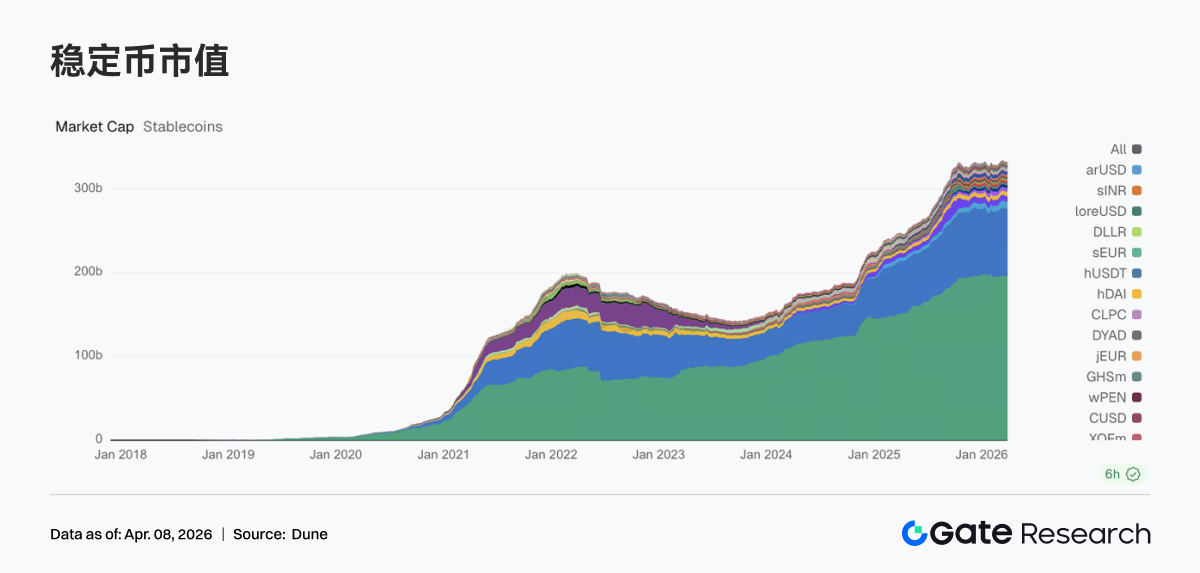
• Stablecoin and DeFi structures continued their adjustment. The total stablecoin supply oscillated at high levels, with USDT largely flat and USDC experiencing a slight decline; capital increasingly flowed towards DeFi-native stablecoins. In liquid staking, ETH-side protocols like Lido and Rocket Pool recovered, while Solana LSTs continued to adjust. Aave's borrowing scale rebounded overall, with recovery seen in both its main market and sub-chains.
• Protocol revenue structures returned to normal. Stablecoin issuance remained the primary revenue source; trading platform revenues declined from the previous week, while wallet and front-end entry points like Pump, Phantom, and Jupiter saw revenue increases, indicating capital flowing back to distribution channels.
• The derivatives market entered a neutral zone. BTC funding rates recovered to near zero, while open interest surged before retreating to around $21 billion. Options open interest concentrated on the short end, with increased Put demand; Skew remained in negative territory, and DVOL oscillated at high levels, indicating the market is primarily pricing in short-term uncertainty.
1. Market Focus Interpretation
On Monday, reports that the US and Iran were discussing a potential 45-day ceasefire and terms for reopening the Strait of Hormuz boosted markets significantly. Dow Jones futures surged 1,100 points overnight, and Brent crude briefly fell below $100 for the first time since early March. However, on Wednesday evening, remarks from former President Trump about continuing strikes on Iran for "two to three weeks" abruptly reversed market optimism. Oil prices subsequently soared above $113, with WTI crude posting a weekly gain of over 7%.
Recent economic data continues to show resilience. Last week's retail sales and ISM Manufacturing Index both exceeded expectations, indicating healthy consumer spending and ongoing manufacturing expansion. Friday's non-farm payroll growth and unemployment rate improvements, with monthly job additions reaching their highest level since December 2024, alleviated recession fears and propelled the Nasdaq to its best weekly performance since November 2025. Amid rising inflation expectations and safe-haven demand, gold and silver continued to set new highs, while cautious Fed commentary kept the US Dollar Index in a narrow range at elevated levels. The US Treasury market seesawed between strong employment data and inflation concerns, resulting in minor fluctuations in 10-year Treasury futures.
Cryptocurrencies participated in the risk-on trade, with Bitcoin approaching the $70,000 resistance level that has held for weeks and Ethereum breaking through the $2,100 mark. Bitcoin spot ETFs recorded a net inflow of $1.32 billion in March, following four consecutive months of outflows.
2. Liquidity Analysis
2.1 Crypto ETF Net Flows
Last week, BTC ETF flows exhibited a "V-shaped bump." March 31st saw a net inflow of $117.6M, the strongest single day at month-end, which abruptly reversed to -$173.7M on the first trading day of April. BTC ETFs saw a weekly net inflow of approximately $22.3M, while Ethereum ETFs saw a weekly net outflow of $42.2M. Compared to the previous week (-$296M net outflow), BTC ETF flows showed significant improvement, but the absolute volume remains the smallest positive weekly figure in recent months, indicating an overall cautious rather than optimistic sentiment.
Top BTC ETF Net Inflow Products:
1. ARKB (ARK 21Shares): Weekly net inflow of $34.2M
2. IBIT (BlackRock): Weekly net inflow of $16.4M
Top ETH ETF Net Inflow Products:
1. ETHB (BlackRock Staked ETH ETF): Weekly net inflow of $10.7M
2. ETH mini: Weekly net inflow of $6.5M
The largest net outflows came from ETHA (BlackRock) at -$64.0M, followed by FETH (Fidelity) at -$7.3M.
March 31st marked the end of Q1, a period when institutional passive rebalancing typically concentrates. If Bitcoin outperformed stocks and bonds in Q1, allocation models would automatically trim overweight positions. This explains the large outflow on April 1st following the late-month inflows—a mechanical, anticipated operation rather than a bearish signal. With the Good Friday long weekend approaching on April 3rd, CME futures and ETF creation/redemption mechanisms paused simultaneously, removing the anchor for institutional buying. Furthermore, economic data dampened rate cut expectations, further pressuring risk assets, with ETF flows already showing signs of slowing in early April.
The next key catalyst is the April 9th CPI data, which will directly influence the market's repricing of the rate cut timeline and potentially clarify the directional trend for ETF flows.
2.2 TradFi Liquidity
Over the past week, TradFi trading volume on Perp DEXs showed a clear structural reallocation. The energy sector (represented by CL, Brent Oil) saw its share rise significantly, becoming the dominant segment, primarily driven by rising oil prices and geopolitical risk, with amplified short-term volatility attracting concentrated trading capital. Meanwhile, precious metals (XAU, XAG) maintained a relatively high share but slightly declined, indicating persistent safe-haven demand but marginal trading heat being diverted to energy. The share of individual stocks (e.g., NVDA) continued to contract, showing that during macro-dominated phases, the trading appeal of single equity assets diminishes.
TradFi volume on CEXs remained high but was highly concentrated in commodities. Precious metals (XAU, XAG) remained the absolute core source of volume, maintaining a dominant share long-term, contributing over 70% of TradFi volume on some platforms, acting as a liquidity anchor. Secondly, the energy sector (crude oil CL, Brent) saw significant volume expansion and share increase during the week. Driven by rapid oil price increases and widening volatility, daily volume for crude oil perpetual contracts reached hundreds of millions of dollars, quickly becoming a core trading asset, reflecting capital's preference for "high volatility + macro beta."
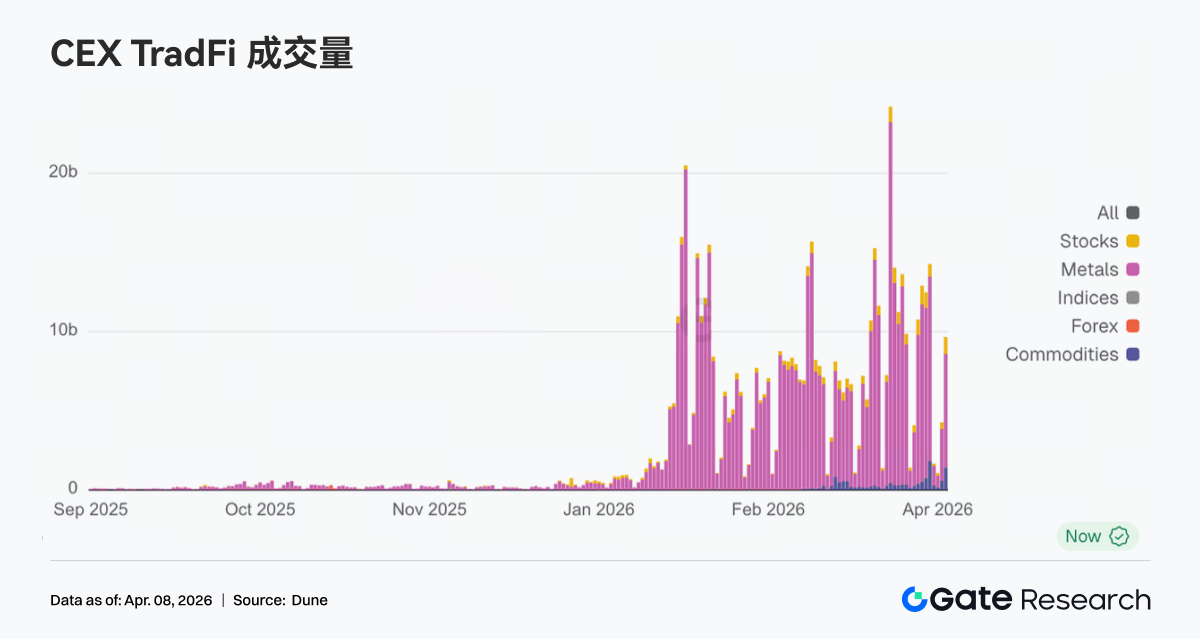
Over the past week, the number of TradFi asset categories expanded further. The total number of TradFi asset categories (counting only TradFi & CFD sections, excluding perpetuals) across three major CEXs increased from 678 to 802, a sequential growth of 18.3%. Stock categories grew most significantly, from 379 to 487 (up 28.5% sequentially). Stock indices ranked second in growth, from 69 to 81 (up 17.4% sequentially).
We selected XAUT, the highest-volume TradFi asset, to analyze its order book depth (Delta). Last week showed a typical pattern of "price rise → sustained net selling pressure →阶段性修复", reflecting capital primarily taking profits at high levels.
• Rising Phase: Depth turned negative, indicating sustained selling pressure. From March 31st to April 2nd, as XAUT price rose rapidly (corresponding to gold strength), order depth turned clearly negative with multiple large negative Delta spikes. This indicates that during the rally, active sell orders (profit-taking/hedging) continuously pressured the market; the move was not driven by chasing but represented a distribution phase of "price up,筹码出". This aligns with gold's characteristic as a safe-haven asset—rallies often accompany profit-taking demand.
• High & Consolidation Phase: Extreme negative Delta peaks, passive liquidity absorption. Around April 1st, extreme negative Delta (接近 -2M) appeared, corresponding to a阶段性高点, indicating large-scale concentrated profit-taking or short hedging, with buyers primarily providing passive liquidity. Subsequently, Delta gradually turned positive with multiple positive pulses, indicating some capital began buying on dips, but bullish confidence was not fully restored.
3. On-Chain Data Insights
3.1 Solana Trading Flow Concentrates on Meteora, DEX Rankings Significantly Reshuffled
Last week saw a notable reshuffle in DEX structures. Meteora's trading volume surged to $43.215 billion, significantly higher than the previous week's $20.631 billion, claiming the top spot. Mechanistically, Meteora's DLMM model benefits more from high-volatility environments and active market-making demand. PancakeSwap declined from $25.185 billion to $15.640 billion, Uniswap slightly decreased to $13.100 billion; mainstream spot platforms overall failed to capture the flow expansion on the Solana side. Divergence also appeared within the Solana ecosystem. Raydium dropped from $2.390 billion to $1.384 billion, while Whirlpool rose to $1.968 billion, and Pumpswap increased from $343 million to $471 million. Overall, last week's market pricing clearly favored trading elasticity and liquidity capture efficiency, with liquidity concentrating towards a few high-efficiency entry points.
3.2 Stablecoin Supply Maintains High Levels, Increment Concentrates on DeFi Core Assets
Last week, the total stablecoin supply oscillated at high levels. USDT remained largely flat; USDC saw a slight decline, continuing the trend of slowing growth since mid-March. Capital tilted towards DeFi-native stablecoins. USDS rose from $8.405 billion to $8.695 billion, and DAI increased from $5.213 billion to $5.461 billion, becoming the primary recipients of last week's increment. PYUSD slightly recovered to $3.170 billion, while USDT0 declined to $2.485 billion, reflecting capital分流 between payment channels and cross-chain bridging assets. Overall, on-chain capital last week showed a preference for stablecoin assets that can directly participate in DeFi.
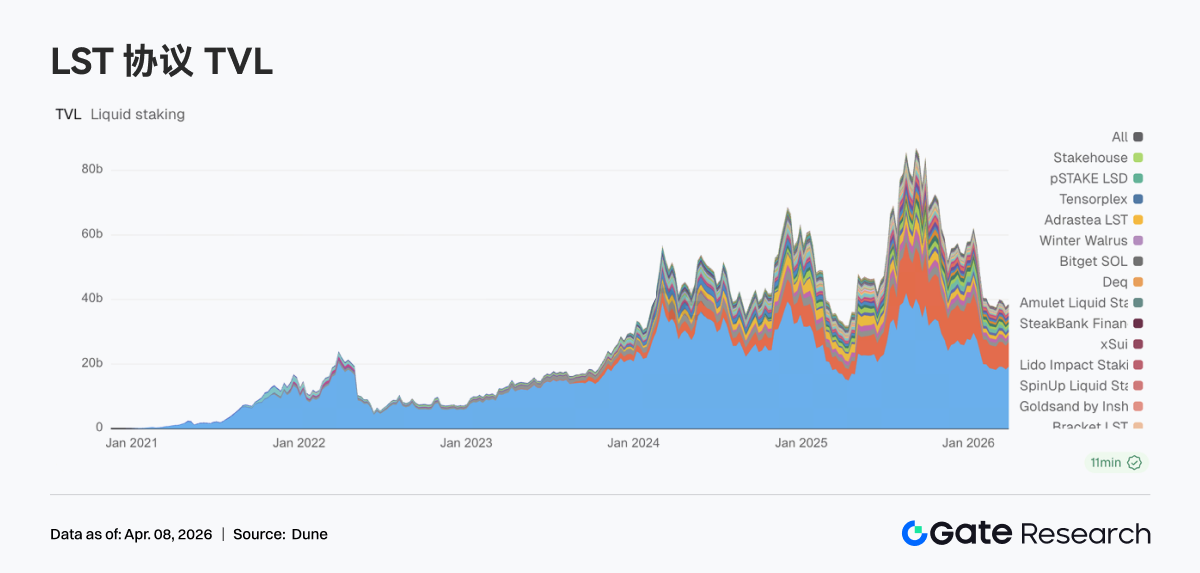
3.3 Liquid Staking Returns to ETH Mainstream, SOL Ecosystem Remains in Internal Adjustment Phase
The liquid staking sector showed divergence last week. The ETH side saw overall recovery, with Lido rising from $18.329 billion to $19.193 billion and Rocket Pool recovering to $1.192 billion, largely recouping last week's losses. In contrast, the Solana LST sector continued to adjust. Jito decreased from $1.021 billion to $906 million, with Jupiter Staked SOL and Kinetiq also declining. On the product front, Lido continues to advance institutionalized yield tools (e.g., EarnETH, EarnUSD), gradually完善 its收益体系; the Solana side remains in a structural筛选 phase.
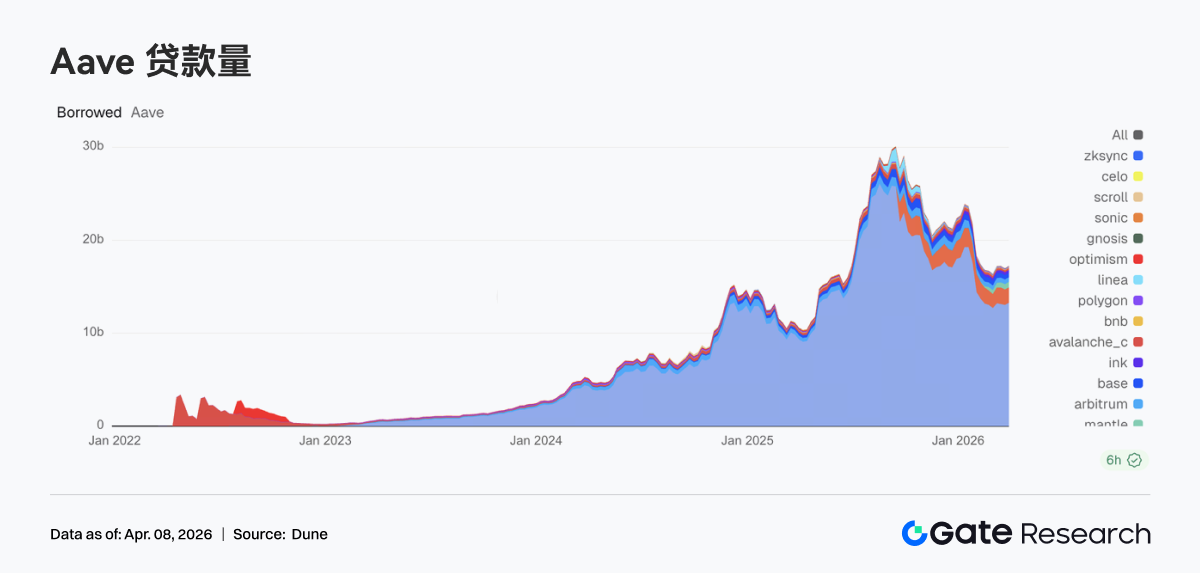
3.4 Aave Borrowing Scale Rebounds, Core Market and Sub-Chains Synchronize Recovery
Last week, Aave's borrowing scale ended its decline and resumed growth. The Ethereum main market increased from $13.050 billion to $13.266 billion, providing the primary支撑 for the overall rebound. Sub-chain markets同步改善: Mantle rose to $591 million, Base recovered to $496 million, and Arbitrum saw slight growth to $498 million. Plasma maintained a high level of $1.664 billion, indicating the资金吸附能力 of high-yield or new-scenario markets remains solid. Combined with Aave's ongoing推进 of the V4 Hub-and-Spoke architecture, this rebound resembles leveraged position rebuilding, laying the groundwork for future cross-market liquidity integration.
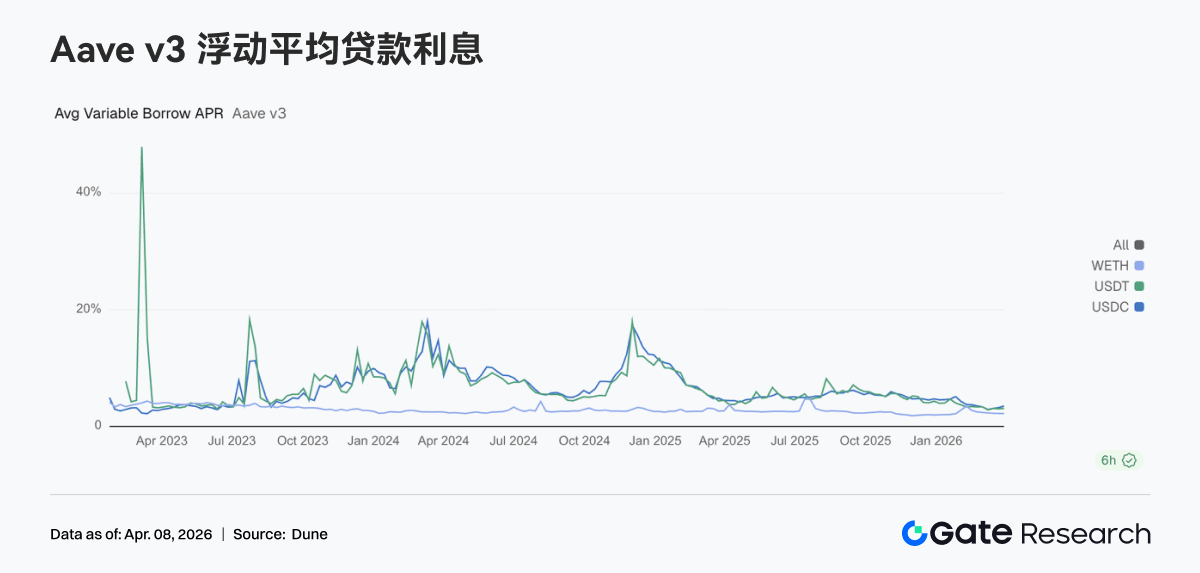
3.5 Interest Rate Divergence Intensifies, USDC Borrowing Costs Rise Significantly
Interest rates for Aave's three core assets further diverged last week. USDC borrowing APR rose most noticeably from 3.23% to 3.51%; USDT slightly increased to 3.10%; WETH remained largely around 2.23%. While borrowing scale recovered, capital primarily flowed to the stablecoin lending side, with ETH loan demand not同步增强. Market behavior leaned more towards capital调度, arbitrage, and position rolling rather than directional leverage expansion. Under the V4 architecture预期, price divergence between different assets may widen further. Last week's rise in USDC rates提前 reflects this trend.
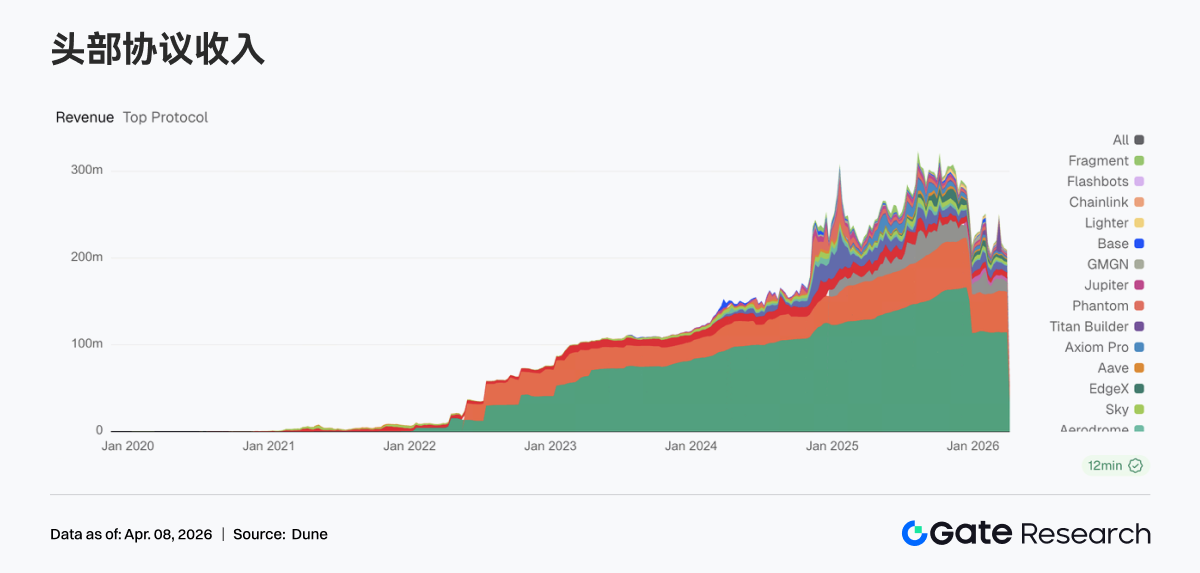
3.6 Protocol Revenue Returns to Fundamentals, Stablecoins and Traffic Entries Form Dual Support
Protocol revenue structures returned to normal last week. Tether's revenue was $114.29 million, Circle's was $46.6868 million; stablecoin issuance remains the most stable revenue source. Trading platform revenues declined, with Hyperliquid and EdgeX both down from the previous week, indicating a阶段性收敛 in trading elasticity. Meanwhile, traffic entry points began to rise: revenues for Pump, Phantom, and Jupiter all increased, showing capital flowing back to wallet and front-end distribution channels. Overall, the revenue structure shows a pattern of stablecoins providing the base, traffic entries strengthening, and trading platforms diverging.
4. Derivatives Tracking
4.1 BTC Funding Rates Stabilize from Negative, Market Enters Neutral Game Phase
Last week, BTC funding rates continued their recovery trend, gradually rising from persistently negative levels to near zero, briefly turning positive mid-week, indicating a transition from a bear-dominated defensive state to a balanced多空 equilibrium. The week started with轻微负费率, indicating weak risk appetite;随后, as prices stabilized and rebounded, rates quickly converged, driven by short covering and arbitrage capital. By the weekend, rates基本维持在 0附近窄幅波动, with no significant leverage放大, and capital behavior focused on short-cycle rolling and strategic trading. Overall, last week's change in funding rates represents a rebalancing after情绪出清, with the market entering a neutral zone without clear trend signals yet.
4.2 BTC Open Interest Surges Then Retreats, Leverage Momentum Weakens
Last week, BTC open interest先上冲后回落, peaking around $23 billion mid-week before quickly retreating to the $21 billion level, with only小幅修复 thereafter and no new highs. The rising phase saw同步放大 in OI, indicating new leverage entry; the subsequent高位回落 saw OI明显下降, indicating一部分仓位被主动平掉或被动清算. The failure to sustain OI at high levels and中断 in leverage expansion aligns with funding rates returning to neutral, suggesting the market is接近震荡中的仓位切换.
4.3 Total Options Open Interest Does Not Expand, Positions Concentrate on Short End
Last week, total options open interest规模未出现明显增长, with limited new capital entry; the market remained dominated by存量仓位调整. Short-end持仓占比有所抬升, while medium-to-long-term (especially monthly and longer-dated)持仓下降, consistent with大幅缩量 in monthly option volumes, indicating institutions are actively reducing medium-term directional exposure in the current phase. Directionally, Put持仓占比 increased notably on the short end, with Skew持续处于负值区间, indicating protective demand is concentrated in near-term expiries. This structure typically corresponds to a combination of short-term防御


