
Gate Institutional Weekly Report: Oil Prices Drop 14%, Uniswap Returns to Top Spot in Spot Trading Volume
- Core View: Over the past week, the cryptocurrency market saw a significant rebound in risk appetite, driven by easing macro geopolitical risks, lower-than-expected inflation data, and stable Federal Reserve policy. Bitcoin's price range shifted upward, institutional capital flowed back substantially via ETFs, and market structure exhibited a trend of concentration towards high-liquidity infrastructure and macro high-volatility assets.
- Key Elements:
- Improved Macro Environment: The US-Iran ceasefire agreement, lower-than-expected core CPI data, and stable interest rate expectations collectively reduced market uncertainty, pushing oil prices down and the VIX index lower, creating conditions for a rebound in risk assets.
- Strong Return of Institutional Capital: Bitcoin spot ETFs recorded net inflows of approximately $833 million for the week, reaching a multi-month high; Ethereum ETFs also saw net inflows, indicating institutional buying has regained market dominance, providing solid support for prices.
- Concentrated On-Chain Capital Structure: DEX trading volume flowed back to leading high-liquidity platforms like Uniswap; stablecoin increments primarily came from USDC; capital prioritized replenishing top staking and lending protocols like Lido and Aave, showing a market preference for efficiency and security.
- Divergence in Derivatives Markets: BTC perpetual contract funding rates remained negative, indicating crowded short positions, yet spot prices rose simultaneously, suggesting potential short-squeeze momentum; the options market showed active short-term speculation, with volatility expectations falling back to pre-conflict levels.
- Trading Logic Shifts to Macro Plays: TradFi (traditional financial asset) trading focus shifted from precious metals to energy assets like crude oil, reflecting a change in market logic from safe-haven allocation to high-volatility trading centered on geopolitics and macro data.
Summary
• The market over the past week was driven by a combination of ceasefire easing, declining inflation, and stable policy. Oil prices fell sharply, the VIX retreated, risk appetite recovered, and BTC's trading range shifted upward to $68K–$73K.
• Capital flows showed strong recovery after severe volatility. BTC ETFs recorded a net inflow of approximately $833 million for the week, hitting a new high for the period. ETH ETFs also saw net inflows, with institutional buying resuming its dominant role.
• Trading structure shifted towards macro high-volatility assets and leading platforms. Funds concentrated on energy commodities like crude oil, while DEX activity returned to high-liquidity platforms like Uniswap.
• Stablecoins and DeFi experienced structural repair, with USDC becoming the primary source of incremental supply. Funds prioritized returning to leading staking protocols and main-chain lending markets.
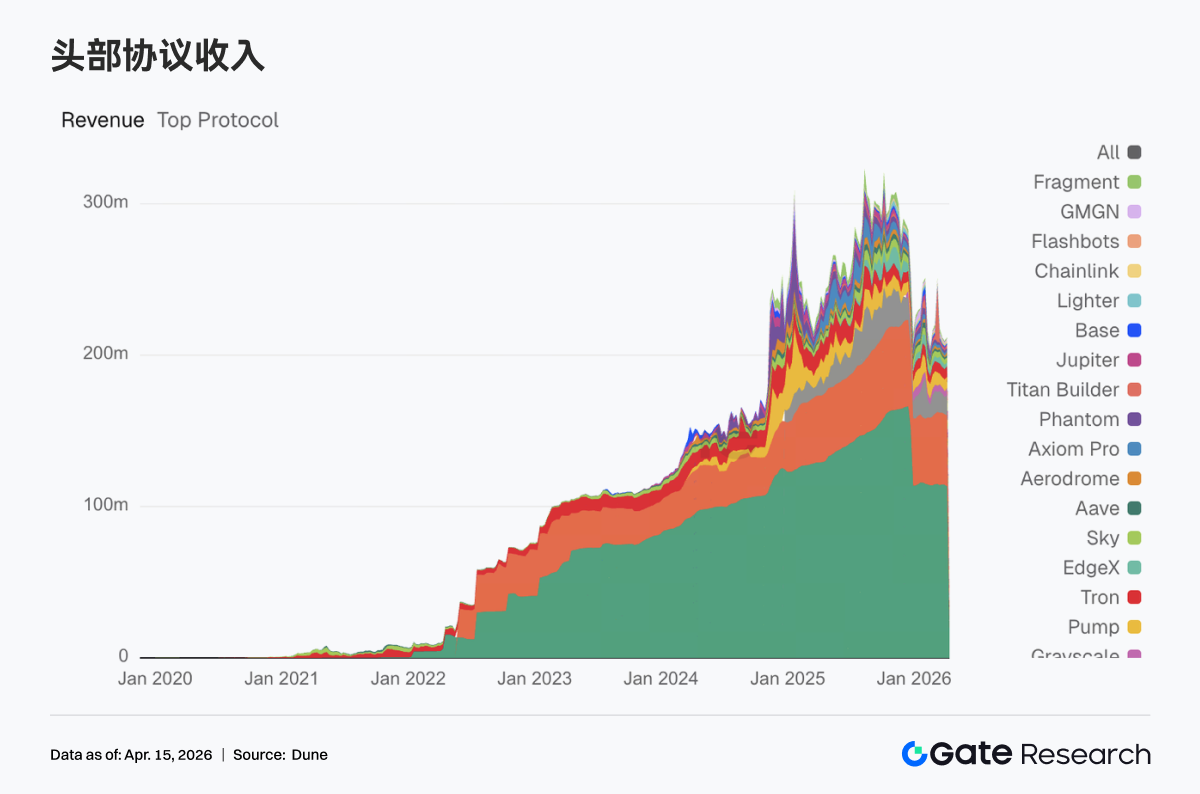
• Protocol revenue reflected a rotation back to the infrastructure layer. Trading and liquidation-focused protocols strengthened, while front-end entry points and traffic distribution platforms saw reduced activity.
• The derivatives market exhibited a divergence where short positions were crowded but prices rose. Funding rates were negative while prices increased, indicating potential short squeeze momentum. Options trading shifted towards short-term speculation and volatility selling strategies.
1. Market Focus Interpretation
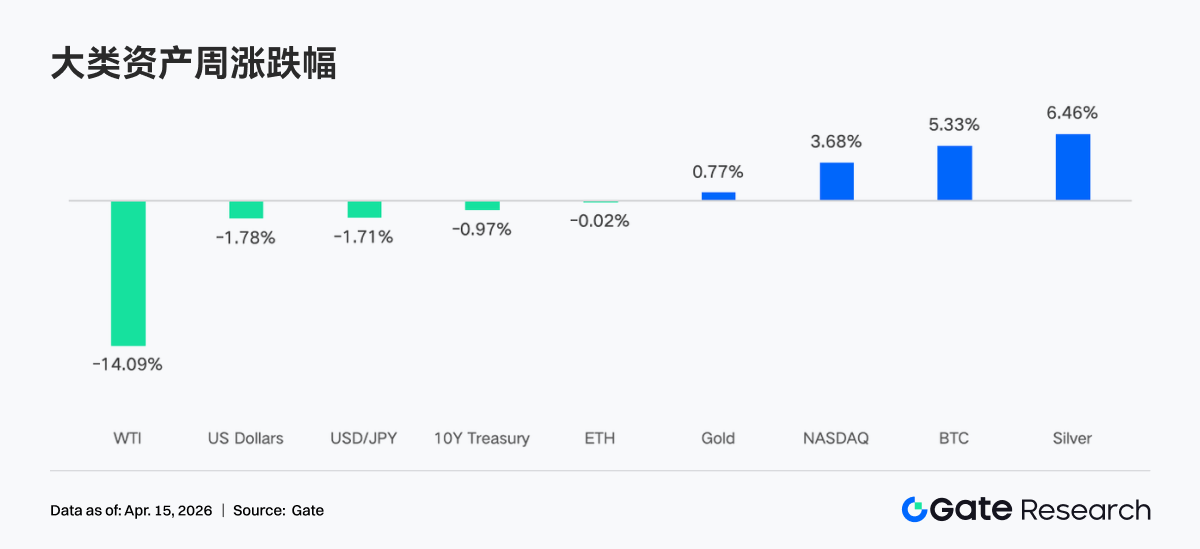
Over the past week, a two-week ceasefire agreement between the US, Iran, and Israel brought a welcome de-escalation to the conflict that had shaken global markets. Following the announcement of the ceasefire last week, markets staged a strong rebound, with stocks and bond prices rising, while oil prices fell by 14% and the VIX index plunged to 19.23, closing below 20 for the first time since early March.
Furthermore, global financial markets, particularly the cryptocurrency sector, were significantly influenced by macroeconomic data and Fed policy expectations. On April 10th, CPI data showed inflation pressure was lower than expected, somewhat alleviating market concerns about more aggressive Fed tightening, which is typically seen as positive for risk assets. The minutes from the Federal Open Market Committee (FOMC) meeting were also released last week, with market forecasts showing a 98.4% probability of maintaining the current interest rate in April. This highly certain expectation of "no change" provided a stable policy environment for the market, reducing short-term uncertainty.
Under the dual effects of easing inflation pressure and stable policy expectations, overall market risk appetite recovered significantly. Institutional interest in cryptocurrencies remained strong, with continued inflows into Bitcoin spot ETFs providing solid bottom support for the market. These macro factors collectively laid the foundation for Bitcoin and Ethereum's performance over the past week, enabling a swift rebound after a brief pullback.
Over the past two weeks, Bitcoin's price range has quietly shifted upward, expanding from $63K–$70K to $68K–$73K. The $73K resistance level remains a key level to watch. Confirmation of the reopening of the Strait of Hormuz could serve as a catalyst for a breakout above this resistance. On the downside, Bitcoin has found support multiple times around $68K–$69K, but each test has led to a narrowing of the support zone. Cryptocurrencies have already priced in expectations of a prolonged conflict and are currently trading near range support, meaning there is room for upside on any positive surprises or de-escalation news, while further deterioration has largely been digested by the market.
2. Liquidity Analysis
2.1 BTC ETFs Record Largest Positive Week in Months
BTC ETF flows showed dramatic intraday swings last week. On April 6th, net inflows reached $471.4 million, the largest single-day inflow since late February. However, over the next two trading days, flows reversed to net outflows of -$159.1M and -$93.9M respectively as geopolitical risks intensified sharply. Weekly net inflows for BTC ETFs were approximately $833.2 million, while Ethereum ETFs saw weekly net inflows of $187.0 million. Compared horizontally, last week's BTC ETF flows showed a significant improvement over the previous week (~$22.3M net inflow), marking the largest positive week in months. Overall sentiment rapidly switched between risk-off and bargain hunting, with bulls ultimately taking the lead.
Top BTC ETF Products by Net Flow:
1. IBIT (BlackRock) Weekly Net Inflow: $612.1M
2. FBTC (Fidelity) Weekly Net Inflow: $151.7M
Top ETH ETF Products by Net Flow:
1. ETHA (BlackRock) Weekly Net Inflow: $168.3M
2. ETHB (BlackRock Staked ETH ETF) Weekly Net Inflow: $66.0M
On April 6th, institutional buying accumulated positions against the trend amid geopolitical uncertainty, driving unexpectedly large inflows. However, as US-Iran negotiations broke down on April 7th and the risk of the Strait of Hormuz closing increased, risk-off sentiment spread rapidly, leading to two consecutive days of capital flight—a mechanical reduction in exposure in response to sudden war risk, not a long-term bearish signal. On the evening of April 8th, President Trump announced a two-week ceasefire agreement between the US and Iran. Oil prices plummeted, liquidity concerns subsided, and institutional buying returned aggressively. Furthermore, the March CPI data released on April 10th showed that while headline inflation rose to 3.3% due to energy, core CPI came in at 2.6% year-on-year, lower than expected, indicating core inflation remains moderate. This further supported the rebound in risk assets, with ETF flows exhibiting characteristics of "accelerated inflows after bad news was priced in."
2.2 TradFi Liquidity
Over the past week, TradFi perpetual trading on DEXs showed significant structural differentiation, with trading focus clearly concentrating on energy assets. The share of WTI crude oil, as a representative, increased substantially, becoming the dominant trading pair. This reflects that amid heightened geopolitical risk and oil price volatility, funds are concentrating on the assets with the strongest macro volatility for directional bets. Concurrently, the share of Brent crude also rose noticeably, further strengthening the dominance of the energy sector. In contrast, the share of traditional safe-haven assets like gold and silver declined, indicating a shift from defensive allocation to higher-beta trading targets. Indices like XYZ100 and individual stocks like NVDA maintained moderate shares, playing more of a supplementary allocation role. Overall, the DEX TradFi trading structure has shifted from a "precious metals-led" to an "energy-driven" model, reflecting that market trading logic has once again moved from safe-haven allocation to high-volatility trading centered on macro variables. This trend aligns with the background of on-chain capital migrating to high-frequency trading pathways.
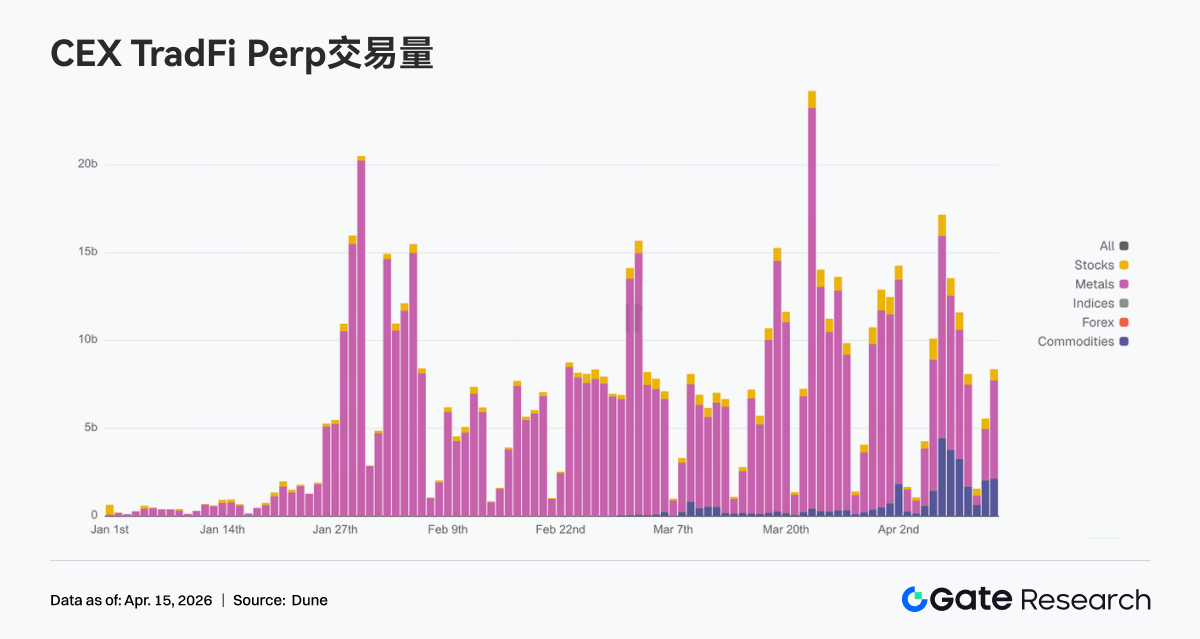
CEX TradFi perpetual contract trading volume remained high overall, oscillating within a range and exhibiting characteristics of "structural concentration + amplified volatility." Specifically, trading volume was still dominated by metal assets, especially gold-related products, which continued to attract participation amid macro uncertainty and fluctuating inflation expectations, becoming the primary source of turnover. Meanwhile, commodities, particularly energy, also saw periodic volume spikes during the week, reflecting rising market demand for trading crude oil and macro events. In terms of rhythm, trading volume notably expanded mid-week, corresponding to catalysts from macro data and geopolitical events. Although it subsequently retreated, the overall level remained above the previous average, indicating sustained high capital activity. Structurally, TradFi trading is gradually expanding from a single safe-haven asset driver to a multi-asset联动 framework of "gold + crude oil + indices," reflecting a user shift from allocation-based trading to strategy trading centered on macro volatility.
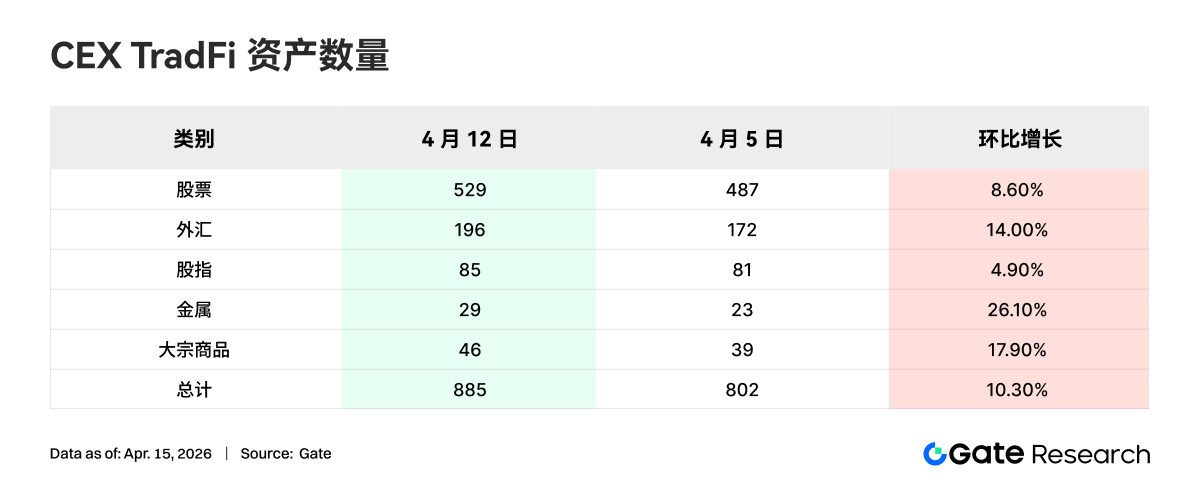
Over the past week, the number of CEX TradFi asset categories further expanded. The total number of TradFi asset categories (counting only the TradFi and CFD sections, excluding perpetual contracts) across three major CEXs increased from 802 to 885, a sequential growth of 10.3%. Metals saw the most significant growth, increasing from 23 to 29 items, up 26.1% sequentially. Commodities ranked second in growth rate, rising from 39 to 46 items, up 17.9% sequentially.
We selected XAUT, which has the highest TradFi trading volume, to analyze its order book depth (Delta). Over the past week, XAUT's order book depth exhibited characteristics of "weak first, then strong, with liquidity gradually repairing." Around April 8th, as the XAUT price rebounded rapidly, positive Delta increased significantly, and buy-side depth strengthened periodically, indicating that funds began actively bidding up and providing liquidity on the ask side. Subsequently, during April 9th–12th, although the price remained in a high-range consolidation, the order book shifted back to being dominated by negative Delta, showing that selling pressure on the ask side still existed, with some divergence in the market at higher levels. Notably, positive Delta rose again over the weekend alongside price strength, suggesting buy-side liquidity regained dominance and market sentiment improved. Overall, XAUT's depth structure reflects that, against the backdrop of rising gold prices, capital experienced a process from defensive withdrawal to redeployment. Short-term liquidity has shown marginal improvement, but there remains some selling pressure at higher levels, warranting attention to the sustainability of subsequent buy-side interest.
3. On-Chain Data Insights
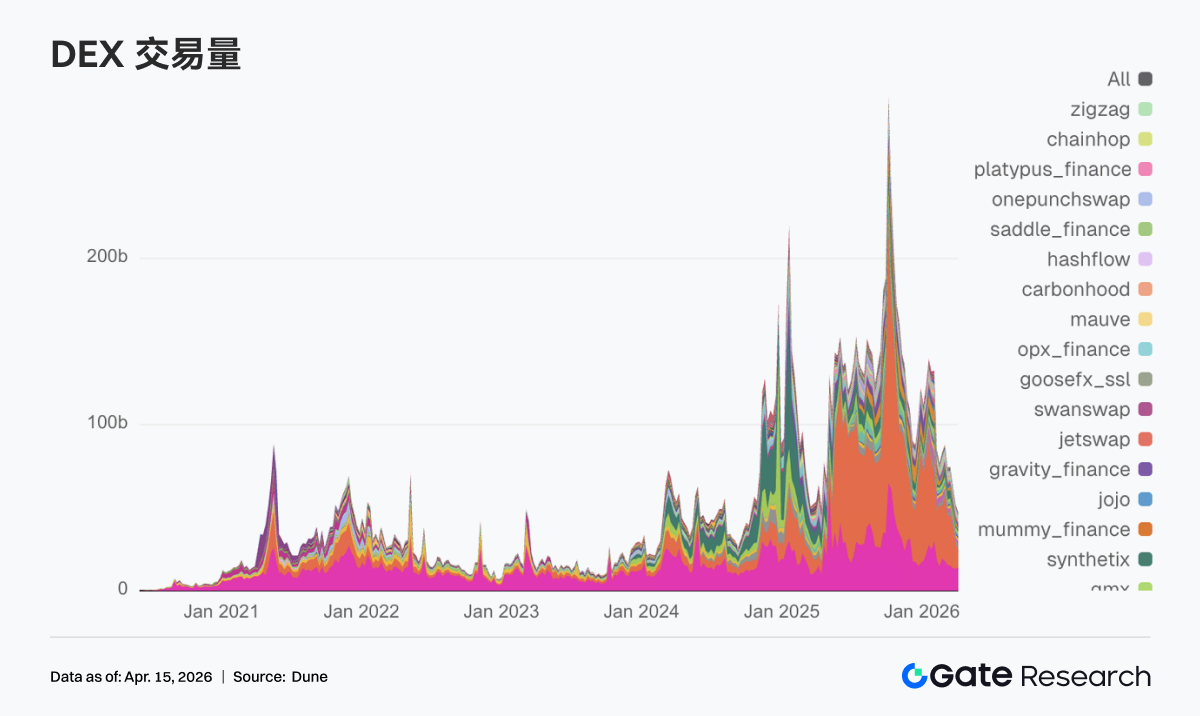
3.1 DEX Trading Focus Returns to Leading EVM Platforms; Uniswap Back on Top
The top spot for DEX trading volume returned to Uniswap, with weekly volume of $13.85 billion, followed closely by PancakeSwap at $10.33 billion. Compared to the previous week, PancakeSwap saw a decline, while Uniswap rose significantly, indicating funds flowing back to the main platforms with deeper liquidity and more mature trading pairs. Additionally, platforms like Aerodrome and Bisonfi on Base and other emerging scenarios absorbed some active capital. On the other hand, Whirlpool, Raydium, and Humidifi all declined, indicating that trading activity within Solana did not spread comprehensively.
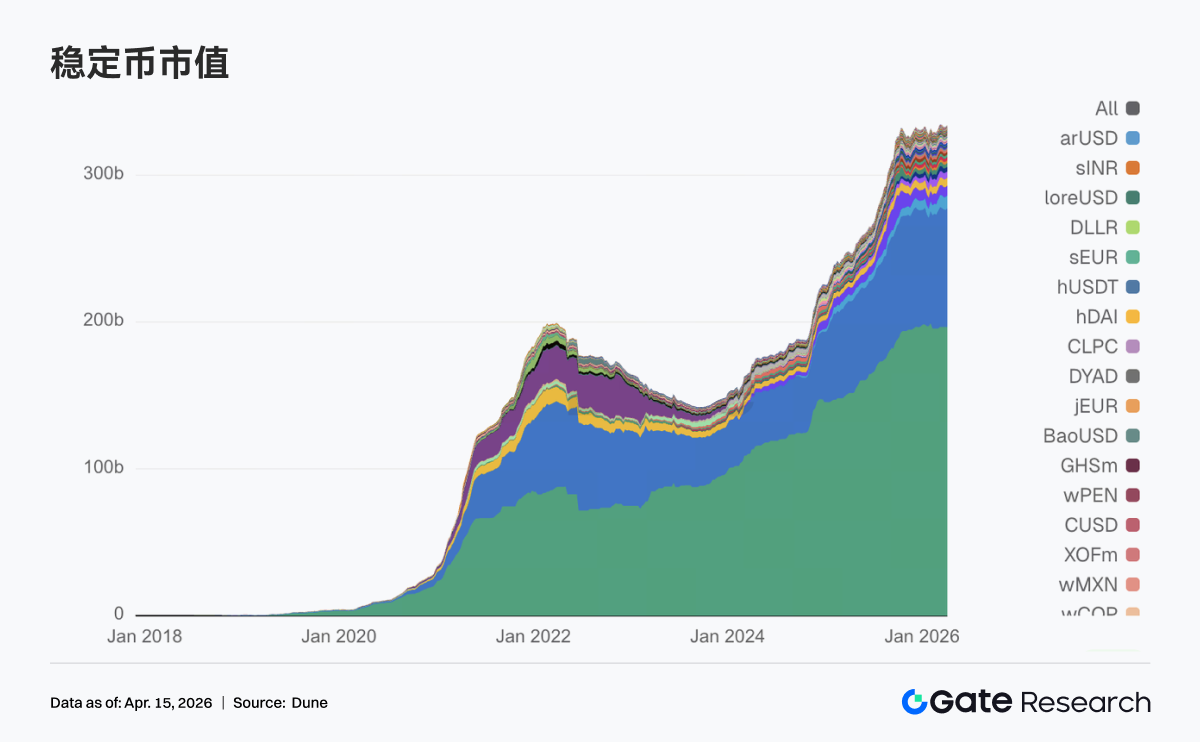
3.2 Stablecoin Supply Remains High; USDC is the Primary Source of Increment
The stablecoin sector did not experience剧烈 volatility this week, undergoing structural adjustments within a high range. USDT showed little change compared to the previous week, with underlying dollar liquidity remaining stable. USDC rebounded from $798.68 billion to $810.49 billion, becoming the clearest source of incremental supply this week, indicating funds are reallocating to mainstream settlement-oriented dollar assets. On the other side, USDS, USDe, DAI, and GHO all saw slight declines, with the decentralized stablecoin sector failing to form a合力 this week. On the margin, USDG and PYUSD both rebounded, indicating ongoing capital分流 within payment-oriented and newly issued stablecoins.
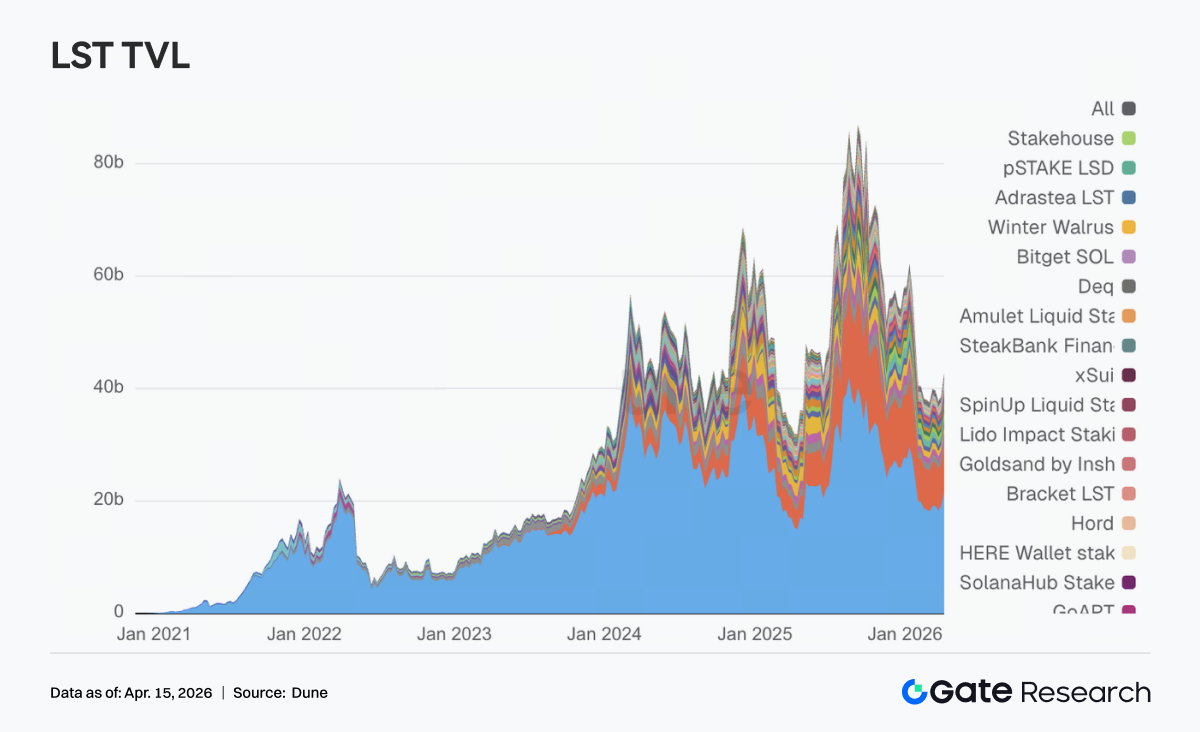
3.3 Liquid Staking Sees Uniform Recovery; Both ETH and SOL Main Lines Increase Positions
Most leading protocols in the liquid staking sector recovered their previous pullbacks this week. On the ETH side, Lido rebounded to over $21 billion, and Rocket Pool also climbed back above $1.3 billion, with leading protocols generally strengthening. The SOL side also saw recovery, with Sanctum Validator LSTs rising to $1.13 billion, and Jito and Jupiter Staked SOL also showing significant increases. This week marked a unified recovery after the回暖 in risk appetite, with funds first replenishing positions in leading protocols. Concurrently, Lido's recent product advancements around EarnETH, EarnUSD, and first-loss protection over the past month continue to refine收益 and risk layering. Such more institutionalized tools help enhance the willingness of large capital to return.
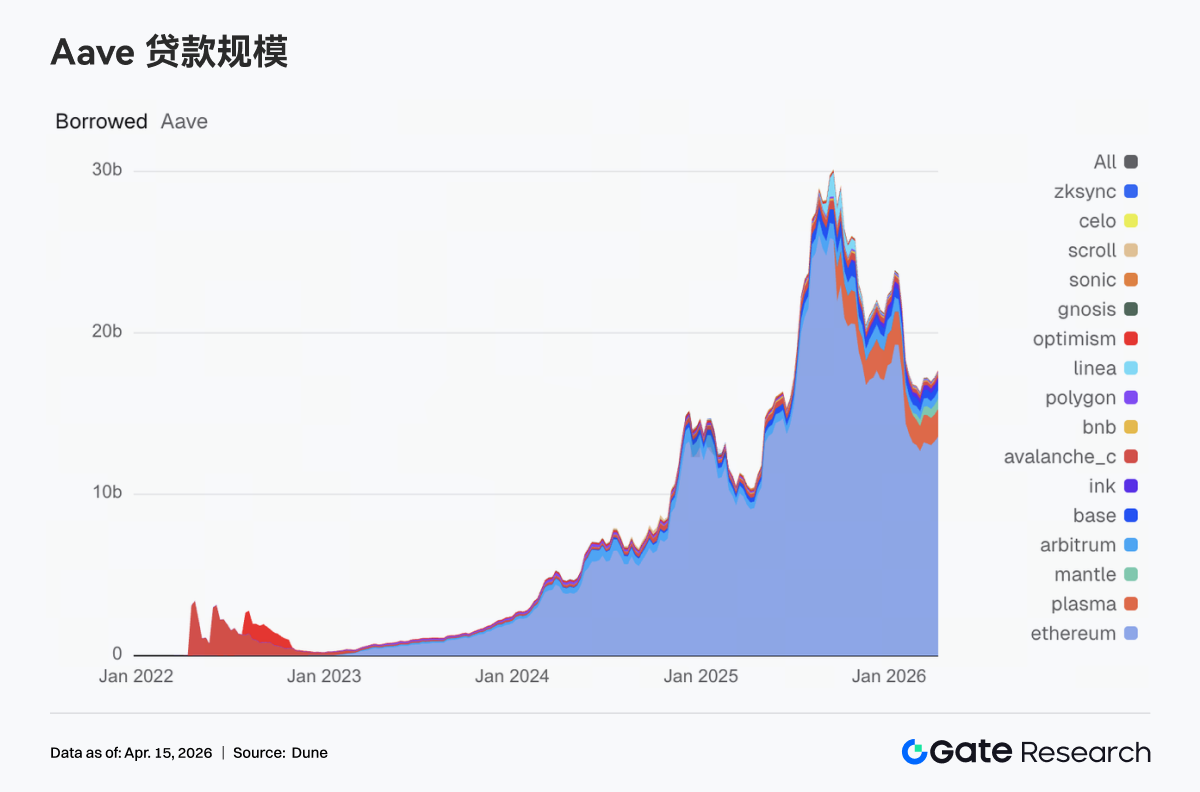
3.4 Aave Borrowing Volume Turns Upward, Driven by Main Market, Mantle, and Plasma
Aave's borrowing volume rose to approximately $17.69 billion, higher than the previous week's $17.25 billion. The Ethereum main market increased from $13.27 billion to $13.57 billion, becoming the core force driving the total. Meanwhile, Plasma grew from $1.66 billion to $1.71 billion, Mantle increased from $590 million to $640 million, and Base and Arbitrum also stood around $517 million, indicating同步回暖 in multi-chain borrowing demand. In contrast, secondary markets like Avalanche, BNB Chain, and Polygon showed little change, with new financing demand still mainly concentrated on the chains with the deepest liquidity and highest transaction efficiency.
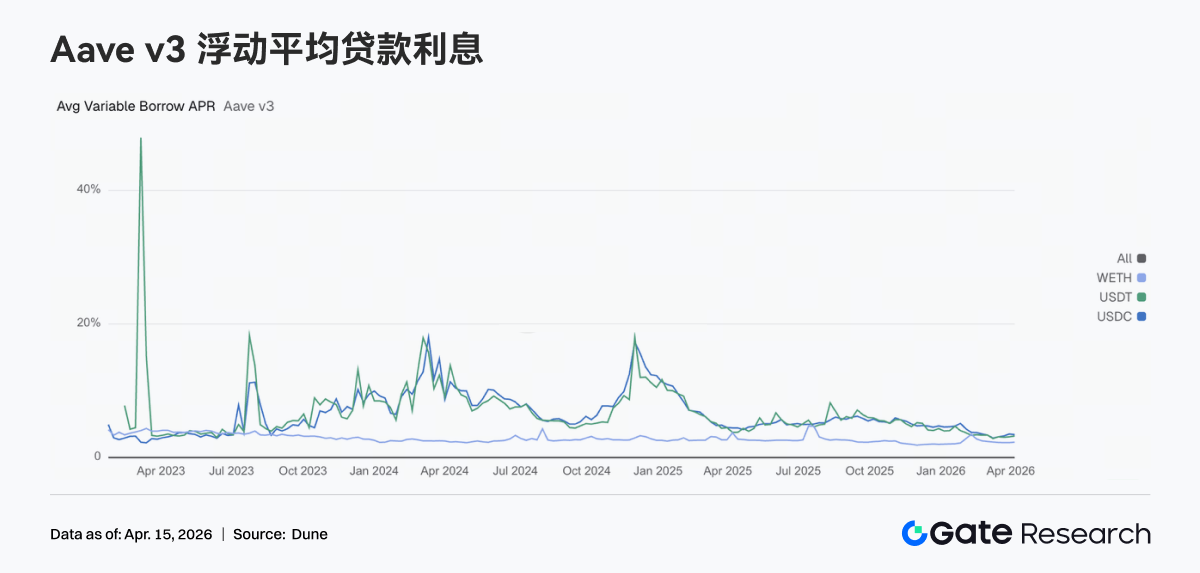
3.5 Aave Funding Rates Diverge; USDC Eases, USDT and WETH Rates Rise
The three core assets on Aave did not move in the same direction. The average floating borrowing APR for USDC decreased from 3.51% to 3.42%, indicating slightly eased funding pressure. In contrast, USDT's rate increased from 3.10% to 3.22%, and WETH's rose from 2.23% to 2.29%, showing borrowing costs tilting towards these two asset types. This combination typically corresponds to a clear trading state: although total borrowing volume is growing, new financing demand is no longer concentrated solely on USDC but has partially returned to USDT周转 and ETH position management. If the upcoming Aave V4 can truly implement risk isolation and cross-market routing, the interest rate differentials between different assets could be further amplified, and this week already shows the初步雏形 of this trend.
3.6 Protocol Revenue Returns to Trading Infrastructure Rotation Rhythm; Hyperliquid Rebounds Significantly
The protocol revenue sector did not see异常峰值 this week. Tether and Circle continued to hold the top two spots, with stablecoin issuance remaining the most稳固的底盘 in the current crypto revenue system. Among trading-focused protocols, Hyperliquid increased from $11.323 million to $13.677 million, Titan Builder jumped from $558,000 to $1.438 million, and Aerodrome grew from $1.113 million to $1.960 million. Capital and trading流量 are reconcentrating on more efficient infrastructure layers.
In contrast, Phantom declined from $1.976 million to $1.332 million, and Jupiter fell from $1.541 million to $928,000, indicating reduced热度 for front-end traffic入口 and distribution layers. Aave's revenue rose to $1.441 million; although not highly弹性, its position remained relatively stable, and the盈利质量 of lending protocols was still明显好于 high-turnover platforms this week. Overall, the signals from the revenue side are clear: the market has not脱离 trading, but funds have flowed back to infrastructure segments with higher成交效率, stronger清算能力, and more stable现金流质量.
4. Derivatives Tracking
4.1 BTC Funding Rate Deeply Negative but Price Strengthens; Open Interest Quickly Rebounds to Stage High
Over the past week, the BTC funding rate remained consistently in negative territory, reaching阶段性极端负值 around April 13th (lowest near -0.015), indicating clear dominance of bearish sentiment and显著提升 in shorting拥挤度 in the perpetual swap market. However, concurrently, the spot price rebounded from around $69K to above $74K, forming a typical divergence structure where prices rise while funding rates are negative. This structure usually means shorts are passively paying funding fees while承受上涨压力, suggesting potential short squeeze动能. Overall, the current market is in a phase dominated by偏空情绪 but driven by现货 or structural buying, making it prone to triggering short covering and accelerated upside during volatility.
BTC's total market open interest (OI) rapidly increased over the past week from around $22.5B to approximately $25.3B,同步反弹 with the price above $74K, indicating明显回流 of leveraged capital. Notably, there was a brief, sharp dip in OI on April 11th (类似集中平仓或挤出), which was quickly repaired followed by a new high. This structure of先去杠杆后再加杠杆 typically意味着弱势仓位被清洗后, new trend capital接力入场. Combined with the持续为负 funding rate, the current OI recovery may be driven by shorting and hedging positions. The market is in a state of高杠杆, directional分歧 but偏空. If prices continue to rise, there remains room for further放大 of short squeezes.


