
Gate Institution Weekly Report: BTC ETF Weekly Inflows Nearly $1 Billion, Aave Hit by KelpDAO Incident
- Core View: Against the backdrop of easing geopolitical conflicts, a crash in oil prices, and stable liquidity expectations, risk appetite in the crypto market has recovered. BTC and ETH ETFs recorded strong net inflows, but security incidents triggered deleveraging in lending protocols like Aave, resulting in a divergent market pattern of "crowded shorts but strengthening prices."
- Key Factors:
- Market liquidity warmed, with BTC ETFs recording net inflows of approximately $996 million for the week, the largest single-week net inflow since mid-January. BlackRock's IBIT dominated with $906 million in inflows.
- Trading structure exhibited an "energy-dominated" characteristic, with crude oil products maintaining a high share on the TradFi side; BNB Chain Meme coin activity drove PancakeSwap's trading volume to double, reaching $21 billion.
- The KelpDAO rsETH security incident triggered a chain reaction, causing Aave's total loan balance to drop significantly, with borrowing rates for USDC and WETH surging over twofold.
- The LST sector performed steadily. Capital did not flee in panic due to the KelpDAO incident but instead concentrated on leading protocols like Lido and Rocket Pool.
- Contradictions in the derivatives market intensified. BTC's funding rate remained deeply negative, but prices oscillated upwards to around $76K, indicating crowded shorts and accumulating short-squeeze momentum.
- The implied volatility curve for BTC options quickly repaired, with the short end showing an inversion at one point, indicating significantly elevated market pricing for short-term volatility.
Executive Summary
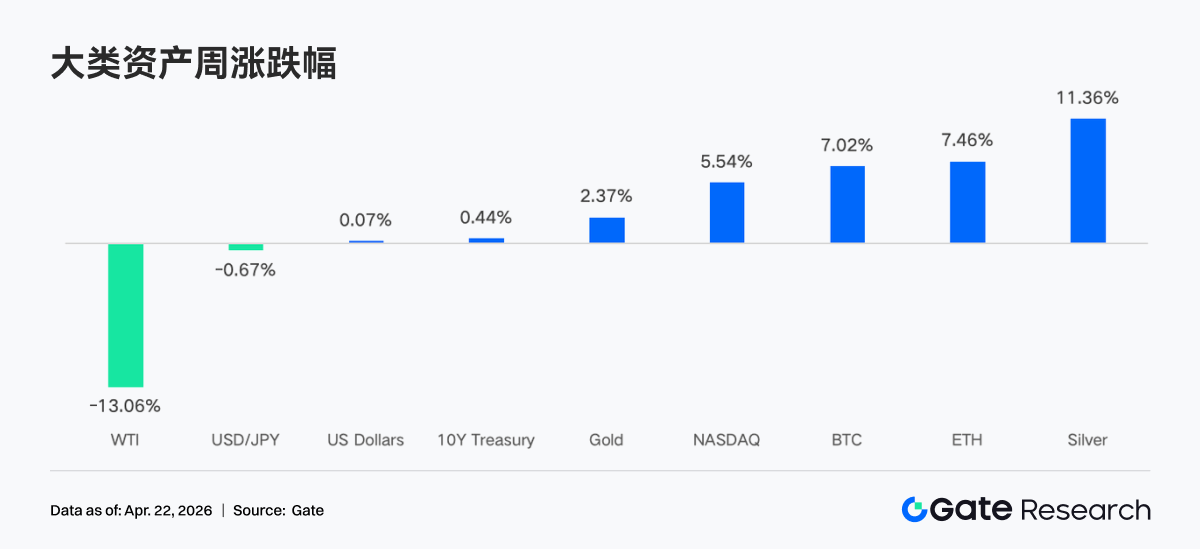
• Over the past week, markets have trended upward amidst easing geopolitical tensions and stable liquidity expectations. A sharp drop in oil prices, a retreat in the VIX, and a weakening US dollar collectively drove a recovery in risk appetite, with crypto assets rebounding and returning to an upward trajectory.
• Capital inflows have notably warmed, with both BTC and ETH ETFs recording strong net inflows. Institutional funds have re-concentrated in top-tier products, with preferences shifting towards lower-fee, high-liquidity assets.
• The trading structure exhibits an "energy-dominated, with diverging on-chain activity" characteristic. On the TradFi side, commodities like crude oil maintained a high share, while DEX trading volumes saw a significant recovery.
• A rebalancing is occurring within the stablecoin and DeFi sectors, with capital retreating from yield-bearing and protocol-linked stablecoins, while LST protocols have attracted capital inflows.
• Security incidents triggered a chain reaction, leading to deleveraging and surging interest rates in lending protocols like Aave.
• The derivatives market continues its pattern of "crowded shorts amidst price strength." The deeply negative funding rate paired with rising prices forms a divergence, accumulating momentum for a short squeeze.
1. Market Focus
The global cryptocurrency market exhibited a volatile trend amid complex and intertwined macroeconomic signals. Trade war tensions eased on Friday, only for efforts to reverse the situation the following Saturday. Iranian Foreign Minister Araghchi announced that the Strait of Hormuz is "fully open" for all merchant vessels during the ceasefire between Israel and Lebanon. Trump quickly confirmed the Strait was "fully open, ready for transit." Oil prices plummeted 10% thanks to market optimism over a Middle East peace deal. The crypto market rebounded, and ETFs continued to see net inflows. US stocks rallied from their lows to record highs, with the S&P 500 rising 11% in 11 trading days from its March 30 low, reaching a new all-time high of $7,162 last Friday. The VIX index plummeted to 17.48, its lowest level since late February, indicating a substantial market repricing of war risk. The 10-year Treasury yield closed around 4.28%, down from the April high of 4.44%. The US dollar index fell below 98 for the first time since January.
According to the IMF's World Economic Outlook released on April 16, 2026, global growth forecasts were downgraded to 3.1% due to ongoing conflicts in the Middle East and the transmission of geopolitical risks, a backdrop that dampened overall liquidity expectations for risk assets. The Fed's actions remain the core market driver. Currently, the market has largely priced in a 98% probability that the Fed will hold rates steady at its April 29 FOMC meeting. Furthermore, the confirmation hearing for Fed Chair nominee Warsh is scheduled for April 21st. His hawkish or dovish policy leanings will directly impact market liquidity in the coming weeks.
2. Liquidity Analysis
2.1 BTC ETF Records Its Largest Positive Week in Months
Last week, the intraday trends of BTC ETFs experienced sharp volatility, with strong net inflows on April 14 and 15, reaching $411.4 million and $186.1 million respectively. On April 17, amid a mix of risk-off and bargain-hunting sentiment, a remarkable single-day net inflow of $663.9 million was recorded. BTC ETFs saw weekly net inflows of approximately $996.4 million, while Ethereum ETFs recorded weekly net inflows of $275.8 million. Horizontally, BTC ETF flows showed significant improvement compared to the previous week, marking their largest positive week since mid-January. Overall sentiment rapidly switched between risk-off and bargain-hunting, ultimately with bulls dominating.
Top BTC ETF net flow products:
1. IBIT (BlackRock) – Weekly net inflow: $906.0 million
2. ARKB (Ark & 21Shares) – Weekly net inflow: $98.5 million
Top ETH ETF net flow products:
1. FETH (Fidelity) – Weekly net inflow: $126.0 million
2. ETHA (BlackRock) – Weekly net inflow: $99.2 million
Institutional funds showed a clear trend towards concentration last week. BlackRock's IBIT remained the primary capital magnet, raking in $906.0 million in a single week, bringing its cumulative net inflows close to $64.63 billion. In contrast, Fidelity's FBTC experienced net outflows of $104.0 million, revealing capital competition between different institutional products. On the Ethereum side, Fidelity's FETH performed strongly, leading with $126.0 million in net inflows, while Grayscale's ETHE continued to face net outflow pressure of $16.67 million. This divergence suggests that institutional investors are increasingly prioritizing fee structures and liquidity depth when selecting products.
The total Assets Under Management (AUM) for Bitcoin ETFs has now strongly broken through the $101.45 billion mark, with ETF net assets representing 6.55% of Bitcoin's total market cap. For spot Ethereum ETFs, total net asset value reached $14.26 billion, representing 4.87% of Ethereum's total market cap.
2.2 TradFi Liquidity
Over the past week, TradFi Perp DEX trading structure noticeably tilted towards crude oil varieties. The share of CL and Brent remained high but slightly declined from earlier periods, still dominating the market. Meanwhile, WTI saw a slight recovery, keeping the energy sector strong overall. In precious metals, the share of gold and silver recovered somewhat but remained below recent highs, suggesting marginally weakening safe-haven demand. Equity indices and forex shares remained relatively stable, presenting a market pattern of "energy dominance, with other assets providing balanced supplementary roles."
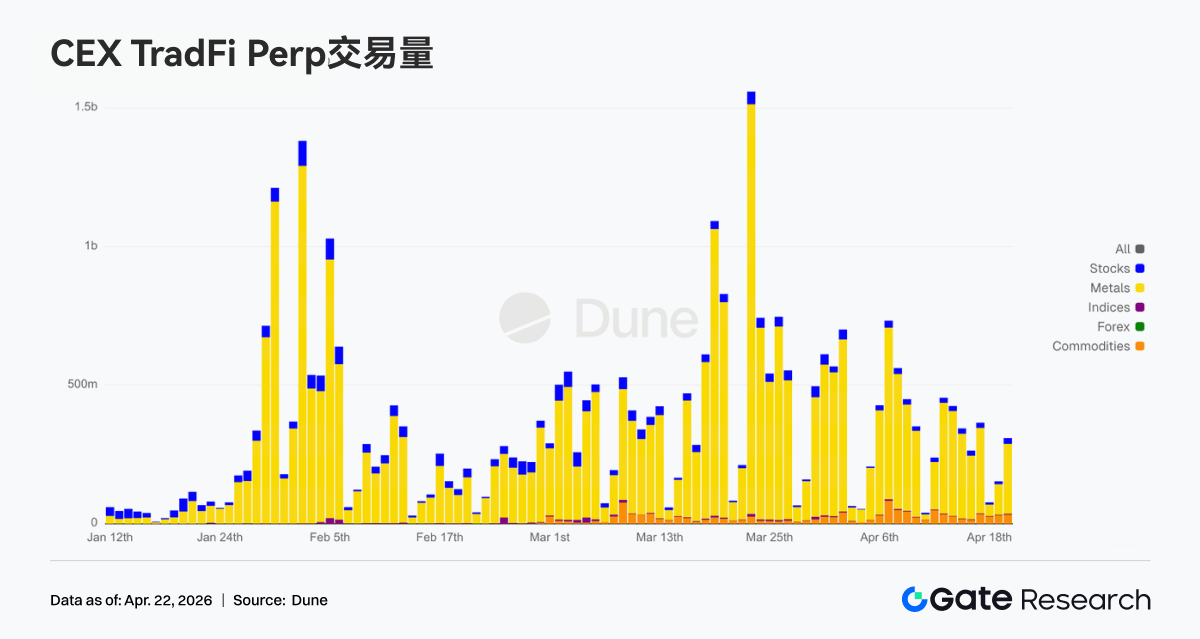
Over the past week, CEX TradFi perpetual daily trading volumes mostly ranged between $250 million and $450 million. This is a notable decline from the early April peak of around $750 million, representing consolidation at lower volumes after high-level volatility. Structurally, metals remain the absolute mainstay, with equities as the secondary contributor. Commodities' share has modestly risen since late March, while equity indices and forex volumes remain small. The period ended with a single-day rebound to approximately $450 million, indicating that after volatility contraction, capital is still focused on rotation within sectors like metals. TradFi heat is gradually returning to a normal trading rhythm from extreme volume expansion.
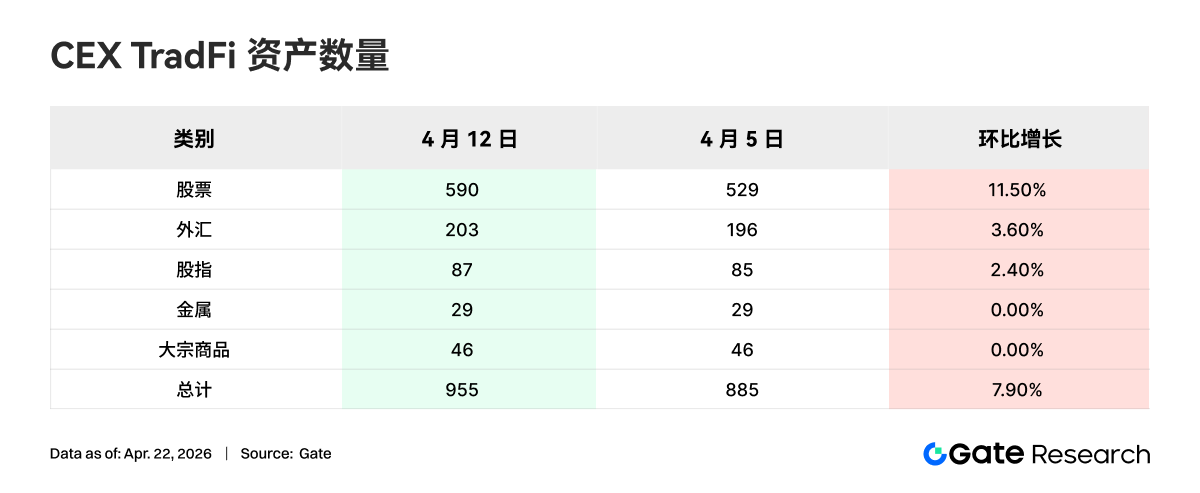
Over the past week, the number of TradFi asset classes on CEXs expanded further. The total number of TradFi asset classes (statistics only for the TradFi and CFD sections, excluding perpetual contracts) across three major CEXs increased from 885 to 955, a 7.9% sequential growth. Equities saw the most significant increase, rising from 529 to 590, a sequential growth of 11.5%. Within this, Gate's equity TradFi offering increased by 16, representing a sequential growth of 6.5%.
We selected XAUT, the TradFi asset with the highest trading volume, and analyzed its order book depth (Delta). Over the past week, the order book depth for XAUT spot within a ±1% spread showed a transition from sell-side dominance to thickening buy-side support: during the price decline and consolidation phase in early-to-mid April, liquidity Delta was significantly negative multiple times, with sell orders accumulating more heavily near the current price. As the price rebounded from around $4,640 and consolidated at higher levels in the $4,780–$4,820 range, Delta turned predominantly positive. Particularly towards the end of the period, a positive spike approaching approximately $900,000 occurred, indicating a relative increase in near-end bid depth.
3. On-Chain Data Insights
3.1 BNB Chain Meme Activity Surges, PancakeSwap Volume Doubles
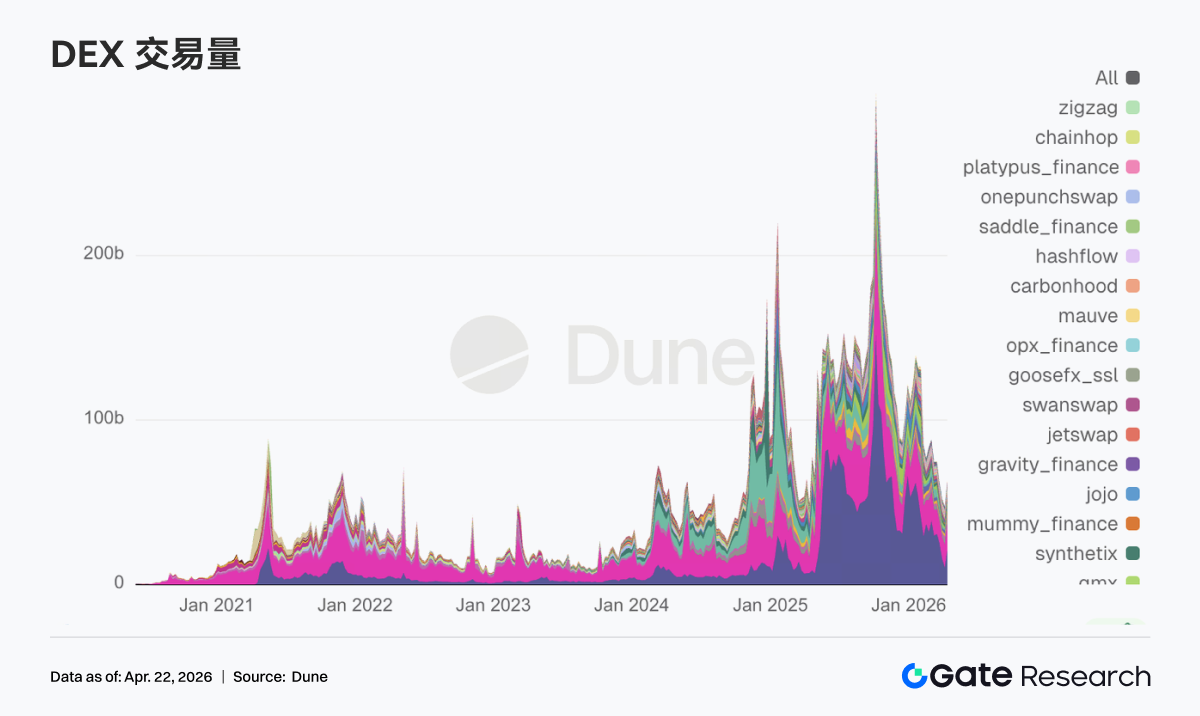
Represented by projects like "币安人生" (Binance Life), the trading heat and market cap of BNB Chain Meme tokens rose significantly. PancakeSwap's weekly trading volume surged to $21 billion, nearly doubling from the previous week, reclaiming the top spot in DEX trading volume. Simultaneously, trading volumes in major DEX pools like Uniswap, Aerodrome, Curve, and Fluid also increased to varying degrees. While trading demand persists within Solana and short-term speculation hasn't faded, the preferred network for active Meme capital is now BNB Chain, given its deeper connection with the exchange.
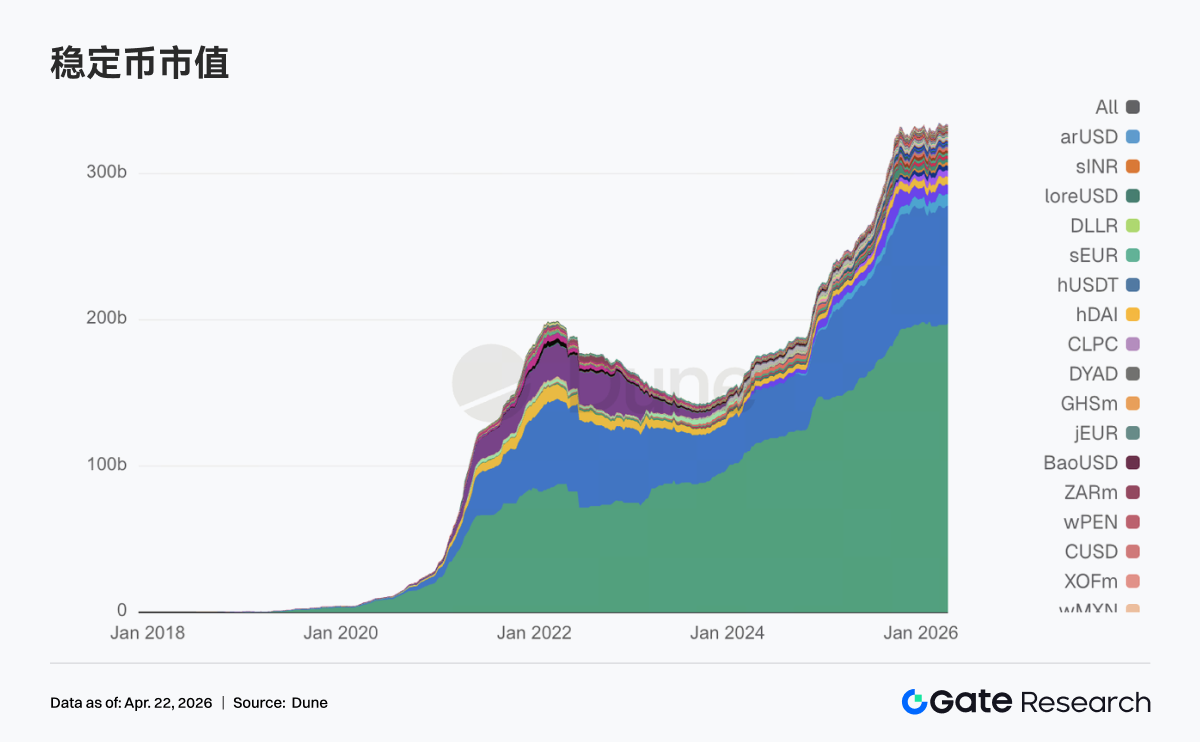
3.2 Stablecoin Sector Fluctuates at Highs; Funds Exit Yield-Bearing and Protocol Tokens
The overall stablecoin supply did not contract sharply, but internal rotation was significant. Stablecoins that attracted capital via yields in the previous phase generally saw reductions this week. USDT increased by approximately $1.02 billion compared to the previous week. USDC, however, saw a slight decline, not following USDT's expansion. Possibly influenced by recent frequent security incidents, the pullback within the native DeFi sector was pronounced. USDS decreased from $8.56 billion to $7.80 billion, USDe dropped from $6.70 billion to $6.41 billion, and DAI also saw a slight decline. However, payment-oriented and institutional-grade stablecoins were unaffected, with PYUSD and USDG both seeing modest growth.
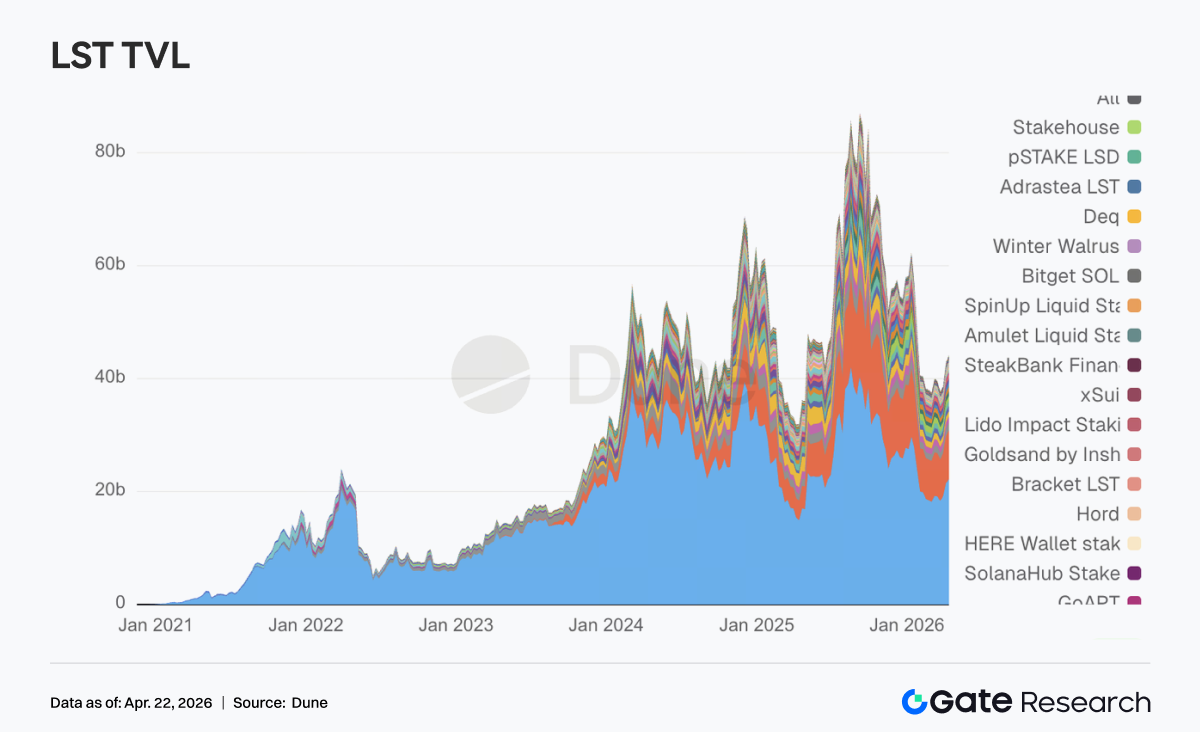
3.3 LST Sector Unshaken by rsETH Incident; Funds Consolidate Towards Top Protocols
Despite the weekend security incident involving the LRT protocol KelpDAO's rsETH, which saw nearly $300 million in funds at risk, the LST sector proved more resilient than expected. Most top-tier protocols actually moved higher. Leading ETH-side LSTs like Lido and Rocket Pool saw hundreds of millions or tens of millions of dollars in capital inflows respectively. On the SOL side, Sanctum Validator LSTs and Jupiter Staked SOL both grew, with only Jito experiencing a slight decline. This reflects a more mature market of DeFi participants, who have not panicked excessively but instead priced standardized staking assets separately from assets involving cross-chain bridges, cross-chain wraps, or restaking leverage. The issue with KelpDAO was within the risk chain combining a LRT (like rsETH) with a cross-chain bridge. Traditional ETH LSTs and mainstream SOL LSTs were not lumped together as high-risk assets; in fact, they absorbed some of the capital rotation.
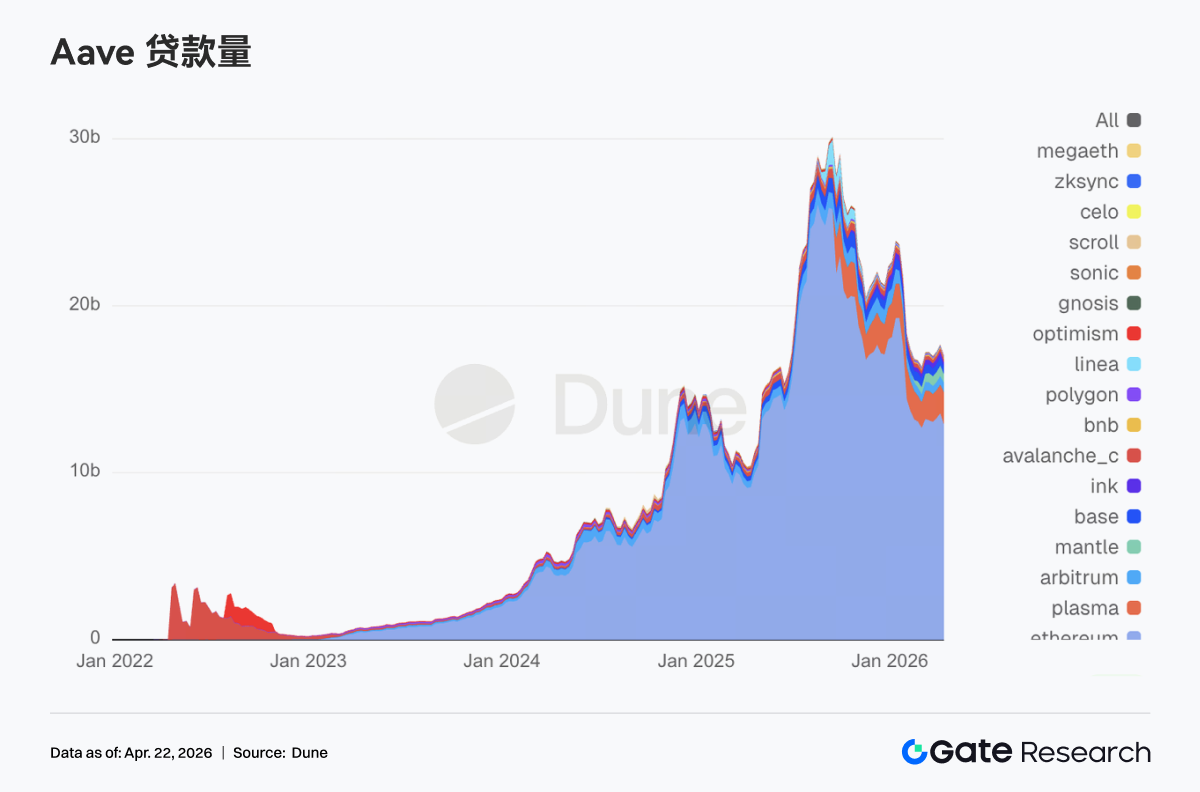
3.4 KelpDAO Event Significantly Impacts Aave; Lending Capital Exits Main Markets
Aave's total loan balance saw a notable decline, ending its steady upward trend. Several core networks, including the Ethereum main market, Mantle, and Base, experienced deleveraging amounting to hundreds of millions of dollars in their lending scenarios. Over the weekend, Aave froze rsETH collateral and implemented protective restrictions on WETH across Core, Prime, Arbitrum, Base, Mantle, and Linea. Although the Aave contracts themselves were not breached and the problem originated from KelpDAO's rsETH cross-chain bridge, Aave, as the largest lending pool, bore the most direct chain reaction. The potential bad debt from hackers extracting hundreds of millions of dollars using rsETH as collateral further fueled market concern. For this reason, the V4 Hub-and-Spoke risk isolation framework previously promoted by Aave Labs suddenly transitioned from an architectural upgrade to a tangible market demand for repricing risk.
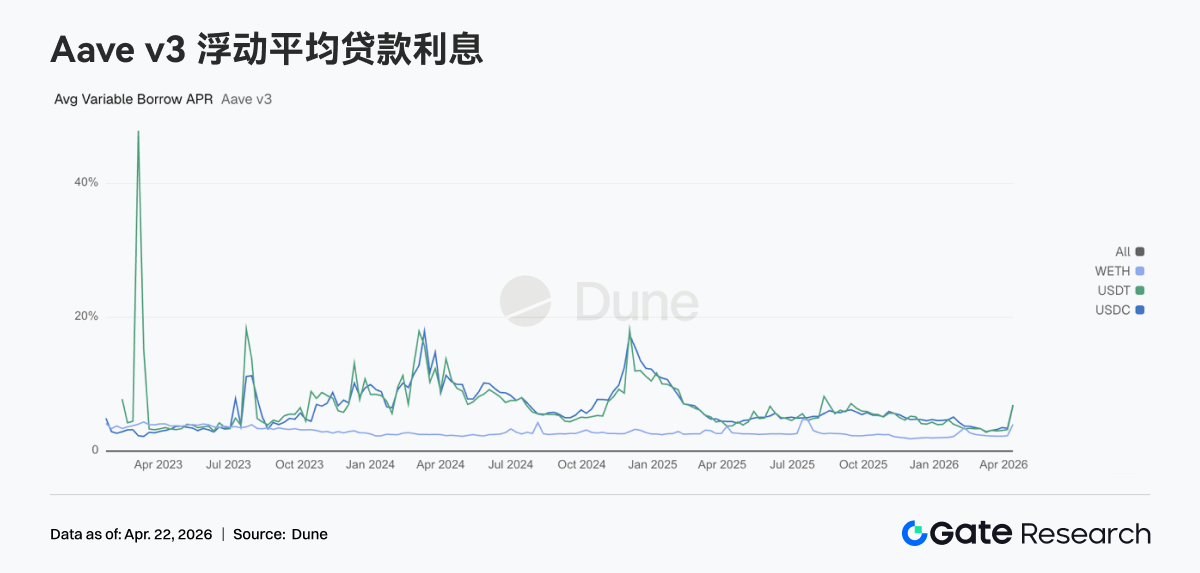
3.5 Security Event Shockwave: Lending Rates for Aave's Three Core Assets Jump
The impact on interest rates vividly demonstrated the instantaneous tension at the moment of the shock. The average variable borrowing APR for USDC jumped directly from 3.42% to 6.91%, for USDT from 3.22% to 6.76%, and for WETH from 2.29% to 4.00%. Following the rsETH incident, Aave faced potential bad debt and market panic spread. Liquidity and capital were quickly withdrawn from Aave. The available depth in WETH and stablecoin pools on the main market thinned dramatically, with utilization briefly hitting 100%, leaving virtually no liquidity. The Aave risk team subsequently made emergency adjustments to the WETH interest rate models on Arbitrum, Base, Mantle, and Linea, compressing the borrowing cost at full utilization from 8.5%–10.5% down to 3%. This inversely confirms the severe liquidity tightness in the pools at the time. This week's rate spike perfectly illustrates the complete projection of an external black swan event penetrating through to Aave's capital interest rates.
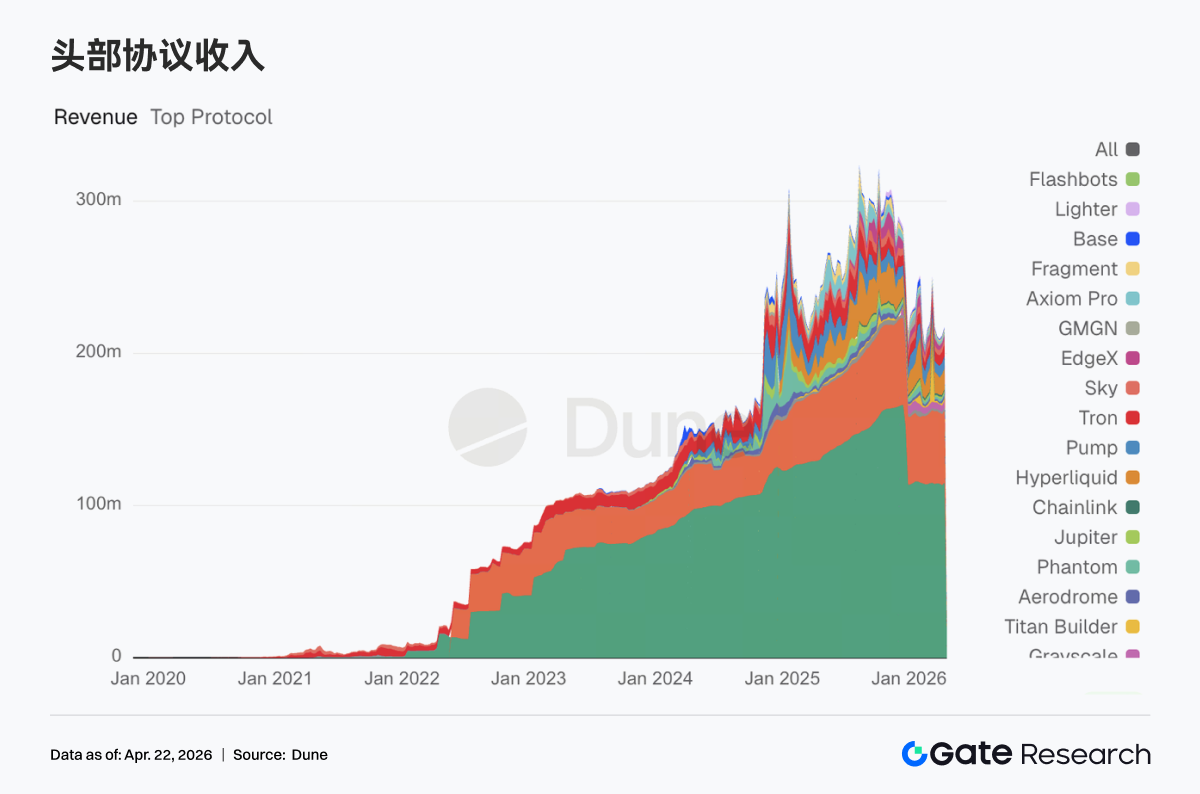
3.6 Top Protocols Show Stable Revenues; Aave Displays Clear Stress-derived Earnings
Tether and Circle maintain their first and second positions; stablecoin issuers represent the most stable source of cash flow. Hyperliquid and Pump's revenues remained near the high levels of the prior week, indicating resilience in on-chain trading activity. Aave's weekly revenue reached $2.02 million, showing a significant increase from the previous week. However, this represents stress-derived earnings from squeezed liquidity, with limited sustainability. Protocols like Aerodrome and Titan Builder, generating weekly revenues in the millions of dollars, also grew, confirming that market capital hasn't left the trading sphere.
4. Derivatives Tracking
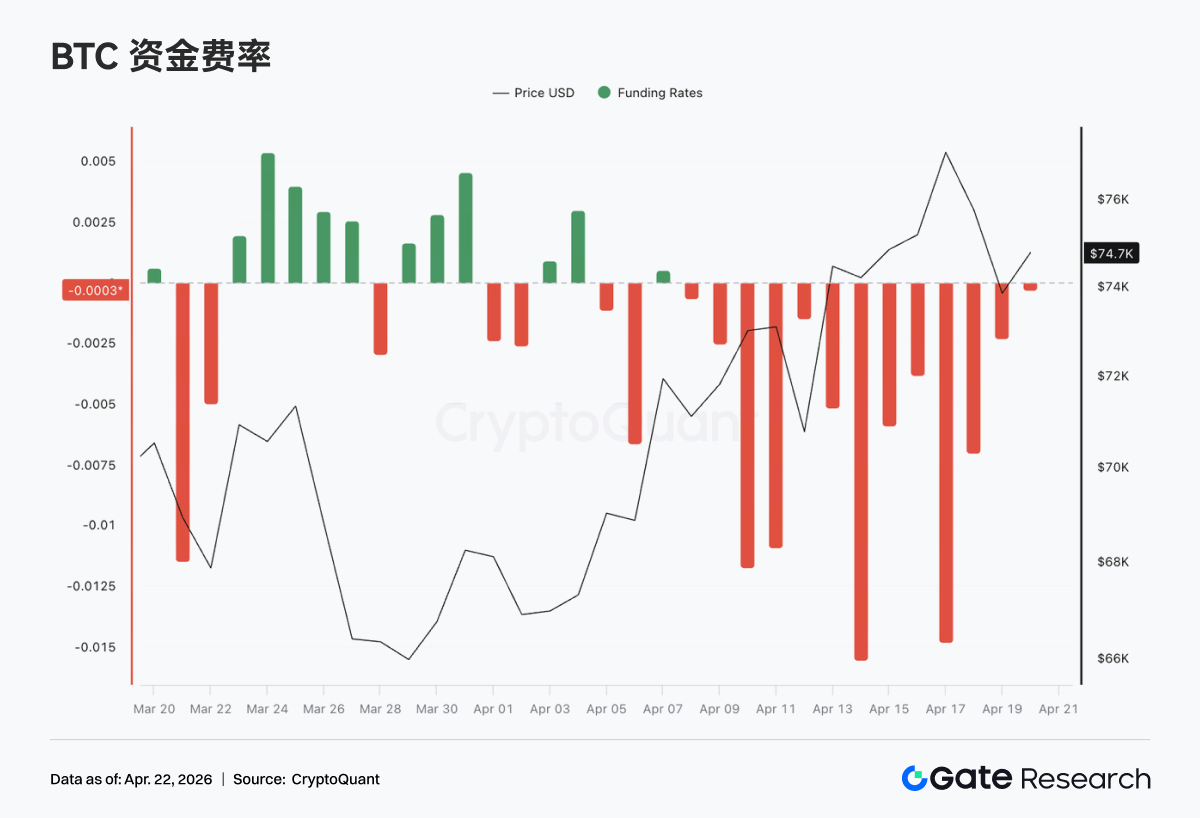
4.1 BTC Funding Rate Remains Deeply Negative; Price Oscillates Upwards, Making New Highs
Over the past week, the BTC funding rate remained consistently in negative territory, with multiple episodes of extreme negativity around mid-April (lowest near -0.015). This indicates persistently bearish sentiment in the perpetual contract market and high short-side crowding. Correspondingly, after an earlier pullback, the price oscillated upwards from around the 70K level, briefly spiking to near 76K. This presents a classic divergence pattern: "deeply negative funding rate coupled with continued price strength." This structure implies that shorts are continuously paying funding fees while facing upward price pressure, accumulating short-squeeze momentum. The price increase is primarily driven by spot buying or passive short covering.
From a rhythm perspective, after April 10, the funding rate clearly shifted into a deeper negative range while the price accelerated its upward move, making new periodic highs. This suggests that during the price breakout, shorts did not significantly exit their positions but instead may have added to them against the trend, further strengthening the potential elasticity for a squeeze. Overall, the market is in a phase where bearish sentiment dominates derivatives, yet price performance is robust, with spot or structural buying providing support. Under this high-divergence structure, if the price maintains its high level or moves higher, short covering could accelerate the trend. However, the sustained high level of negative funding rates also implies that if the price does retrace, leveraged shorts will have some buffer, potentially leading to amplified short-term volatility.
4.2 BTC Options Structure Recovers Quickly; Short-End Volatility Strengthens, Flattens Curve
Between April 13 and April 19, BTC's implied volatility across various tenors generally rose, with the structure gradually recovering from a previously steep contango state. Specifically, short-to-medium term IVs like 7D, 30D, and 60D were still at cyclical lows (around -6 to -8) near April 13, but then rose rapidly, collectively moving to around -3 to -4 by April 17. Volatility elasticity increased significantly. In contrast, long-end IVs (e.g., 90D, 180D) saw relatively limited increases. The overall IV curve exhibited a clear "flattening" characteristic, indicating a significant repricing of near-term volatility expectations.
From a structural perspective, around April 17, the short-end IV briefly became higher than mid-to-long term IVs, creating a temporary inversion. This reflected rapidly heating market expectations for short-term event-driven price movements or volatility. Such a sharp increase in short-end IV usually corresponds to an accelerated market phase or concentrated release of uncertainty, manifesting in trading as a chase for gamma


