
How much longer until the crypto bear market ends?
- Key Takeaway: The Coinbase Bitcoin Premium Index has been negative for 46 consecutive days, setting a new all-time record. Combined with the sustained decline in BTC and ETH prices and the loss of key support levels, the current bear market cycle is confirmed and has yet to bottom out, likely persisting for at least another 2-3 months.
- Key Factors:
- Coinbase Premium Index has been negative for 46 consecutive days since May 19, surpassing the previous record of 40 days set in January, reflecting persistently weak demand in the U.S. market.
- Strategy's sale of 32 BTC in early June triggered market panic, coupled with consecutive net outflows from Bitcoin spot ETFs, serving as the direct catalyst for the recent crash.
- BTC fell over 16% in the first week of June, dropping below $60,000 and the 200-week moving average, marking its worst weekly performance since the FTX collapse in 2022.
- Losses among long-term holders hit a new high, with 10.83 million BTC in a loss position. ETH whales are at an overall loss for the first time since 2019.
- Previous bottom predictions by multiple institutions (e.g., CryptoQuant's $53,600, BIT's August end date) have been invalidated by subsequent declines, further dampening market sentiment.
- STRC preferred shares briefly fell to $73, a historic low, before Strategy stabilized the situation through a buyback plan. However, the price reverting to the $100 anchor remains one of the key indicators for the bear market's end.
- Analysts are significantly divided. Yi Lihua predicts a bottom in July-August (BTC at $43,000 - $51,000), while Jiang Zhuoer predicts a bottom in October-December ($42,000 - $44,000). Late September to early October is viewed as a critical rebound window.
Original|Odaily(@OdailyChina)
Author|Wenser(@wenser 2010)
According to Coinglass data, from May 19 to today (July 3), the Coinbase Bitcoin Premium Index has remained in "negative" territory for 46 consecutive days, setting a new record for the "longest negative streak." Previously, the index posted a negative premium for 40 consecutive days from January 16 to February 24 this year, which was the longest such streak since the indicator's launch, surpassing the approximately 30-day consecutive negative premium during last year's "October 11 crash."
Given that BTC and ETH have briefly fallen below key support levels such as $58,000 and $1,600, the exact timeline for the end of the bear market remains unclear, making the wait particularly painful for many.
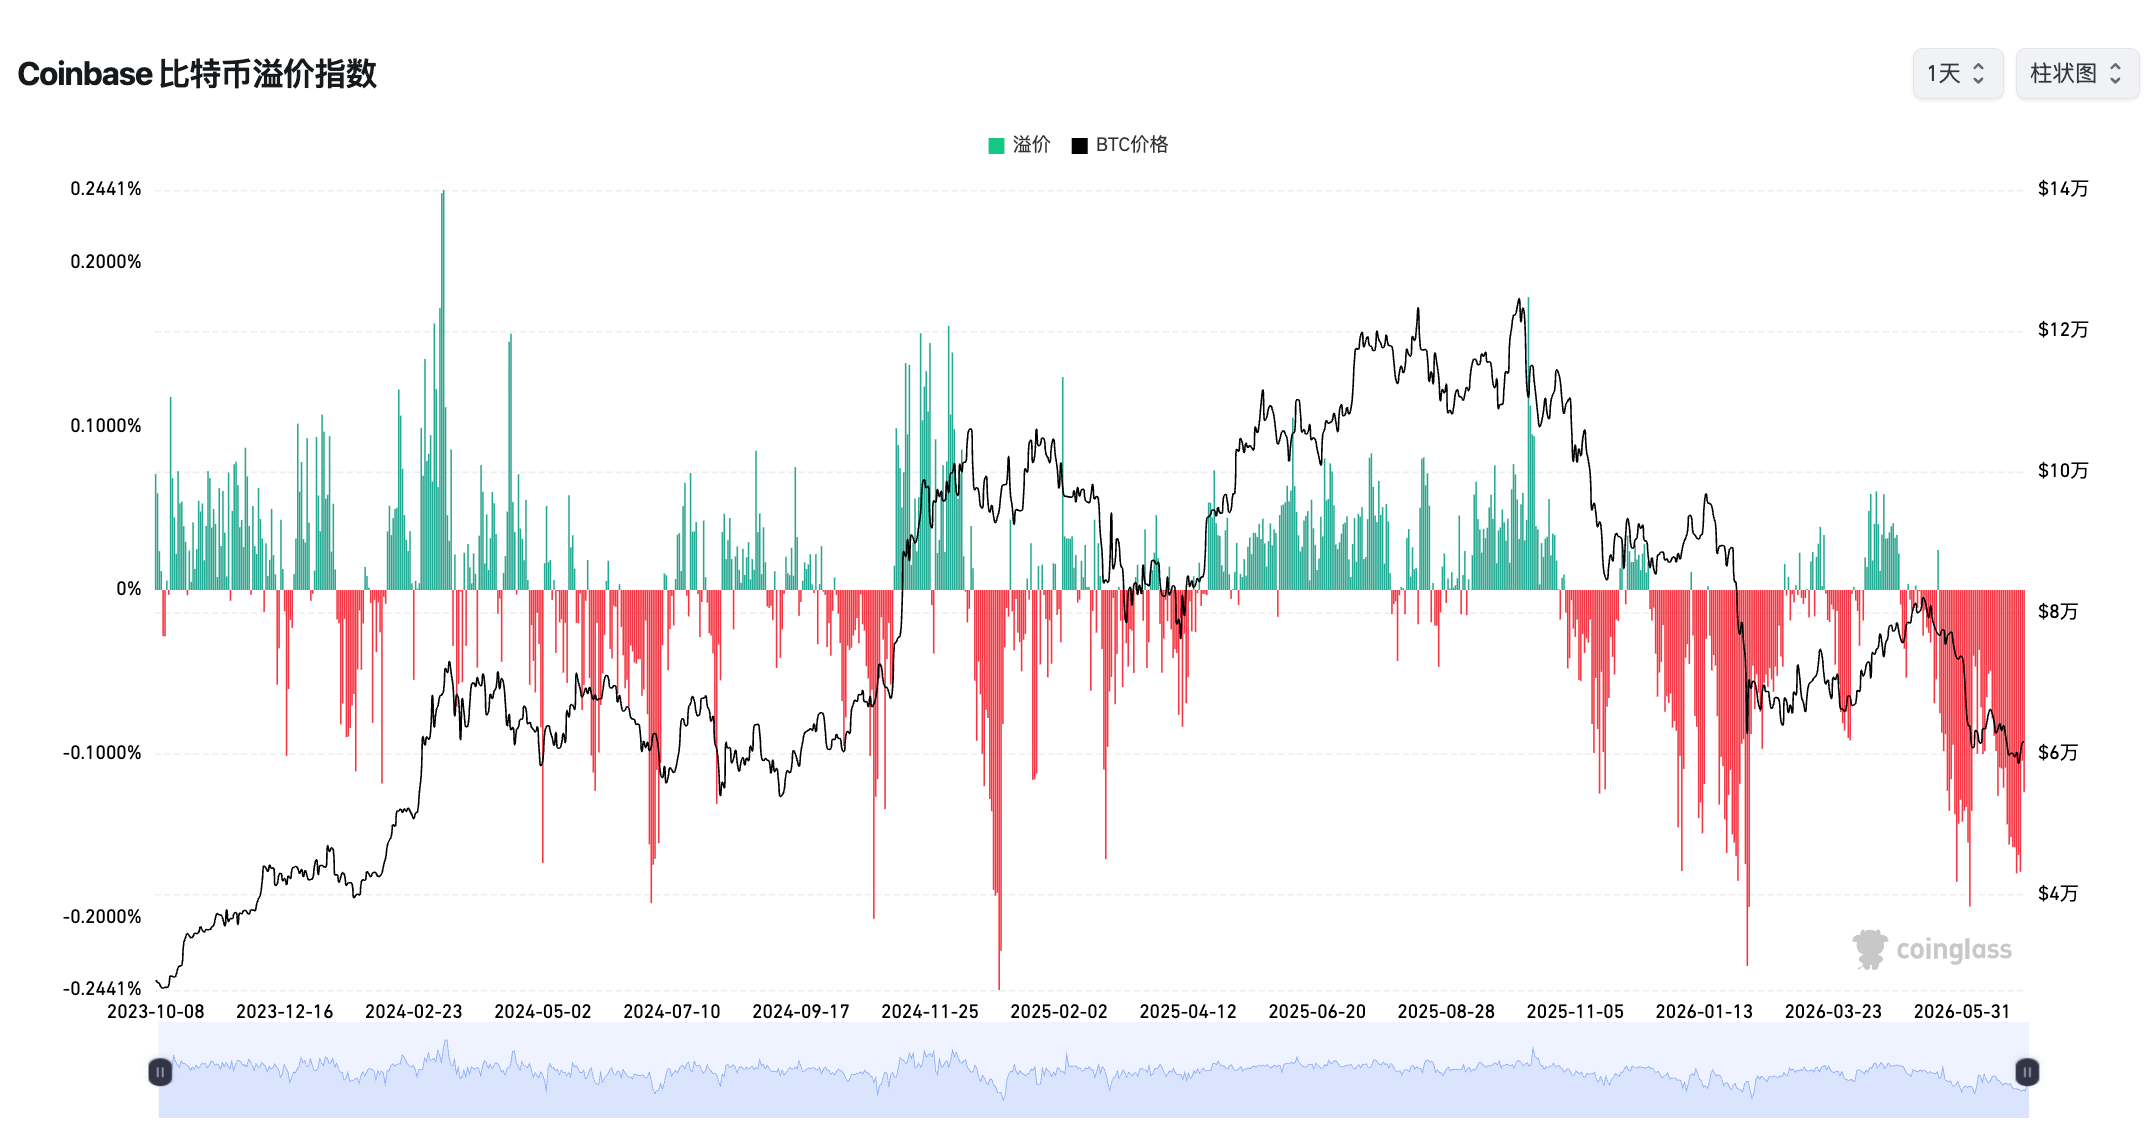
Coinbase Bitcoin Premium Index Overview
The Biggest Trigger for BTC's Plunge: Strategy Selling BTC to Survive, Expanding Losses
In late May and early June, Strategy, the largest BTC treasury company and a leading cryptocurrency concept stock, sold BTC for the first time in three years. This sale, involving only 32 BTC, quickly sparked panic in the crypto market, acting as the straw that broke the camel's back. Prices of major cryptocurrencies like BTC, ETH, and SOL subsequently plummeted.
Compounded by persistent net outflows from Bitcoin spot ETFs and continued capital drain from the crypto market, the shadow of the crypto bear market once again looms over everyone in the industry.
Bear Market Onset: BTC Posts Worst Weekly Performance Since 2022 in Early June
In the first week of June, Bitcoin briefly fell below $60,000, marking its worst weekly performance since the FTX exchange collapse in 2022. In the seven days leading up to June 7, Bitcoin dropped by 16%, representing a decline of over 50% from its 2025 all-time high of over $126,000.
In terms of data at that time, U.S. spot Bitcoin ETFs recorded net outflows for 13 consecutive trading days, with cumulative outflows reaching approximately $5.5 billion. Additionally, Bitcoin's price fell below the widely watched "200-week moving average," a key support level, further weakening market confidence.
Paul Howard, Senior Director at crypto trading firm Wincent, described the current market as a "silent bear market," stating that breaking below the 200-week moving average is a key confirmation signal that the market has entered a bear phase.
Although BTC subsequently rebounded slightly to around $65,000, multiple market analysts warned at the time that the rebound might be unsustainable, and Bitcoin may not have reached the bottom of this cycle. Griffin Ardern, co-founder of Primal Fund, noted that the market is still "quite far" from the "true bottom."
From the author's perspective, while there might have been hope for a significant BTC rebound in May, Strategy's action of selling BTC for survival directly shattered people's last illusions, symbolically marking the start of the "bear market confirmation."
Bear Market Continues: Many Institutions' Predictions of the Bear Market's End Proven Wrong
On June 11, crypto research firm CryptoQuant stated that Bitcoin might form a bottom around $53,600, which corresponds to the current realized price of Bitcoin—the average on-chain cost basis of all market participants. The report pointed out that in past major bear market cycles, Bitcoin typically bottoms around or slightly below its realized price.
On June 12, BIT released its latest weekly report titled "Will the FIFA World Cup Be the End of the Bitcoin Bear Market?" It suggested that Bitcoin's current bear market trajectory is broadly in line with its outlook from early February 2026, with the previously predicted A-B-C correction structure entering its final phase: after the A-wave decline to the $60,000-$69,000 range, Bitcoin rebounded to the $80,000-$90,000 range, peaked temporarily around $83,000, and then the rebound momentum gradually waned.
BIT noted that the current Fear & Greed Index has approached historically low levels with significant reference value, still showing some similarity to the bottom structure of the 2022 bear market. It maintained its previous view that the quiet summer trading period during the 2026 World Cup could mark the final phase of this Bitcoin bear market.
On June 17, crypto research firm K33 stated that the supply of Bitcoin held by long-term holders reached an all-time high, suggesting the bear market may be nearing its end. It emphasized that the reactivation activity of old coins in 2026 was significantly subdued, with only 218,421 Bitcoins reactivated as of June 6, indicating a sharp decrease in on-chain selling pressure. In contrast, 1.18 million Bitcoins had been reactivated by the same period in 2024. K33 believes that the decline in old coin activity suggests long-term holders are less willing to sell, and patient participants are continuously absorbing supply.
However, the further decline in BTC soon shattered these illusions, as the bear market continued its march.
Bear Market Indicators: STRC De-pegs from $100, Losses Widen for Long-term BTC and ETH Holders
On June 18, after falling below $95 earlier in the month, the price of Strategy's preferred stock, STRC, dropped below $90, closing at $89, marking its lowest daily closing price since its IPO and its lowest dividend-adjusted closing price since November last year.
Subsequently, STRC continued to decline, remaining de-pegged.
On June 26, STRC's pre-market price briefly fell to $73, hitting an all-time low. Market attention then shifted to two things: first, the ex-dividend date on June 30, where eligible holders would receive a dividend of $0.48 per share on July 15; and second, the resetting of the monthly dividend rate, with STRC's effective yield near 15% leading investors to expect Strategy to increase the dividend rate from 11.50% to at least 12% or 12.50%.
Three days later, on June 29, Strategy announced a $1 billion digital credit security buyback program and a board-approved "up to $1.25 billion BTC realization plan." Its dollar reserves also increased to $2.55 billion following the implementation of various fundraising plans, providing the capacity to pay interest on preferred shares like STRC. The discount crisis for STRC was temporarily resolved on a phased basis, with its price recovering to above $80 and currently trading around $87.87.
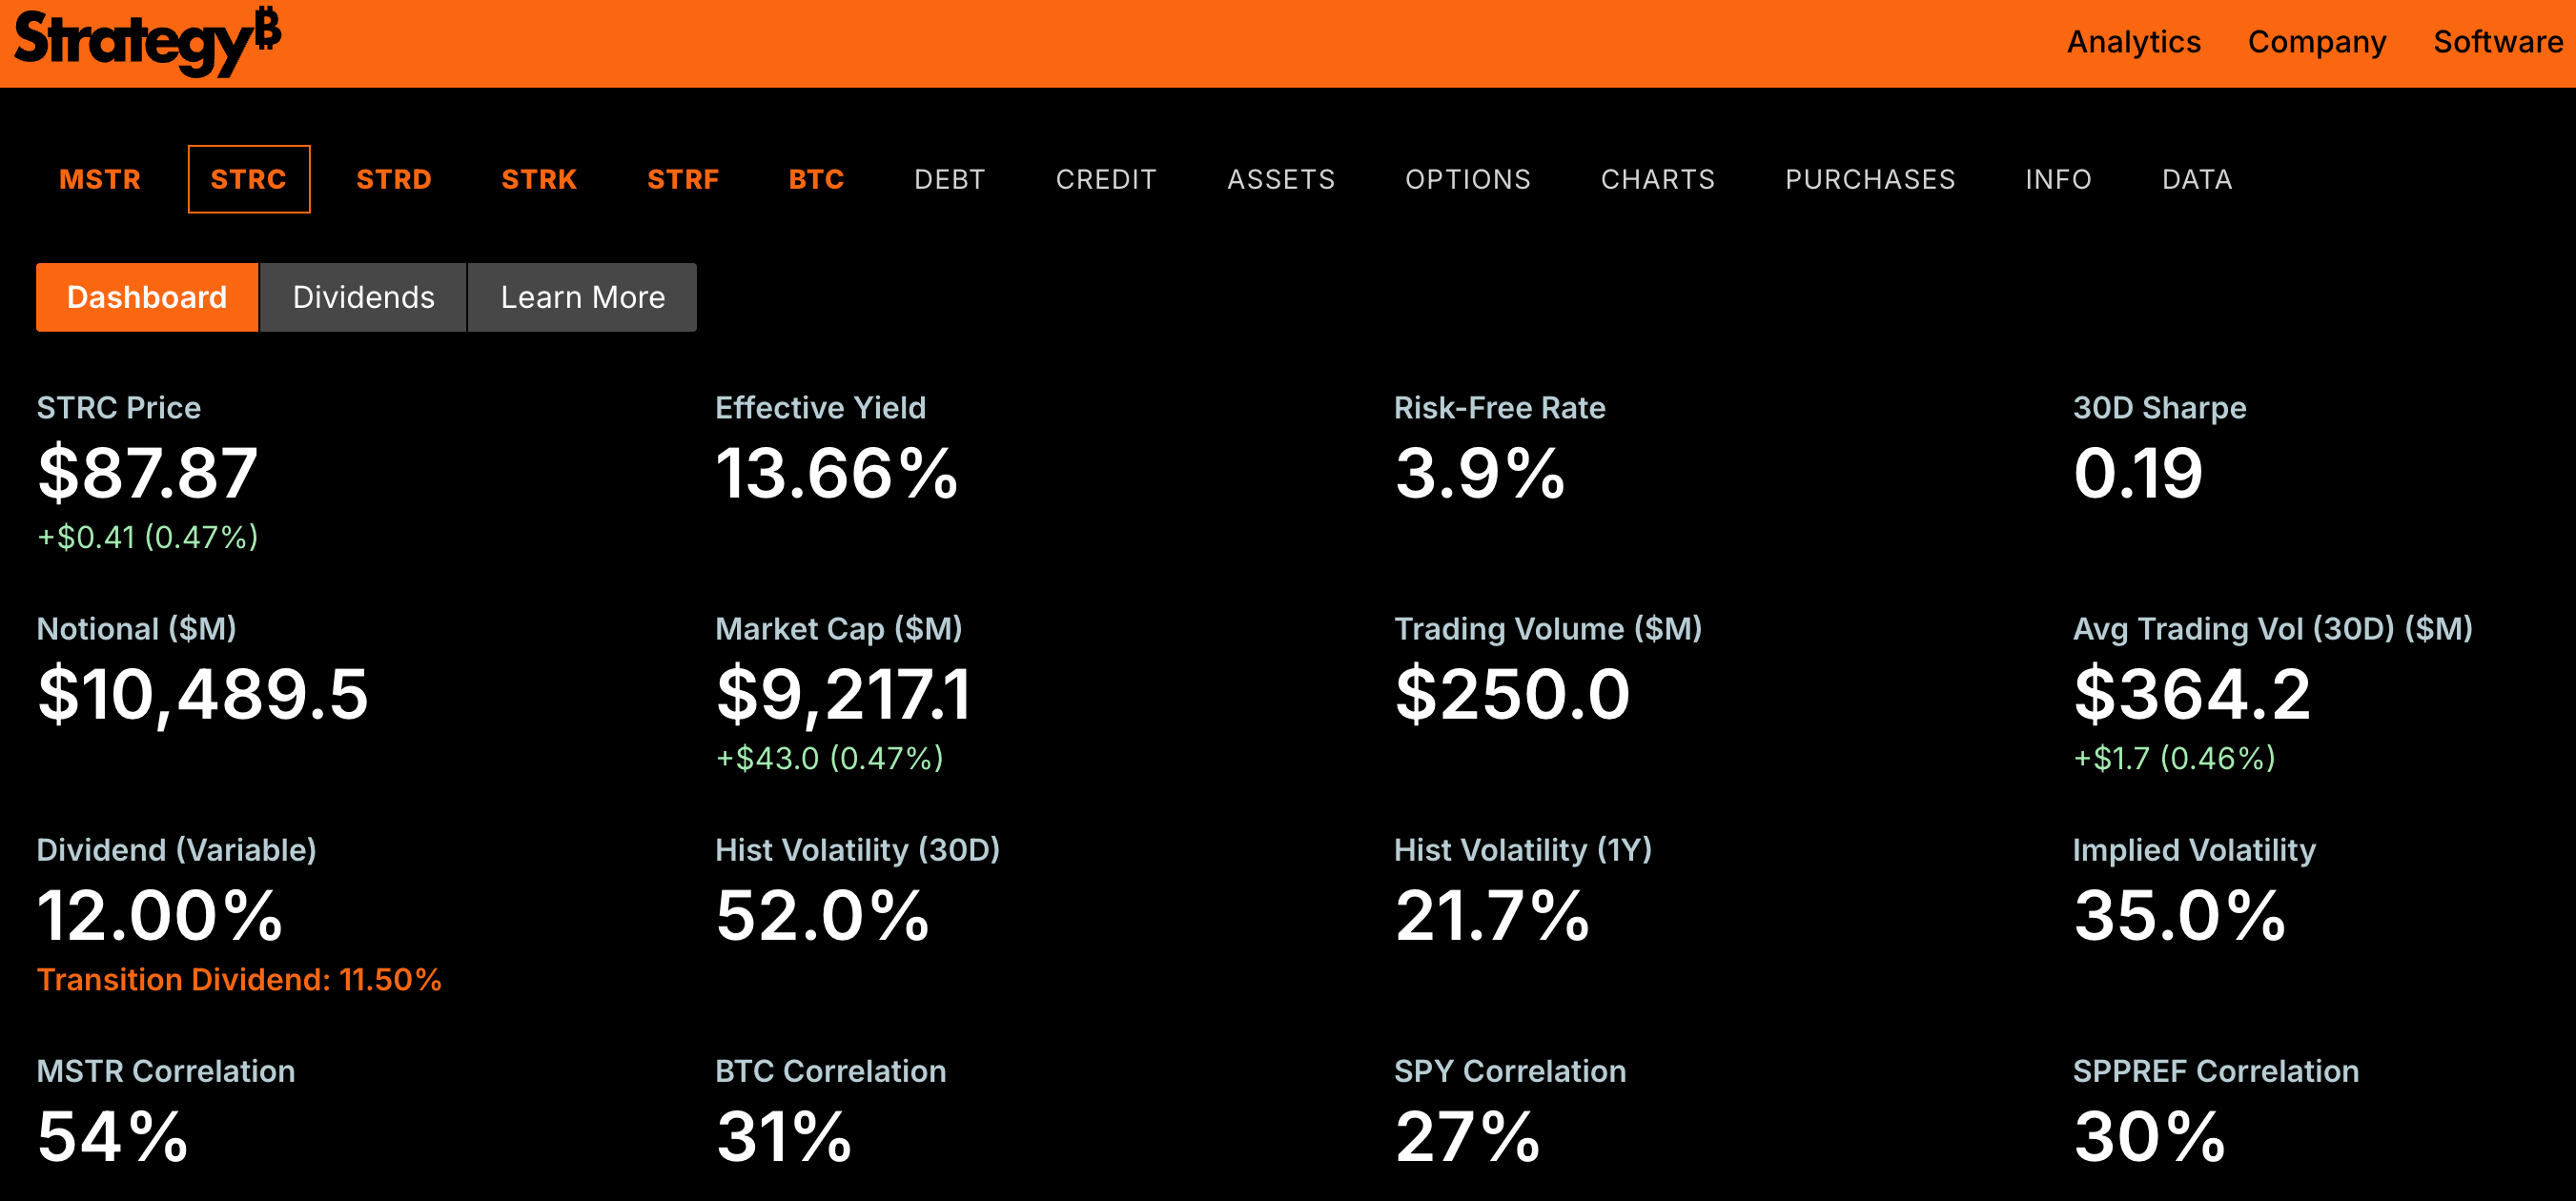
Source: Strategy Official Website
However, due to the continued decline in BTC and ETH, losses for long-term holders have further expanded.
On June 25, Bitcoin briefly fell to around $59,100, with 10.83 million BTC in a loss position, a record high that surpassed the previous bear market bottom peak of about 10.5 million. Long-term holders (holding for at least 155 days) held a record 14.8 million BTC (Note from Odaily: The total circulating supply of Bitcoin is approximately 20 million), with 37% of these positions in loss. Latest data shows that the number of BTC held long-term has grown to 16.61 million BTC today, while the average cost basis has dropped to around $49,700.
Data from June 26 shows that ETH whales have fallen into loss territory for the first time since 2019. Even during the 2022 bear market, the largest whales holding over 100,000 ETH remained profitable. The ratio of unrealized profits for all three whale categories is currently negative: -0.26 for the 1,000 to 10,000 ETH range, -0.21 for the 10,000 to 100,000 ETH range, and -0.05 for the over 100,000 ETH range. This condition has persisted for several weeks.
Bitcoin UTXO data from June 28 shows that the ratio of loss-making transactions to profitable transactions in the current market has fallen to its lowest level in this bear market cycle, indicating that investors are entering a clear "capitulation" phase. A similar low point last occurred during the deep phase of the 2023 mid-cycle bear market, when Bitcoin's price fell to around $26,000.
Previously, due to the continuous price decline, ETH's market cap briefly fell below $185 billion, being surpassed by USDT. With the price rebounding above $1,700, ETH's market cap currently stands at $207 billion.
In summary, key indicators for the end of the bear market include STRC re-anchoring to $100, and long-term BTC and ETH holders moving out of loss territory.
Hypothesis on Bear Market End Date: August or December?
Regarding the specific end date of the bear market, there is currently no mainstream view. Here, we only reference opinions from some industry professionals.
Yi Lihua: July-August Could Be a Good Time to Bottom Fish
In late June, TrendResearch founder Yi Lihua stated that this is the third wave of decline since October 11. According to wave theory and cyclical patterns, this could be the last major drop for Bitcoin.
Market focus is primarily on Bitcoin's bottom price this time, with major factors being the US stock market and MicroStrategy. The Fed's concerns about CPI could lead to changes in expectations for rate cuts or even hikes, potentially causing a sustained pullback in US stocks. Secondly, bear market tails often involve black swan or blow-up events, which have not yet occurred in this cycle, warranting close observation.
Based on Bitcoin's peak of $126,000, a 60% decline corresponds to $51,000, and a 66% decline corresponds to $43,000. Regardless, July to August should be the final window and the best time to buy the dip, possibly even the most worthwhile opportunity in the next three years.
Jiang Zhuoer: BTC Will Bottom at $42,000-$44,000 Between October and December
On June 25, Laitibi Mining Pool founder Jiang Zhuoer predicted that this BTC bear market would bottom out at $44,016 on October 31 this year. Combining the pattern of mNAV leading Bitcoin's price by 6 months, the bottoming window is revised to October to December 2026, with a bottom price range of $42,000 to $44,000.
He pointed out that the underlying logic is that the mNAV (Market Cap / BTC per Share value ratio) of Strategy's common stock MSTR has fallen to 0.72, approaching the lowest point of 0.7 during the previous bull market on May 11, 2022. Based on recent market sentiment events like STRC's significant de-pegging, this is currently predictable as the lowest mNAV for this cycle. However, the lowest mNAV does not coincide with the lowest BTC price. During the previous cycle, mNAV bottomed at 0.7 on May 11, 2022, when BTC was at $31,017, while BTC bottomed at $15,476 on November 21, 2022, when mNAV was 1.2, a gap of 6 months.
BTC Price Indicators: 4-Year Moving Average, 200-Week Moving Average Heatmap
According to Coinglass data, the BTC 4-Year Moving Average price index showed that from June 25 to June 30, impacted by BTC briefly falling below $59,000, the index dropped to 0.95. It has since recovered to around 1 as BTC rebounded above $61,000.
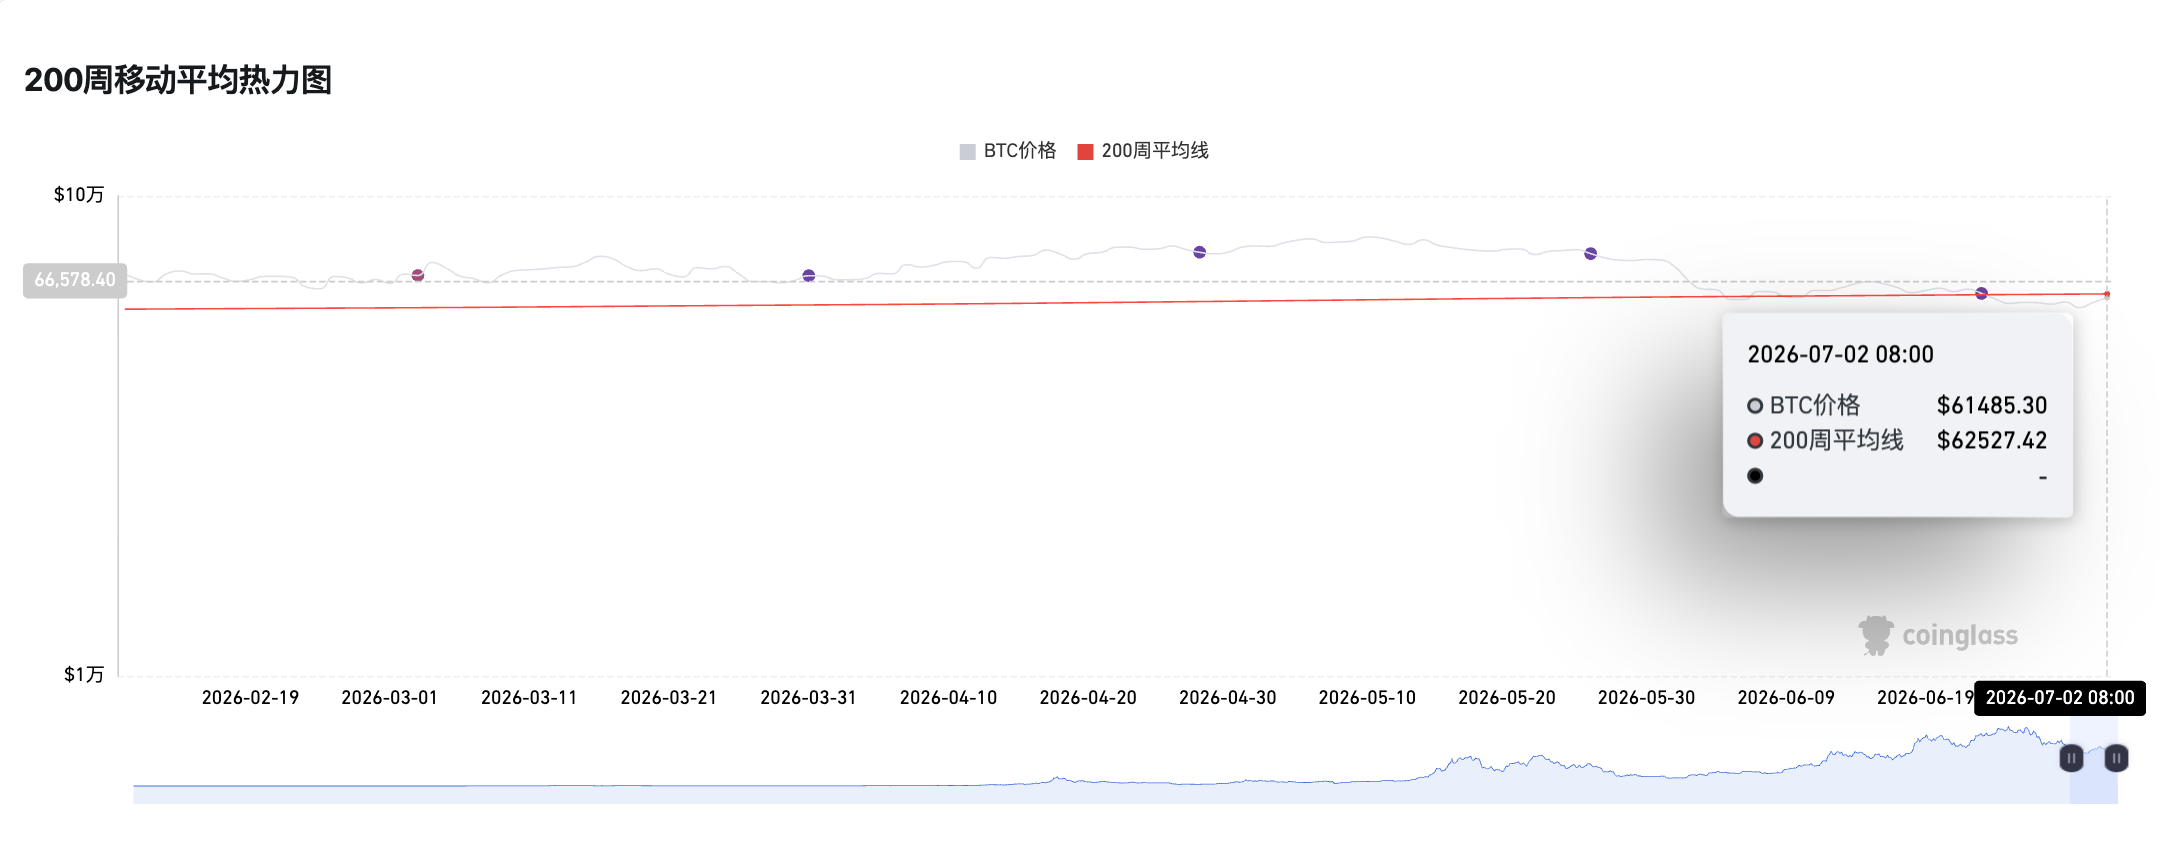
According to the BTC 200-Week Moving Average Heatmap, BTC's current price is roughly flat with the 200-week moving average and has been consistently trading below it since June 23, potentially signaling a price bottom.
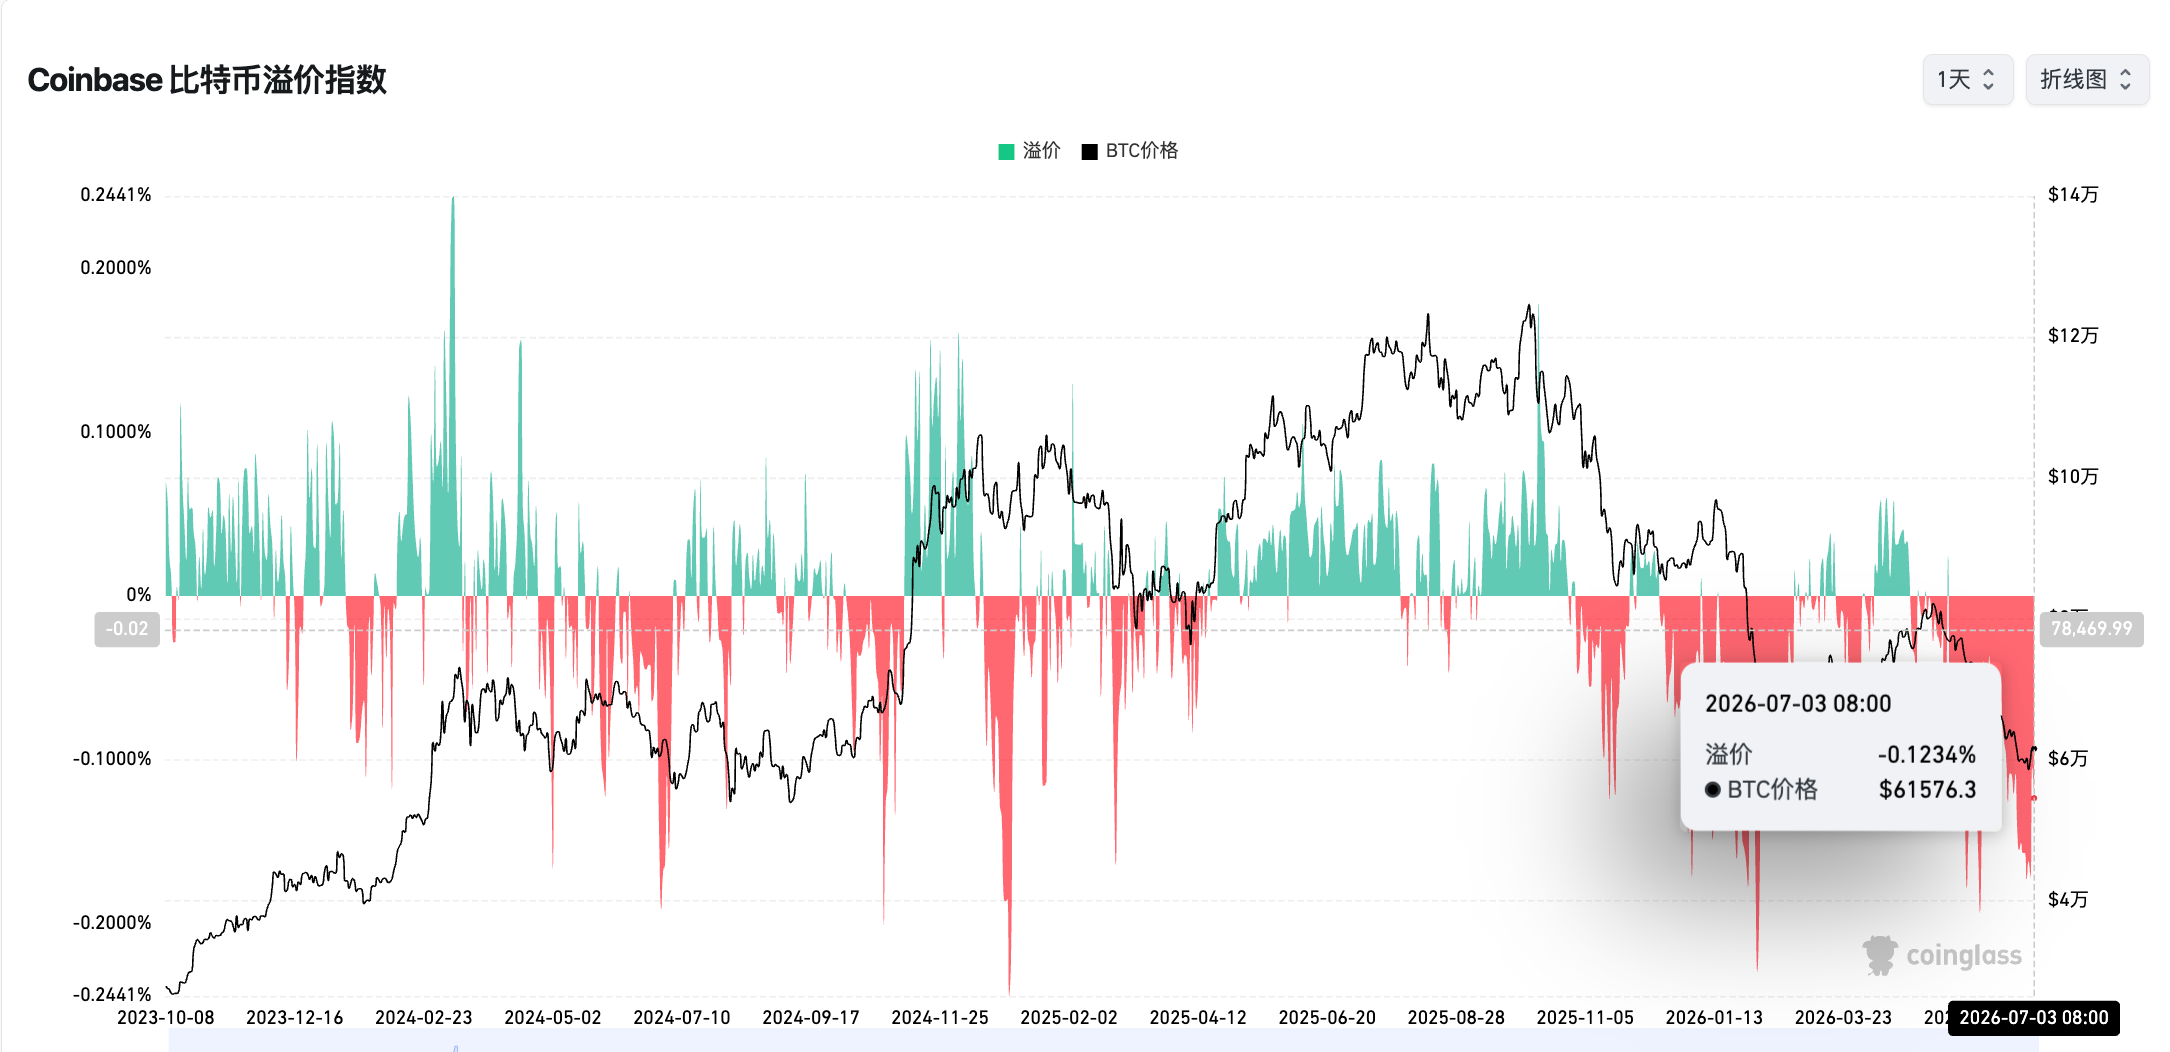
Additionally, returning to the Coinbase Bitcoin Premium Index mentioned at the beginning of the article, it currently remains at -0.123%. Based on the previous positive range, BTC would need to rebound to around $77,000 for the index to turn positive.
To sum up, without strong external positive catalysts, this bear market will likely persist for at least another 2-3 months. The period from late September to early October will be a critical window to determine whether BTC can stage a rebound.
Recommended Reading
4 Classic Bottom-Fishing Indicators Fail, 3 New Indicators Point to Buying Opportunity?


