
Daytime watch SK Hynix, nighttime trade US stocks: The new "Asian session barometer" for global AI markets?
- Core Thesis: As the leading AI memory stock during Asian trading hours, SK Hynix’s stock price fluctuations have become a leading indicator for the US tech sector, especially the Philadelphia Semiconductor Index. This stems from its core position across the full AI memory supply chain, including HBM, DRAM, NAND, and enterprise SSDs. Its planned US listing is expected to drive a valuation shift from a "Korean cyclical stock" to a "global AI infrastructure asset."
- Key Elements:
- Data Validation: When SK Hynix rises by over 1% in a single day, the Philadelphia Semiconductor Index has a 77.1% probability of rising that same evening, with the correlation most pronounced during the US market's opening gap, indicating a direct and significant impact on US market opening prices.
- Industry Position: SK Hynix holds approximately 58% of the global HBM market share and is a core supplier to NVIDIA. Through its acquisition of Intel's NAND business, it has built a complete AI memory chain spanning HBM, DRAM, NAND, and enterprise SSDs.
- US Listing: SK Hynix plans to list on the Nasdaq in July 2025, aiming to raise approximately $29.4 billion, making it one of the largest stock offerings in global history. The move is intended to address the "Korea discount" and lower the investment threshold for international investors.
- Valuation Reshaping: In the US market, SK Hynix will be directly compared to companies like Micron and may be repositioned as a "global AI infrastructure asset" rather than a traditional memory cyclical stock, potentially commanding higher valuation multiples.
- Long-term Challenges: SK Hynix must maintain technological leadership in next-generation HBM (HBM4), demonstrate the sustainability of high HBM profit margins, and successfully develop Solidigm into a second growth engine to support its new narrative.
Over the past month, placing the Korean and US stock markets side by side reveals a rather intriguing phenomenon.
SK Hynix during Asian trading hours increasingly resembles a prelude for the US AI sector that night: If it surges during the day, NVIDIA, Micron, and the Philadelphia Semiconductor Index often gap up in the evening; if it corrects first, US tech stocks are highly likely to follow suit and cool down.
This linkage appears especially evident against the backdrop of recent severe volatility in global tech stocks.
The latest example occurred this morning after US markets closed. Micron (MU) released unexpectedly strong earnings and guidance. When the Korean market opened, Hynix quickly absorbed this memory sentiment, rising over 10% during the session.
Of course, it would be imprecise to simply summarize this phenomenon as "Hynix rises, US stocks rise." After all, a company worth trillions of dollars can hardly single-handedly determine the direction of a US capital market worth tens of trillions of dollars.
However, as global capital trades the same set of expectations around AI, an increasingly clear cross-market pricing chain has formed, with Hynix precisely becoming the most sensitive 'thermometer' within it.
This brings us to the more pertinent question: Why Hynix? How did it become the 'Asian session bellwether' for global AI trading? And as Hynix formally advances its US listing, how will Wall Street reprice it?
1. Hynix by Day, US Stocks by Night: Is It Just Superstition?
From a trading time perspective, the Korean market, operating during Asian hours, naturally sits between the previous night's US market close and the next US market open.
This means that when the Korean market opens, investors have already absorbed the performance of the previous night's US close and simultaneously trade the latest earnings reports and macroeconomic changes that emerged after the US close.
By the time the Korean market closes, US investors, in turn, use the performance of Asian semiconductor companies, US pre-market trading, and stock index futures as a reference for the day's risk appetite.
Therefore, theoretically, there exists a relay pricing chain spanning two trading time zones between Hynix and US stocks: The previous night's US session provides the initial sentiment. Hynix confirms or corrects it during Asian hours. The US market then absorbs the incremental information released by the Asian market at its next open.
To test this intuition, MSX Maetong used common trading days of the Korean and US markets as a sample to backtest the co-direction rate, correlation, and conditional hit rate between Hynix and major US indices.
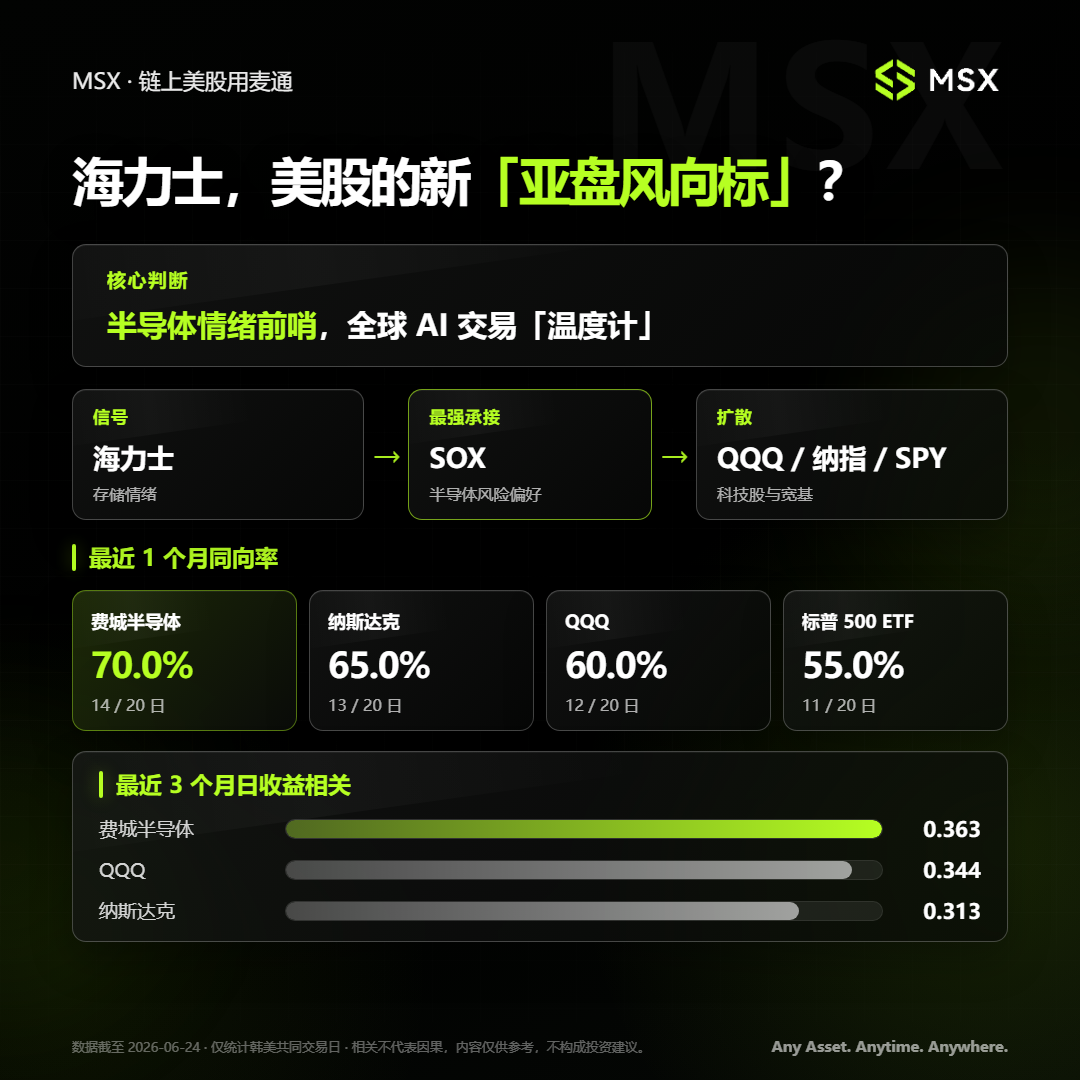
First, looking at the direction of price changes over the past month, the co-direction rate between Hynix and the Philadelphia Semiconductor Index reached 70%, meaning they moved in the same direction on 14 out of 20 common trading days.
In comparison, the co-direction rate with the NASDAQ Composite Index was 65%, with QQQ was 60%, and with the S&P 500 ETF was 55%.
This result primarily indicates that Hynix is not a broad-based signal equally effective for all US assets. It shows a clear industrial gradient, with the strongest linkage to the Philadelphia Semiconductor Index, followed by tech-heavy indices like the NASDAQ and QQQ, and finally trickling down to the S&P 500, which represents the broader US market.
This aligns perfectly with Hynix's industrial attributes.
Capital first trades memory and semiconductor sentiment through Hynix. This risk appetite then transmits to the entire AI tech sector, only spreading to the broader US market when the momentum is strong and the impact wide enough.
In other words, Hynix acts more like a semiconductor sentiment outpost than a macro-level predictor of the US stock market.
Analyzing daily return correlations over the past three months reveals this same industrial gradient. The correlation coefficient between Hynix and the Philadelphia Semiconductor Index is 0.363, with QQQ it is 0.344, and with the NASDAQ Composite Index it is 0.313.
It's crucial to emphasize that these numbers don't mean a 1% rise in Hynix mechanically leads to a 0.363% rise in the SOX index. Instead, they measure the degree of co-movement between the two return series over the sample period. The closer the value is to 1, the more likely they are to rise or fall in sync; the closer to 0, the weaker the linear relationship.
Realistically, 0.3 to 0.4 represents only a moderate positive correlation. However, considering the significant noise in daily financial markets, this is already a remarkably high and valuable signal.
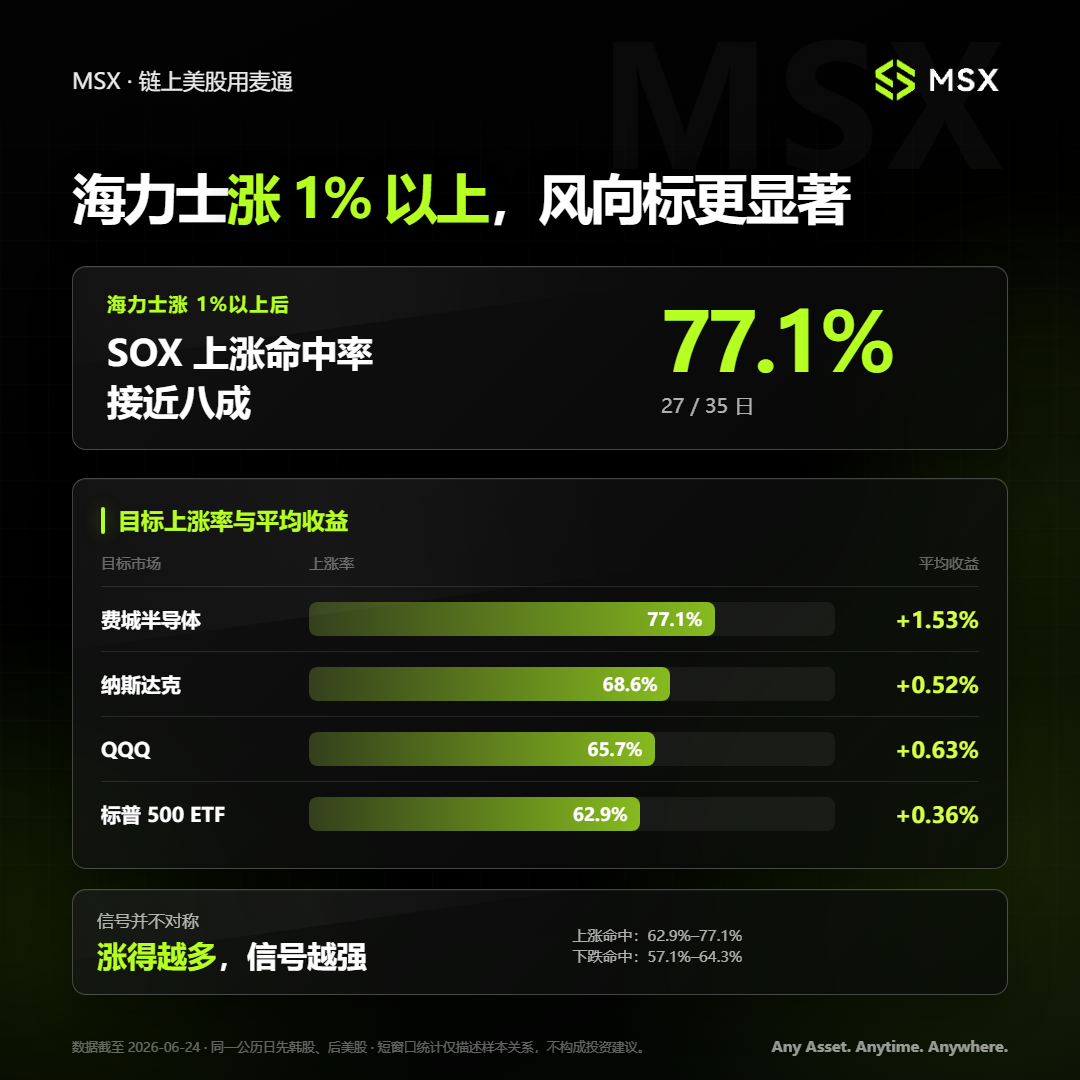
It is for this reason that MSX further cleaned and filtered the data, identifying a clear 'strong volatility trigger' characteristic – when Hynix rises more than 1% in a single day, the hit rate for the Philadelphia Semiconductor Index rising that night reaches 77.1%. That is, out of 35 qualifying samples, the index recorded gains 27 times, with an average return of 1.53%.
Under the same condition:
- The NASDAQ Composite Index's upward hit rate was 68.6%, with an average return of 0.52%;
- QQQ's upward hit rate was 65.7%, with an average return of 0.63%;
- The S&P 500 ETF's upward hit rate was 62.9%, with an average return of 0.36%;
This set of results is undoubtedly more explanatory than the simple co-direction rate of daily changes.
After all, when Hynix fluctuates only slightly, it may be mixed with significant noise from domestic Korean funds, exchange rates, and index weight adjustments. However, when it rises more than 1% in a day, it often signifies the market is actively trading on a clearer industry signal.
Interestingly, this signal is not perfectly symmetrical. In this sample, after a clear rise in Hynix, the upward hit rate for major US indices fell roughly between 62.9% and 77.1%. Conversely, when Hynix clearly fell, the corresponding downward hit rate for US indices was only about 57.1% to 64.3%.
This suggests that, at least within the current sample period, Hynix's upward signals are temporarily more reliable than its downward signals.
This might be related to the sample period being within the upswing phase of AI memory demand. In a market where capital tends to seek long opportunities in AI, a surge in Hynix is more easily interpreted as a re-confirmation of industrial demand, similar to the direct catalyst provided by Micron's earnings today. A decline in Hynix, however, could stem from short-term profit-taking, technical adjustments in the Korean market, or fund flow volatility at the individual stock level, not necessarily indicating synchronized deterioration of the global AI fundamentals.
The third set of data further reveals the specific timing when the Hynix signal operates.
If we decompose the daily returns of US stocks into two parts:
- The opening gap: the change between the day's open price and the previous day's close;
- Intraday return after the open: the change between the day's close and the day's open price;
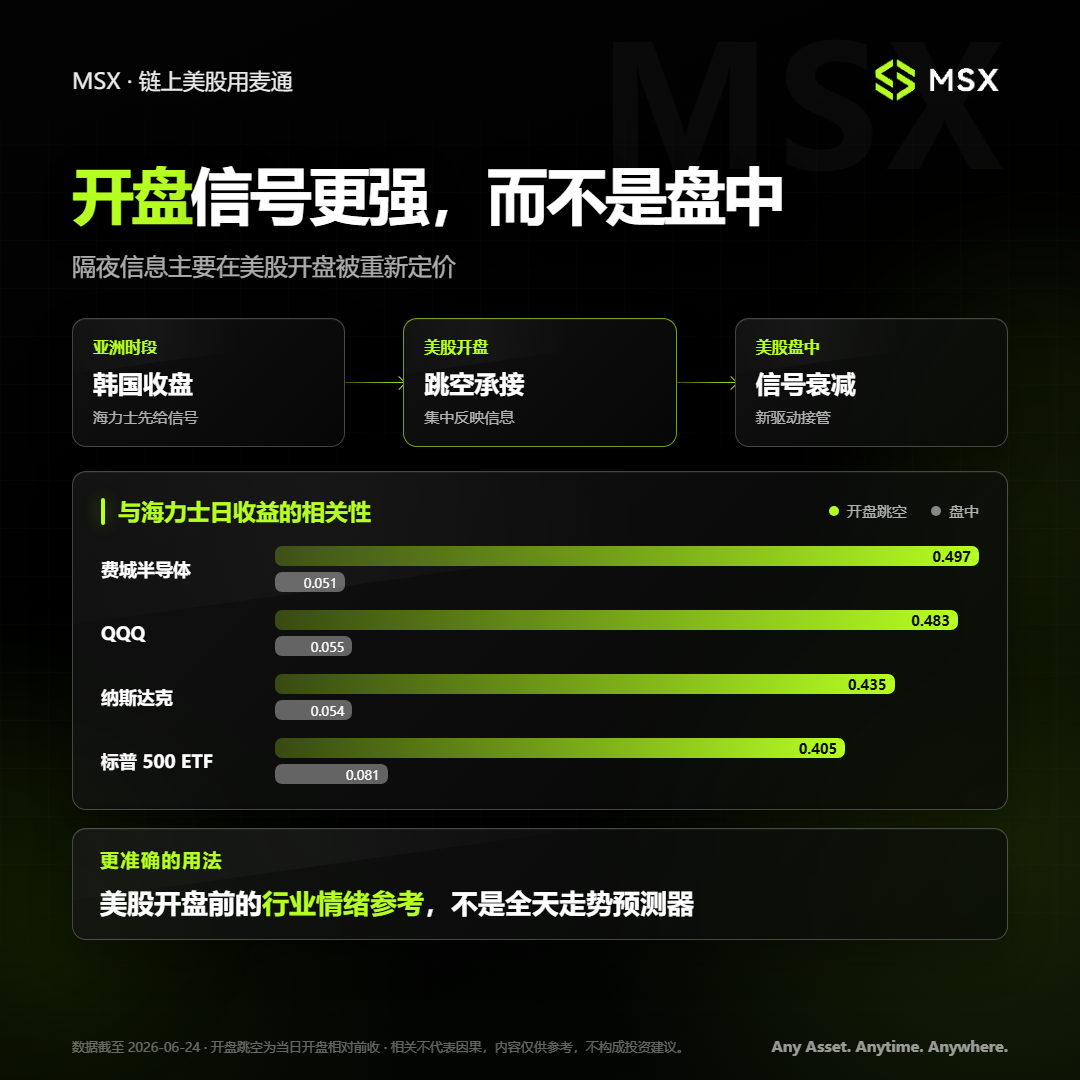
We find that Hynix's correlation with US stocks is almost entirely concentrated in the opening gap phase.
Specifically, the correlation coefficient between Hynix's daily return and the opening gap of the Philadelphia Semiconductor Index is 0.497. For QQQ it is 0.483, for the NASDAQ Composite it is 0.435, and for the S&P 500 ETF it is 0.405.
Again, as mentioned earlier, a correlation coefficient near 0.5 in noisy daily cross-market returns implies that the stronger Hynix performs during the day, the more likely the SOX and QQQ are to open higher that evening; conversely, the weaker Hynix performs, the more likely US semiconductors and tech stocks are to open lower.
However, once US markets actually open, this linkage almost immediately dissipates. The correlation between Hynix's daily return and the intraday return of the SOX is only 0.051. For QQQ it is 0.055, for the NASDAQ Composite it is 0.054, and for the S&P 500 ETF it is 0.081 – essentially zero.
The stark contrast between these two phases suggests that the information Hynix reveals during Asian hours is primarily absorbed by the US market into its opening prices en masse. Once the US market opens, domestic data, news, and intraday liquidity take over pricing, and Hynix's explanatory power quickly decays.
Synthesizing the three data sets yields a relatively complete transmission chain:
Hynix first confirms memory and semiconductor sentiment. The SOX index most directly absorbs this at the US open. It then spreads to QQQ and the NASDAQ, and finally may trickle down to the S&P 500. In this chain, the SOX validates the industry-specific nature of the signal, QQQ and the NASDAQ indicate whether it has spread to the main AI theme in US stocks, and the S&P 500 acts as a benchmark for the broad market.
From this perspective, the linkage between Hynix and the US AI sector doesn't mean the former single-handedly 'drives' the latter. It's more akin to two markets continuously pricing the same set of industrial variables at different times.
Hynix gains a temporal advantage by opening first. Due to its central position in the AI memory supply chain, it also possesses a higher information density than typical Asian tech stocks.
This leads to a more critical layer of the question: Why is Hynix the one capable of assuming this role?
2. Why Hynix Specifically?
The fundamental reason Hynix has attained this market position is not solely because the Korean market opens earlier. It is because it has essentially become a 'critical few' that is hard to bypass in the AI infrastructure ecosystem.
As is well known, market discussions about AI in recent years have typically started with GPUs. NVIDIA provides the compute power, cloud providers build data centers, and power grids, networks, optical communications, and liquid cooling ensure the stable operation of compute clusters. In this narrative, while important, memory was long viewed as a relatively traditional cyclical component.
But as model scales, training data, and inference demands continue to grow, the challenge for AI systems is no longer just 'whether there are enough GPUs.' This has redefined memory's role in AI:
- HBM sits tightly coupled with the GPU, responsible for high-speed data delivery, determining whether expensive AI chips can fully unleash their computational power;
- Server DRAM serves as runtime memory, impacting server concurrency capacity and task throughput;
- NAND handles long-term storage of models, training data, and inference data, absorbing the massive growth in total data volume driven by AI;
- Enterprise SSDs reside in the data center storage layer, accelerating data entry into computing systems through higher capacities and faster read speeds;
To put it more directly: GPUs determine 'whether you can compute,' HBM determines 'whether the compute power can be fully utilized,' DRAM determines 'how many tasks can be processed simultaneously,' and NAND and Enterprise SSDs determine 'where vast amounts of data are stored and how quickly they can be accessed.'
And Hynix cuts across virtually every layer of this AI memory chain, achieving a 'grand slam.'
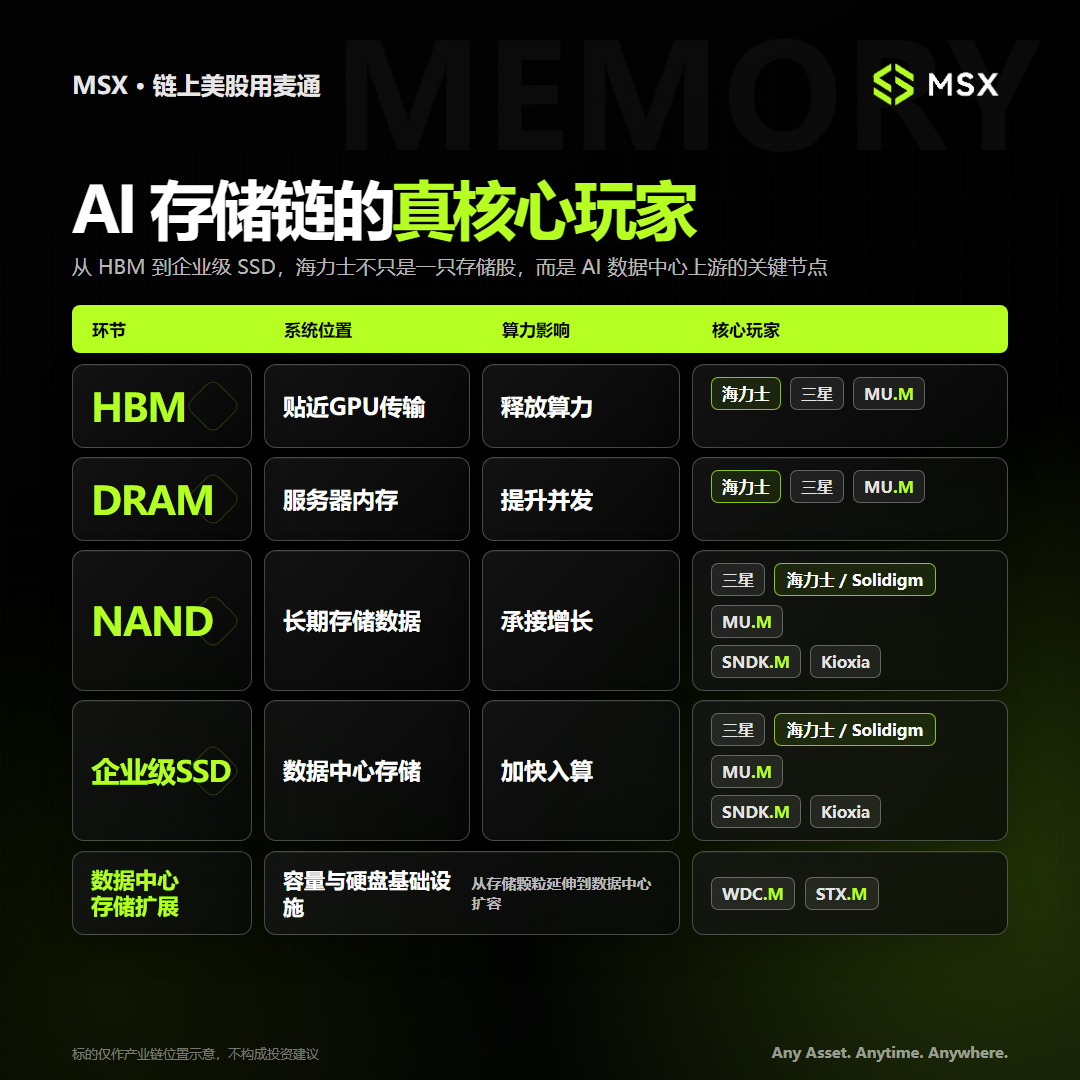
In the HBM field, Hynix remains one of the world's most critical suppliers. As of the first quarter of 2026, Hynix held approximately 58% of the global HBM market share, with Samsung and Micron each holding around 21%. It is also one of the most important HBM suppliers for NVIDIA's AI accelerators.
The key distinction between HBM and traditional standardized memory is precisely that it is difficult for customers to substitute easily.
Simultaneously, Hynix is not just an HBM company. Back in 2020, it announced the acquisition of Intel's NAND and SSD business for approximately $9 billion. The first phase closed in 2021, establishing Solidigm in the US, focused on enterprise SSDs and data center storage. In March 2025, both parties completed the second phase of the transaction, with Intel's remaining NAND technology, intellectual property, and related personnel formally transferring. This multi-year acquisition was finally concluded.
This deal not only filled a critical gap in Hynix's enterprise storage capabilities but also gave it two interconnected yet distinct growth trajectories:
- One revolves around HBM and server DRAM, participating in the expansion of AI accelerators and servers;
- The other revolves around NAND and enterprise SSDs, capturing demand for training data, model weights, inference caches, and data center storage;
Ultimately, the current Hynix resembles a high-purity AI memory asset. Its profits, capital expenditure, and market expectations are all tightly bound to memory industry sentiment.
This business concentration undoubtedly maximizes its stock price elasticity. Thus, the three conditions for Hynix becoming the Asian session bellwether form a closed loop:
- First, it opens earlier in the day, allowing it to digest Asian session information before US markets;
- Second, it is sufficiently core to the industry, cutting across all four memory layers: HBM, DRAM, NAND, and enterprise SSDs;
- Third, its business purity and stock price elasticity are high enough to rapidly amplify global capital's assessment of AI memory industry health;
Therefore, when Hynix experiences significant volatility, the market isn't just trading the rise or fall of one Korean company. It is trading whether AI server shipments can continue to scale, whether memory supply remains tight, and whether global capital remains willing to pay higher valuations for AI hardware.
But the crux is that Hynix's past capital market identity, largely confined to the Korean market, hasn't fully kept pace with its evolving global industrial status.
The latest push for a US listing aims to change precisely this.
3. Listing in the US: Changing More Than Just the Trading Venue
Coincidentally, on June 24, Hynix publicly filed an F-1 registration statement with the US Securities and Exchange Commission (SEC), formally proceeding with a NASDAQ ADR listing under the ticker "SKHY".
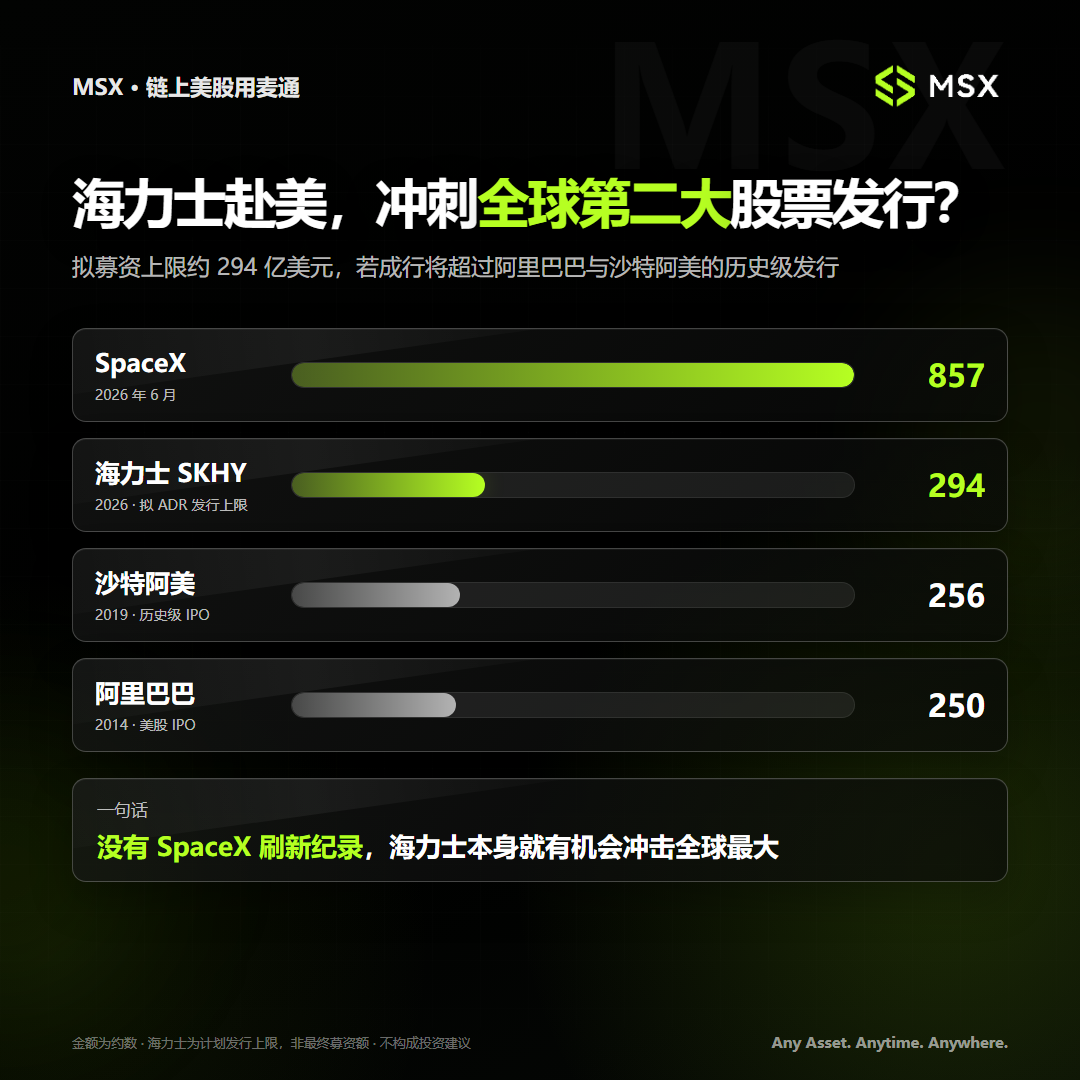
According to the currently disclosed plan, Hynix intends to issue up to 17.79 million new ordinary shares, with a potential fundraising size of approximately $29.4 billion. It plans to debut on the NASDAQ as early as July 10.
If completed at the current indicative price, this would become one of the largest stock offerings in the history of global capital markets – surpassing the approximately $25.6 billion offerings of Alibaba in 2014 and Saudi Aramco in 2019, second only to the $85.7 billion record set by SpaceX in mid-June.
In other words, had SpaceX not preemptively broken the record in June, Hynix itself would have been poised to claim the top spot for the world's largest stock offering.
It's important to note that Hynix's move to the US is not a traditional IPO by a company that has never been listed. It is a secondary listing via ADR for a company already listed in Korea, involving the issuance of new shares.
Theoretically, changing the trading venue doesn't magically create new revenue and profit. Beyond the capital raised, the business itself seems unlikely to change overnight.
However, capital markets never price solely based on current profits. What a US listing truly can change is its investor base, liquidity, capacity for capital expenditure, and the narrative framework the market assigns to it.
The most immediate change is a potential transformation in Hynix's identity from a 'Korean memory cyclical stock' to a 'global AI infrastructure asset.'
For a long time, Hynix, like many large Korean conglomerates, has been subject to what is known as the 'Korea discount.' Complex group governance structures, foreign exchange risk, market liquidity, and barriers to international capital participation mean that even Korean companies with global competitiveness often struggle to receive the same valuations as their US counterparts.
Objectively speaking, this is not unique to Korea; it applies to virtually all markets compared to US stocks. Upon entering the US capital market, Hynix could be placed into a different coordinate system. It is a key company in NVIDIA's AI supply chain, a leader in the HBM market, an essential infrastructure supplier for AI data centers, and it owns Solidigm and a US-based AI business platform.
For the same company,


