
Bitcoin’s Five-Wave Adjustment Nears Its End, Support Zone Presents Opportunity for HYPE | Expert Analysis
- Core View: BTC is in the final segment of a five-wave adjustment this week, with the position of Endpoint 44 determining the short-term direction. HYPE is simultaneously undergoing a five-wave adjustment; if Endpoint 56 is higher than the previous low, the probability of a rebound is high. Both coins offer A/B/C operational plans based on structure analysis.
- Key Elements:
- If BTC’s Endpoint 44 is above $58,110, the probability of a rebound is high. If it is below without a bottom divergence, be alert for a breakdown; the quantitative model leans towards the first two scenarios occurring.
- Maintain a 20% short position for BTC’s mid-term holdings, and reserve 30% for short-term positions to trade spreads based on support/resistance levels, executing according to the three-set plan A/B/C.
- If HYPE’s Endpoint 56 forms a double bottom above Endpoint 54, the probability of a rebound is significant. Once it stabilizes in the support zone ($58.8 or $52-54), consider a light long position with position size controlled below 30%.
- Last week, two short trades (1x leverage) were executed for BTC based on signals from the proprietary quantitative model, successfully yielding a profit of approximately 6.21%.
- Key resistance for BTC is $60,900-$62,300, with the first support at $58,100; HYPE’s first resistance is $65.5, with the first support at $58.5.
This week, BTC is in the final phase of a five-wave corrective structure. The formation of "Endpoint 44" will determine the short-term direction — if it is above 58,110, the probability of a rebound is high; if below without a bullish divergence, caution is needed for a further breakdown. We have preset three operation plans (A/B/C). The mid-term short position remains at 20%, while the short-term position retains 30% to seek spread opportunities.
Meanwhile, HYPE has initiated a five-wave corrective pattern from the high of 76.94, and is currently in the 55-56 segment. If "Endpoint 56" forms a double bottom above the previous low, the probability of a rebound is significant. After stabilization in the support zone, a light long position with strict risk control below 30% can be considered.
The complete structural analysis, quantitative model signal interpretation, and specific operation plans are detailed in this week's full review.
Key Trading Insights for This Week
- BTC hourly-level trend structure analysis (detailed in Part 1)
- BTC price forecast & mid/short-term trading strategy for this week (detailed in Part 2)
- HYPE hourly-level trend structure analysis (detailed in Part 3)
- HYPE price forecast & short-term trading strategy for this week (detailed in Part 4)
Market Verification of Last Week's Strategy and Core Views
- BTC short-term trading performance: Last week, Bitcoin completed two short-term short trades (1x leverage), successfully achieving a gain of approximately 6.21%. (Detailed in Part 5)
- Market verification of BTC trend forecast: In last week's review, we predicted (as shown in Figure 1) that if "Endpoint 41" could not hold above the lower rail of the channel, the market would likely retest the previous support at $59,100. Current market movements have validated this view.
1. In-Depth Analysis of Bitcoin's Hourly-Level Trend Structure
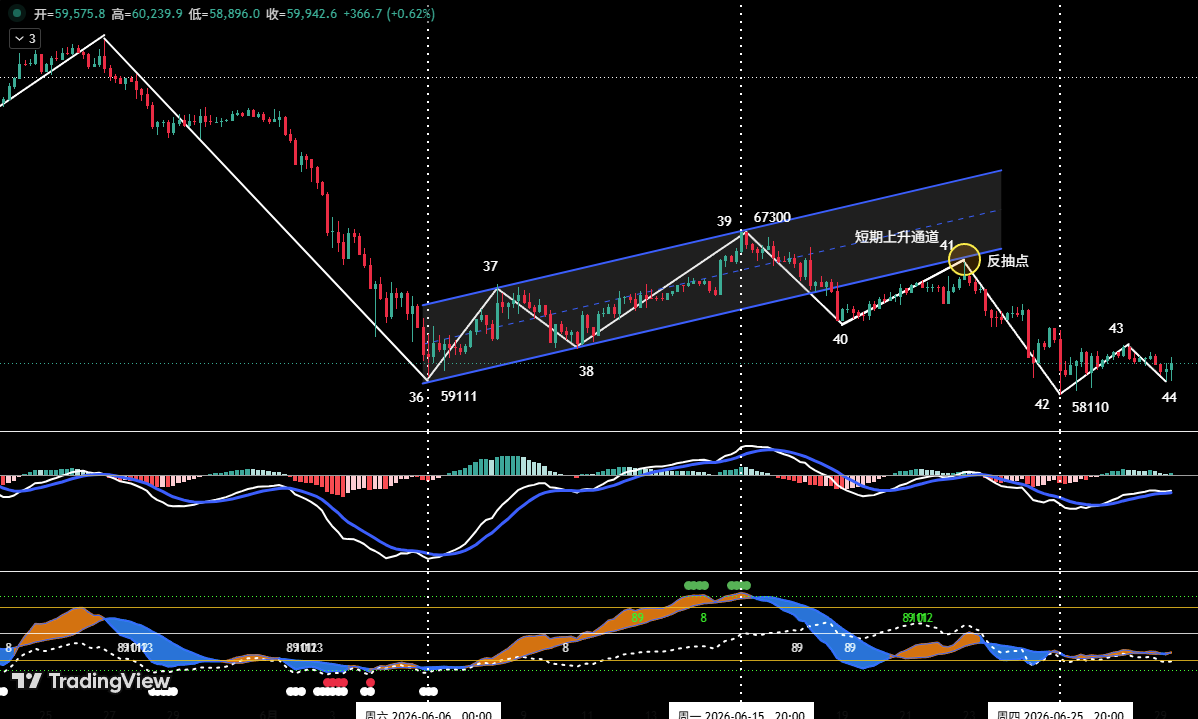 Figure 1 Bitcoin _ 4-hour K-line chart
① As shown in (Figure 1): Last week's review clearly indicated that segment (40-41) was a pullback confirmation below the lower rail of the short-term ascending channel (blue channel). If "Endpoint 41" could not hold back above the lower rail, the trend would weaken, increasing the probability of a retest of the previous support at $59,100. The chart shows that the adjustment last week found short-term support at a low of $58,110.
② From a 4-hour cycle perspective, the oversold rebound that began from the low of $59,100 on June 6 has been confirmed to have ended at "Endpoint 39" ($67,300).
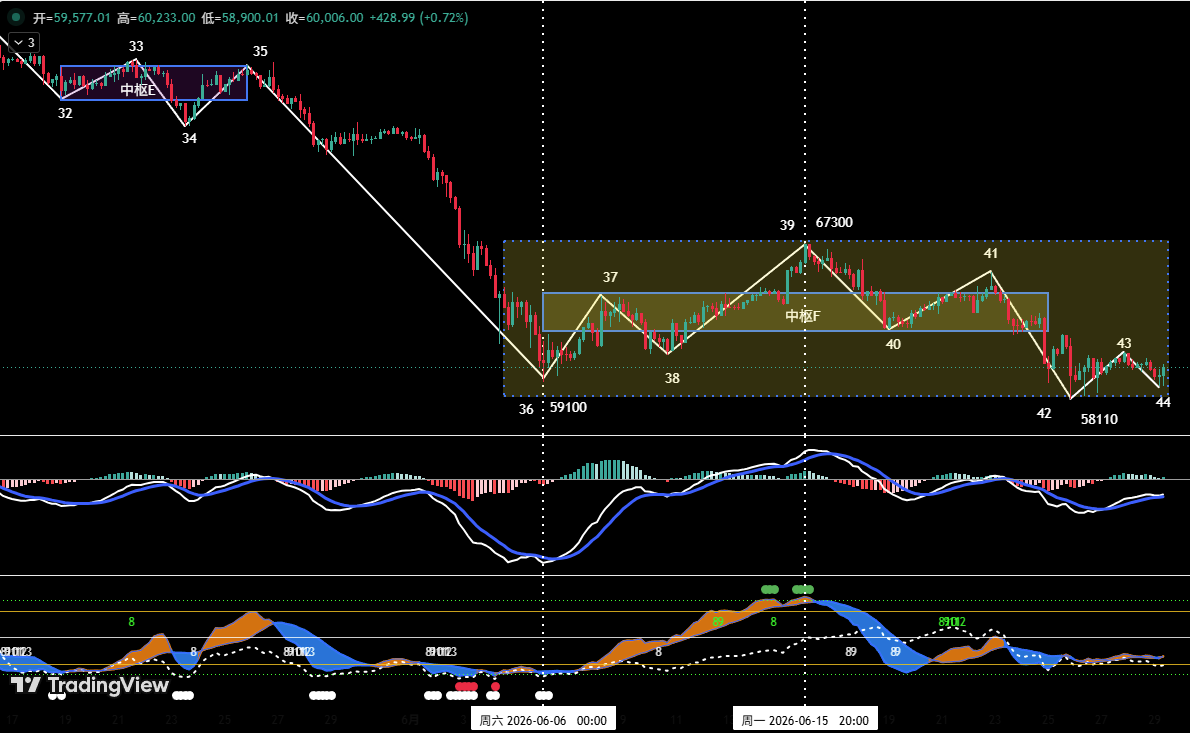 Figure 2 Bitcoin _ 4-hour chart
③ As shown in (Figure 2): Starting from "Endpoint 39," the market has entered a clear 5-wave corrective structure (i.e., Endpoint 39 to Endpoint 44) and is currently in the (43-44) corrective segment.
The final position of "Endpoint 44" will be key for the short-term direction:
- If "Endpoint 44" is above $58,110: A relatively strong technical rebound is expected, likely followed by a wide-range box consolidation.
- If "Endpoint 44" is below $58,110 with a momentum bullish divergence: A rebound is still possible, but its strength needs observation.
- If "Endpoint 44" is below $58,110 without a momentum bullish divergence: After a short-term adjustment, the price may break down further.
④ Summary: Analysis from our proprietary quantitative model suggests that the probabilities of the first two scenarios are relatively higher.
2. Bitcoin's Price Forecast and Trading Strategy for This Week
1. BTC Trend Forecast for This Week
Core View for This Week: Closely monitor the formation of "Endpoint 44." If the first scenario mentioned above occurs, consider light short-term long positions.
2. Key Resistance Levels
- First Resistance Zone: $60,900 – $62,300 area (previous important high/low point)
- Second Resistance Zone: Around $65,500 (previous important resistance area)
- Third Resistance Zone: $67,300 – $69,500 area (previous important resistance area)
3. Key Support Levels
- First Support Level: Around $58,100 (previous important support level)
- Second Support Level: Around $55,000 (previous important support level)
4. Operation Strategy for This Week (excluding sudden news impact)
① Mid-term Strategy
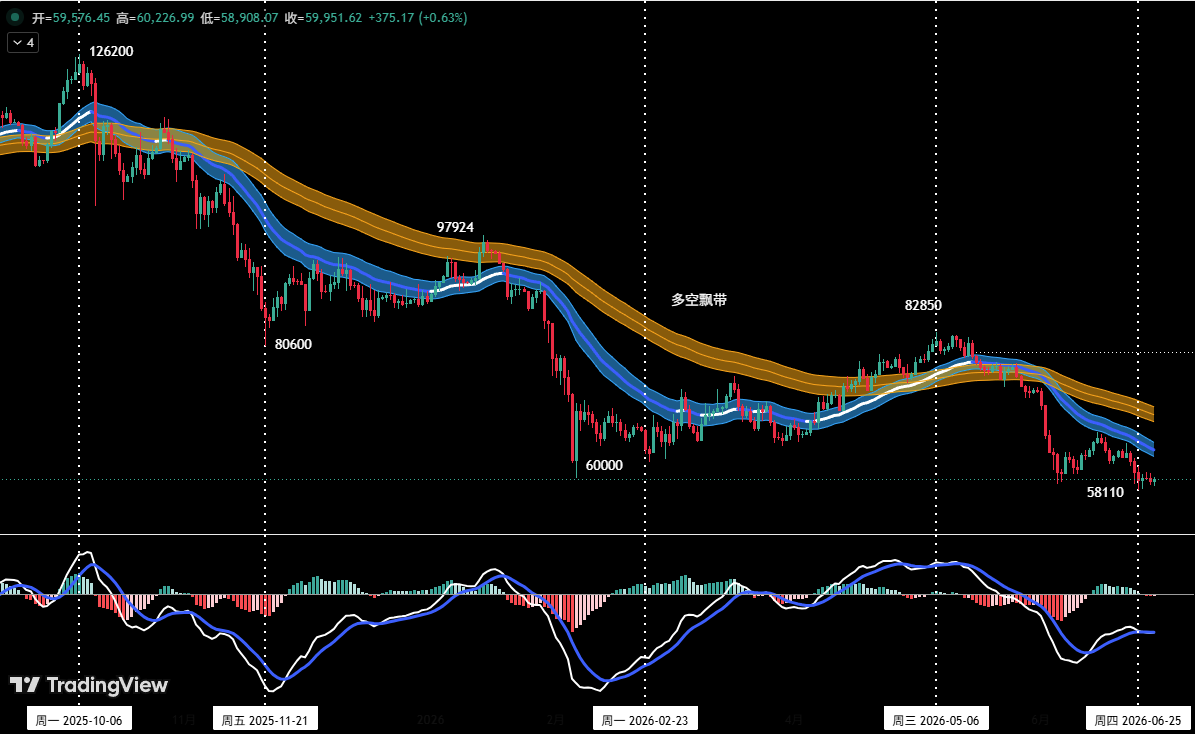 Figure 3 Bitcoin _ Daily K-line chart (Position Monitoring Model)
Position Monitoring Model: As shown in (Figure 3), the current price has effectively broken below the "Long/Short Channel," confirming a shift in market structure to a bearish dominant pattern. Maintain the mid-term short position at around 20%.
② Short-term Strategy
Utilize 30% of the position, set a stop-loss, and look for "spread" opportunities based on support and resistance levels (using the 30-minute/60-minute chart as the operating cycle).
③ A/B/C Three Operation Plans
For dynamic adaptation to complex market changes in short-term trading, we have pre-defined three specific operation plans (A/B/C).
Plan A: Tentative Long Position in Strong Support Zone (Endpoint 44 above $58,110)
- Entry: If the price follows the scenario above and aligns with quantitative model signals, establish a long position of around 15%.
- Risk Control: Set an initial stop-loss.
- Exit: When the price rebounds to a major resistance level and aligns with quantitative model signals, gradually close the position to take profits.
Plan B: Light Short Position in Resistance Zone
- Entry: If the price rebounds to the $60,900 – $62,300 zone and shows signs of resistance, combined with top signals from the quantitative model, establish an initial short position of around 15%.
- Risk Control: Set an initial stop-loss.
- Exit: When the price corrects to a major support level and aligns with model signals, gradually close the position to take profits.
Plan C: Increase Short Position in Strong Resistance Zone
- Add Position: If the price continues to rebound towards the $65,000 or even $67,300 resistance area and shows signs of stagnation, combined with top signals from the quantitative model, consider adding to the short position, keeping it within 30%.
- Risk Control: Set an initial stop-loss.
- Exit: When the price falls to a major support level and aligns with model signals, gradually close the position to take profits.
3. HYPE Hourly-Level Trend Structure Analysis
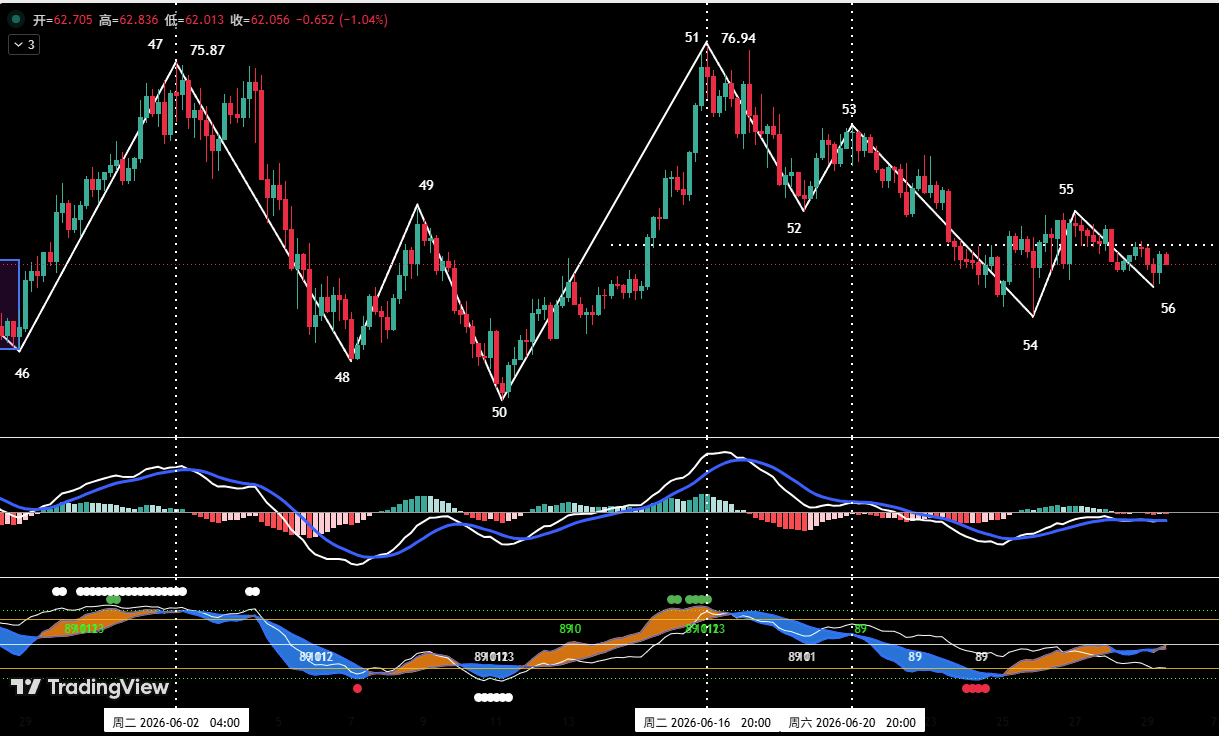 Figure 4 HYPE_4-hour K-line chart
① As shown in (Figure 4), HYPE began its correction from the June 16 high of $76.94 (Endpoint 51). On the 4-hour chart, it can be subdivided into a five-wave corrective structure: segments 51-52, 52-53, 53-54, 54-55, and 55-56. The price is currently in the 55-56 corrective segment, and the position of "Endpoint 56" will be key for the near-term trend.
② Scenario for Short-term Correction End:
- If "Endpoint 56" is higher than "Endpoint 54," it forms a "double bottom" pattern. The current correction is likely to end, and the probability of a rebound from "Endpoint 56" is high.
- If "Endpoint 56" is lower than "Endpoint 54" but forms a momentum bullish divergence, the probability of the correction ending is also relatively high, with a potential rebound.
③ Scenario for Short-term Correction Continuation:
- If "Endpoint 56" is lower than "Endpoint 54" without a momentum bullish divergence, the current correction is likely to extend into a seven-wave corrective structure.
④ Analysis from our proprietary quantitative model indicates a significantly higher probability of the first scenario occurring.
4. HYPE Price Forecast and Short-term Trading Strategy for This Week
1. HYPE Trend Forecast for This Week
Key Resistance Levels:
- First Resistance Level: Around $65.5
- Second Resistance Level: Around $71.5
Key Support Levels:
- First Support Level: Around $58.5
- Second Support Zone: $52 – $54 area
Core View on HYPE This Week: Observe the final formation position and technical pattern of "Endpoint 56."
2. Short-term Trading Strategy for HYPE This Week (Long on Support)
Short-term HYPE trading this week should follow the strategy of "positioning for dips, avoiding chasing rallies."
Short-term Strategy: Tentatively go long on support zone stabilization. When the HYPE price adjusts to above $58.8, or the deeper support zone of $52 – $54, and shows signs of stabilization, combined with bottom signals triggered by the two major models, consider a light long position. Position size must be strictly controlled below 30%, and stop-loss discipline must be adhered to.
5. Review of Bitcoin Short-term Trades
Strictly following the operation plans and based on trading signals from our proprietary "Spread Trading Model" and "Momentum Quantitative Model," we completed two short-term short trades last week, achieving a total trading profit of approximately 6.21%.
1. Short-term Trade 1
Bitcoin short-term trade details (Leverage: 1x):
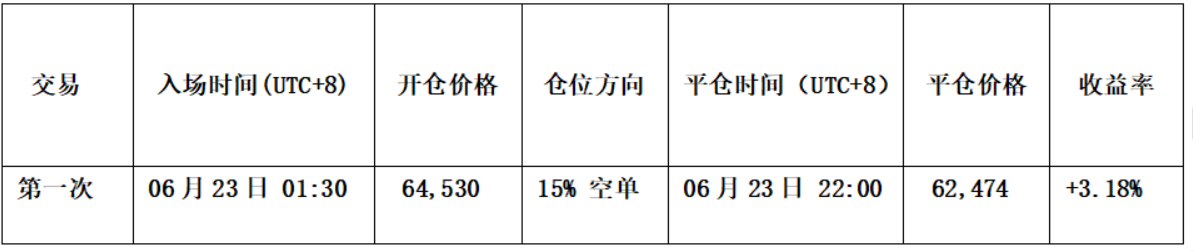 Entry Strategy:
- The price rebounded to near $65,500 but faced resistance and showed pressure signals, with the K-line forming a bearish "Top Divergence" pattern.
- The "Spread Trading Model" triggered a top warning signal (white dot), and the "Momentum Quantitative Model" formed a momentum top divergence signal.
Therefore, we established a 15% short position at $64,530.
Exit Strategy:
- The price fell to near $62,000 and found support, with the K-line forming a "Bottom Divergence" signal.
- The "Spread Trading Model" triggered a strong bottom warning signal (red dot + white dot), forming a bottom resonance signal with the "Momentum Quantitative Model."
Therefore, we closed the entire position near $62,474.
Summary: This trade successfully yielded a profit of approximately 3.18%.
2. Short-term Trade 2
Bitcoin short-term trade details (Leverage: 1x):
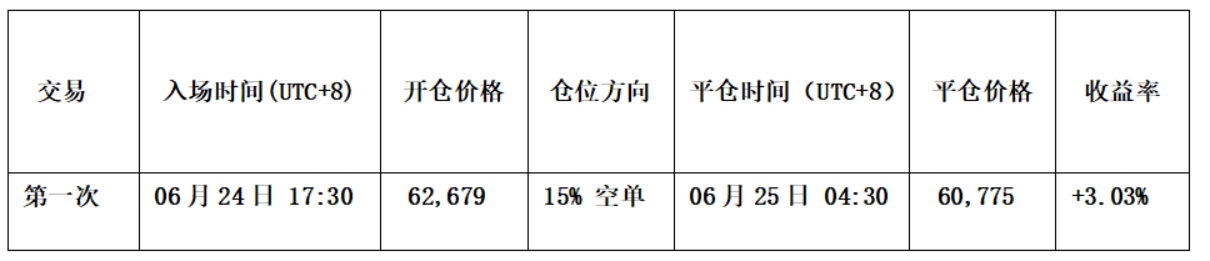 Entry Strategy:
- The price moved to near $63,000. In the "Momentum Quantitative Model," the two momentum lines approached the "zero axis" and showed exhaustion, subsequently forming the first "Death Cross" below the zero axis.
- Simultaneously, the "Spread Trading Model" issued a top warning signal.
Therefore, we established a 15% short position at $62,679.
Exit Strategy:
- The price fell to near $59,000 and found support, with the K-line forming a "Bottom Divergence" signal.
- The "Spread Trading Model" triggered a strong bottom warning signal (red dot + white dot), forming a bottom resonance signal with the "Momentum Quantitative Model."
Therefore, we closed the entire position near $60,775.
Summary: This trade successfully yielded a profit of approximately 3.03%.
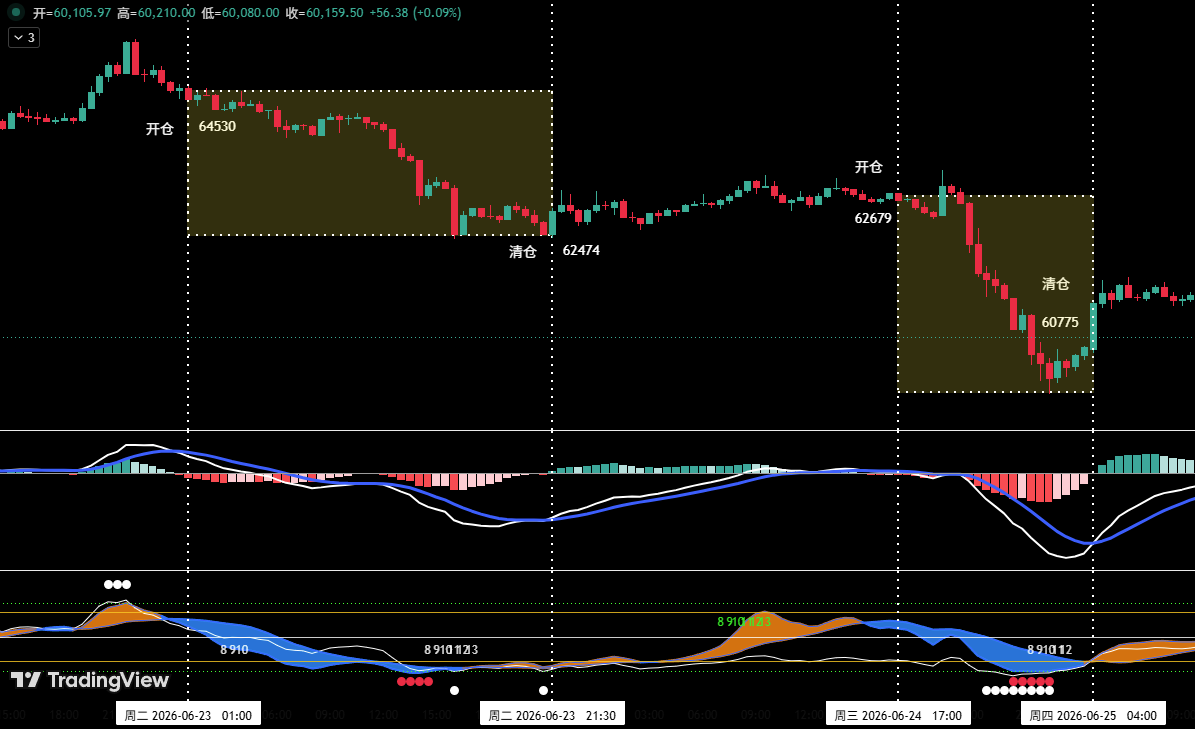 Figure 5·Short-term Trade Illustration
6. Special Reminder
- Upon entry: Immediately set an initial stop-loss.
- When profit reaches 1%: Move the stop-loss to the entry cost price (breakeven point) to protect the principal.
- When profit reaches 2%: Move the stop-loss to the 1% profit level.
- Continuous tracking: For every additional 1% profit thereafter, move the stop-loss by 1% to dynamically protect and lock in profits.
Risk Warning:
Financial markets change rapidly. All market analysis and trading strategies require dynamic adjustments. The views, analytical models, and operation strategies mentioned in this article are derived from personal technical analysis and are intended solely as personal trading logs. They do not constitute any investment advice or trading basis. Markets carry risks. Invest with caution and do not base decisions on this content.


