






Gemini Earnings Breakdown: Credit Cards Take the Lead as Trading Volume Plunges


- Key Takeaways: Gemini's total revenue for Q2 2026 rose 37% year-over-year to $45.475 million, but spot trading volume plummeted 66% year-over-year. Revenue growth was driven by the credit card business becoming the largest revenue source, which no longer relies on trading volume.
- Key Elements:
- Credit card revenue reached $16.178 million, up 231% year-over-year, surpassing exchange platform revenue ($12.497 million, down 38% year-over-year) for the first time.
- Total trading volume fell to $3.8 billion from $11.3 billion in the same period last year, showing a clear divergence between the revenue line and the trading volume curve, as an expanded product mix broadens revenue sources.
- Monthly active trading users increased from 523,000 to 580,000, but the MTU metric includes non-spot businesses such as credit cards, meaning it does not necessarily signal a recovery in spot trading.
- Q2 PPNR stood at $5.457 million, while credit card provisions reached $16.062 million, a gap of $10.605 million, highlighting the high credit costs of this business.
- The proportion of overdue receivables beyond 30 days rose from 3.8% to 9.4%, of which approximately $10 million in provisions is linked to fraudulent accounts opened during Q1 identity verification incidents.
In the latest Q2 earnings report disclosed by Gemini Space Station, a US-listed crypto trading platform, the most striking figure isn't just total revenue climbing to $45.475 million, but also a curve that has almost inverted.
According to Gemini's Q2 2026 earnings press release, this revenue represents a 37% increase year-over-year. However, the platform's spot trading volume has fallen 66% compared to a year ago. Trading volume hasn't returned to the platform, yet revenue on the books keeps growing. Where is the money coming from?
Trading Volume Hasn't Returned — So Where Does the Revenue Come From?
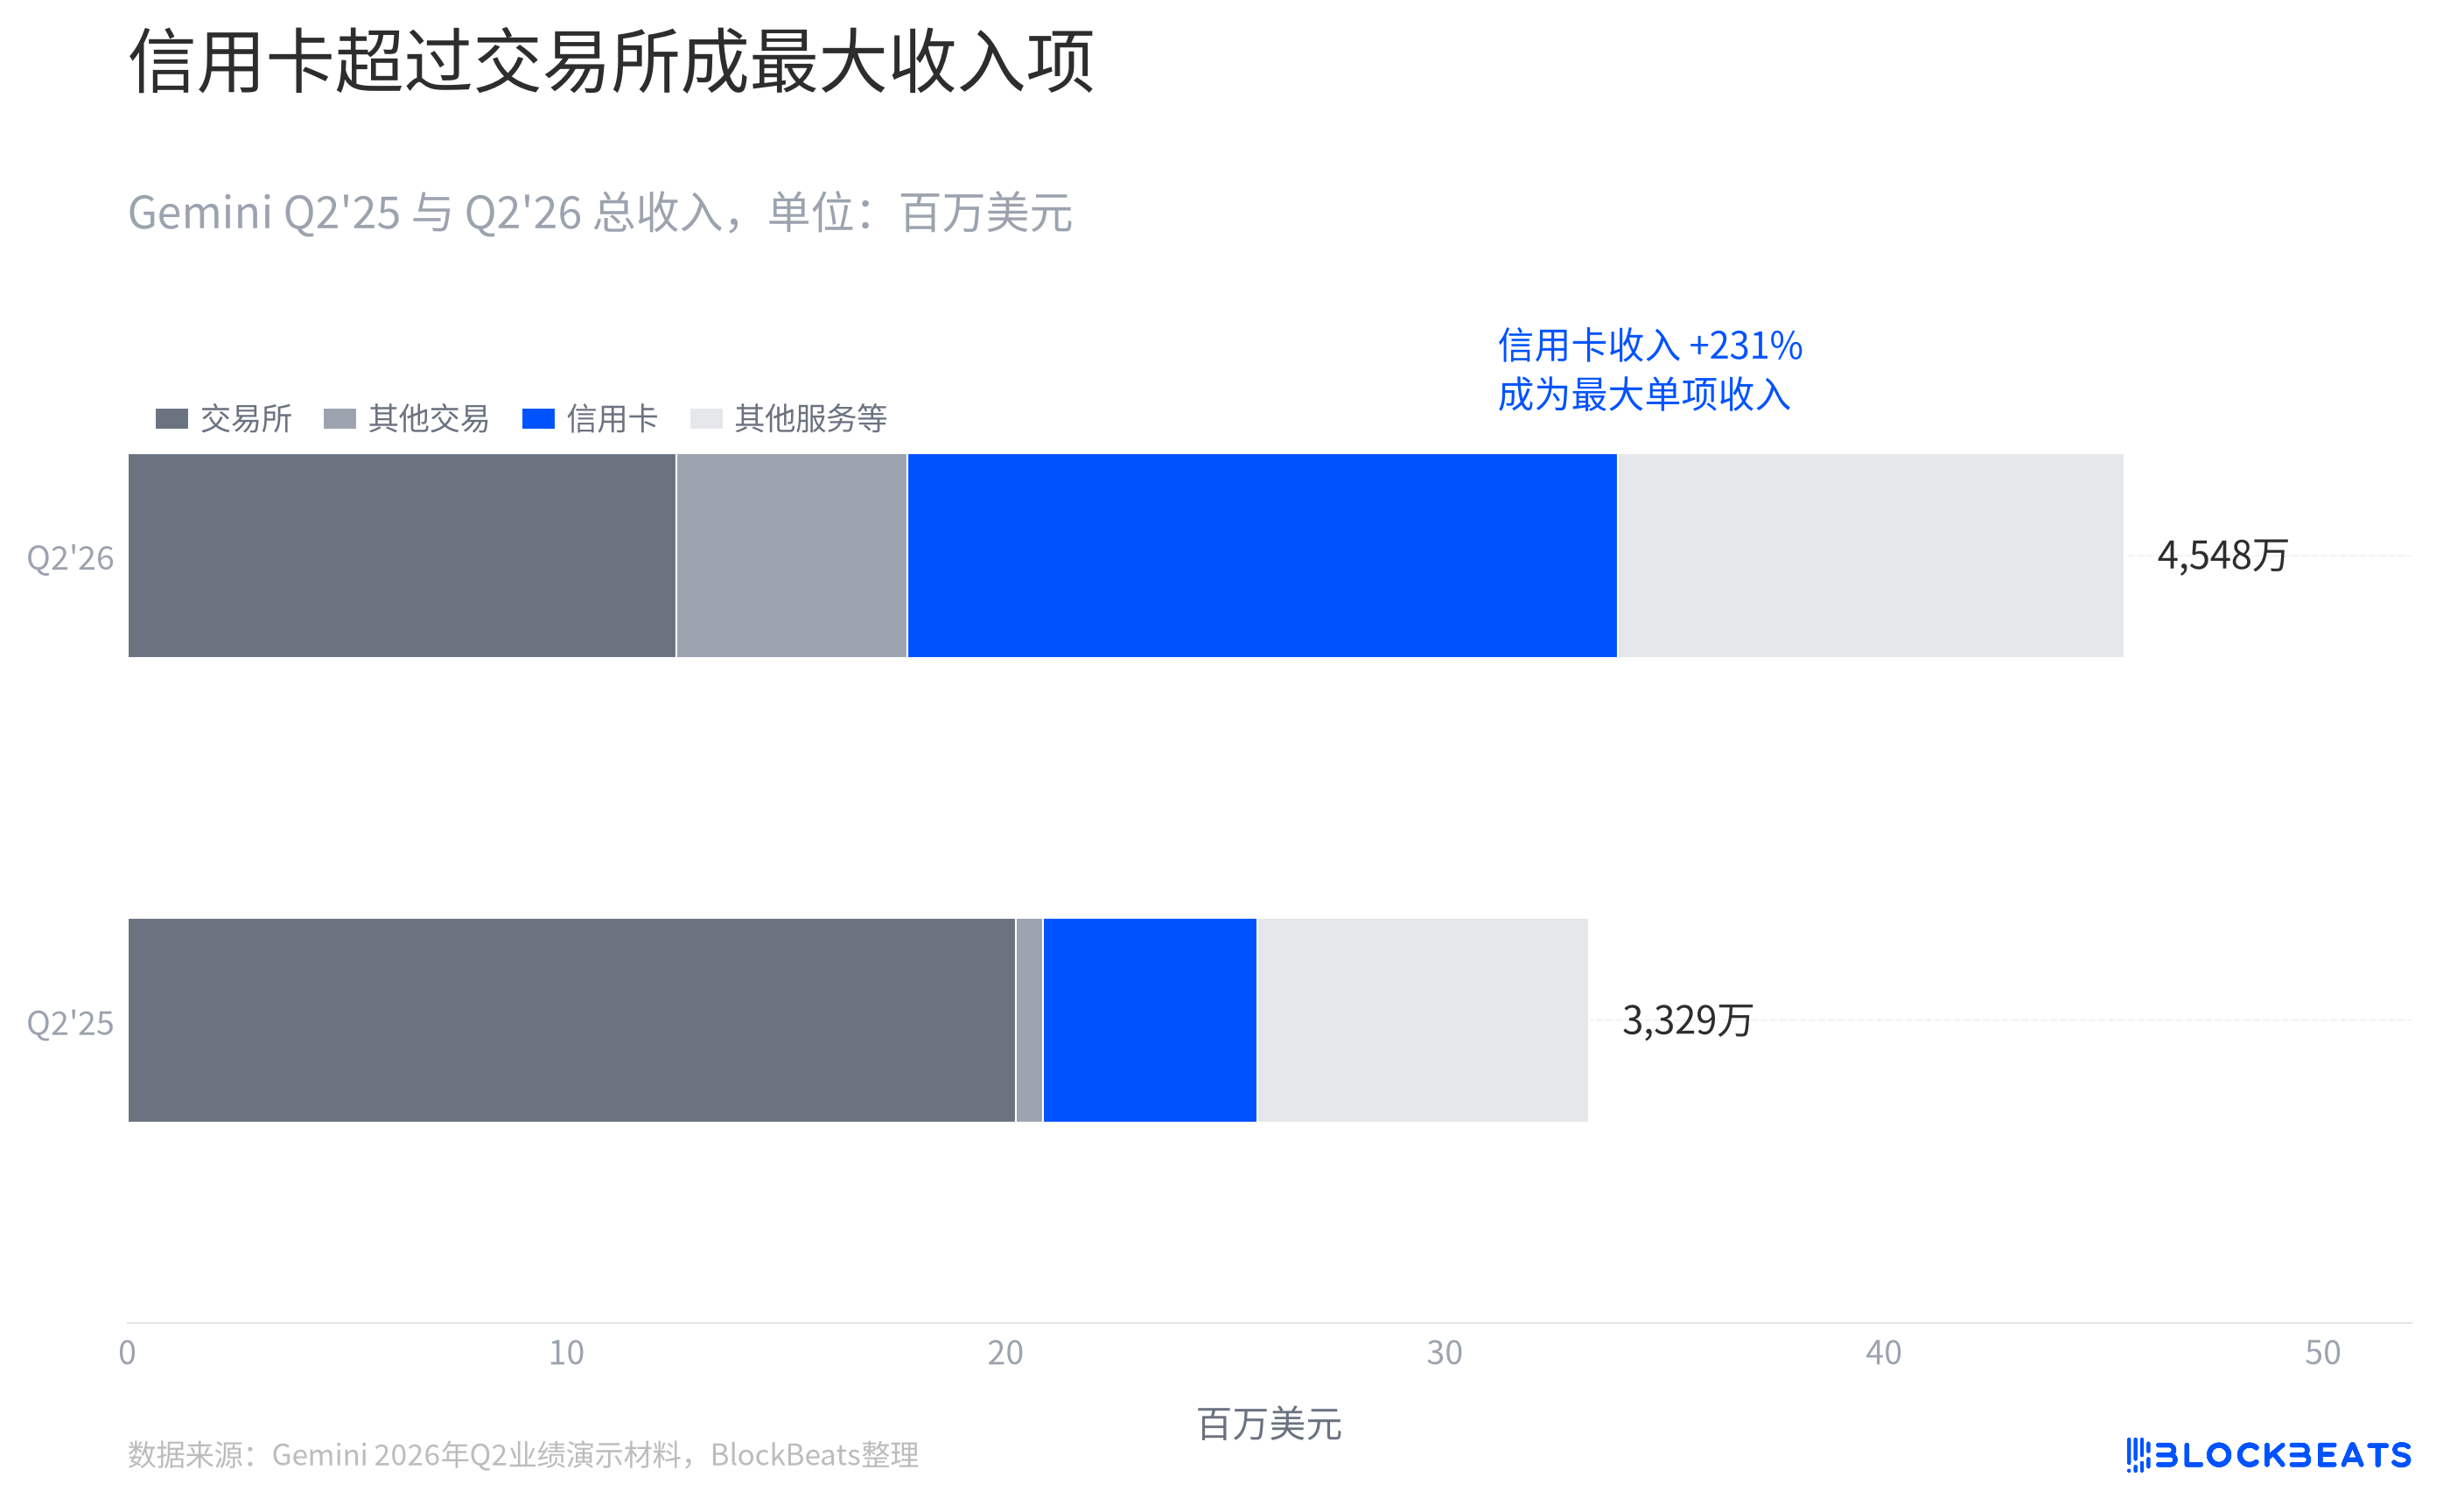
The answer lies first in the revenue structure. According to Gemini's Q2 earnings presentation, credit card revenue has reached $16.178 million, surpassing the $12.497 million from trading platform revenue. For the first time, the blue segment is longer than the gray trading platform revenue bar.
The same earnings presentation shows that a year ago, the positions were reversed. Trading platform revenue stood at $20.233 million, while credit card revenue was only $4.882 million. Gemini still operates spot matching today, but revenue no longer follows trading activity alone.
This shift has been rapid. Credit card revenue grew 231% year-over-year, while trading platform revenue declined 38%, both figures coming from the company's earnings presentation. The former has filled the gap left by the latter, making credit cards the largest single revenue item.
This chart also has an easily overlooked metric nuance. The presentation's reference to service income and interest income accounting for 59.4% of net revenue is based on a net revenue basis, which cannot be directly interpreted as a share of the total revenue stack in the chart. It indicates that revenue sources are broadening, but it cannot independently prove that profitability has improved.
According to the company's earnings presentation, credit card revenue includes both card transaction fees and interest income — a different business from pure trading fees. Its proprietary receivables also mean Gemini must bear the burden of account quality and collection speed.
Revenue and Trading Volume Are No Longer on the Same Curve
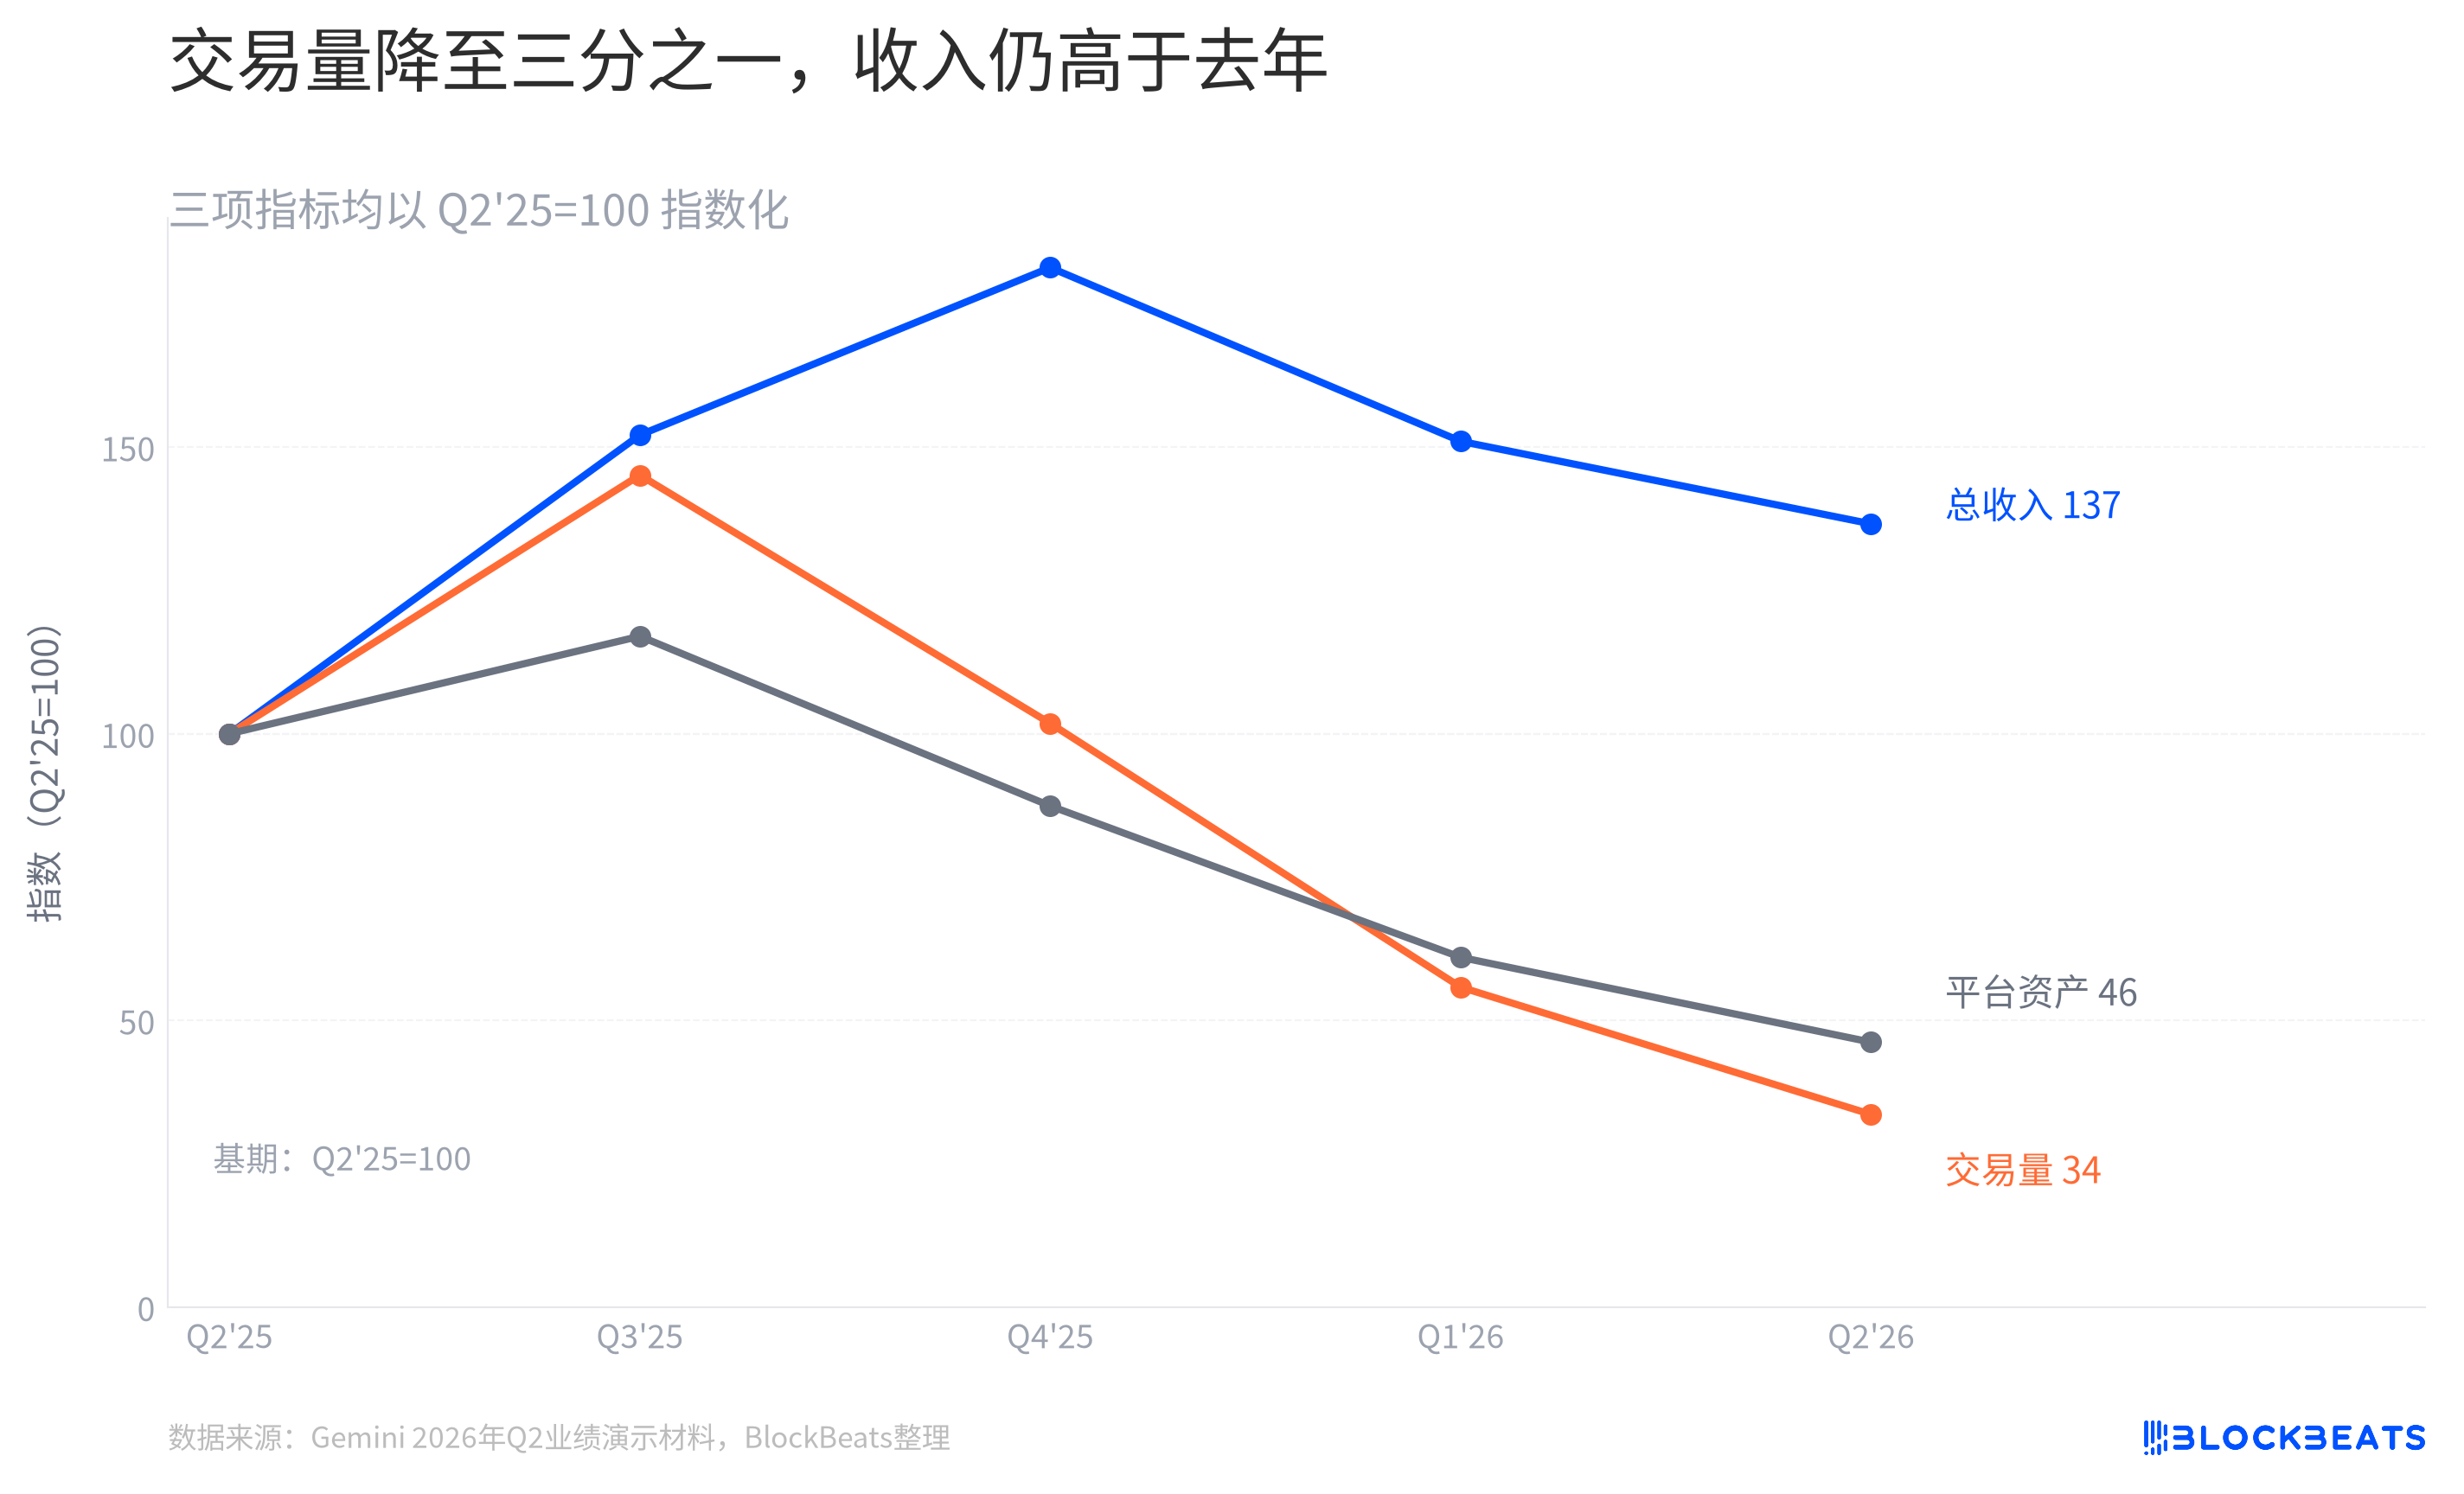
According to the company's earnings presentation, total trading volume in Q2 was $3.8 billion, compared to $11.3 billion a year ago. Looking only at the metric most familiar to trading platforms, Gemini remains in a clear contraction phase.
When placing all three metrics on the same baseline, the divergence in the chart becomes clear. The revenue line, after retreating from its peak, remains above its starting point, while trading volume and platform assets have both declined in tandem. Trading volume is no longer the sole key to explaining Gemini's revenue — the product mix has begun to take over that explanatory role.
The user side shows a similar divergence. According to the company's earnings presentation, monthly active transacting users increased from 523,000 to 580,000. However, the company's MTU definition covers users who engaged in any revenue-generating activity or whose accounts generated income over the past 30 days, including non-spot businesses such as credit cards. It cannot be directly interpreted as evidence that spot trading users remain active.
This is precisely what the product expansion has changed. The platform can now generate revenue from a wider range of interaction types, weakening the explanatory power of the traditional trading volume metric.
However, platform assets are not the company's own money. They include custody, staking, trading products, client fiat custody assets, and GUSD reserves. Treating this line as freely available cash for Gemini, or interpreting the revenue divergence as immunity to crypto cycles, would both overstep the boundaries set by the earnings report.
The shift in revenue structure is real, but a conclusion of cycle-independence is premature. The five quarters in the chart suggest instead that Gemini is breaking up a story once defined by a single trading curve and distributing it across more business lines.
The New Revenue Story Must Be Counted Through Credit Costs
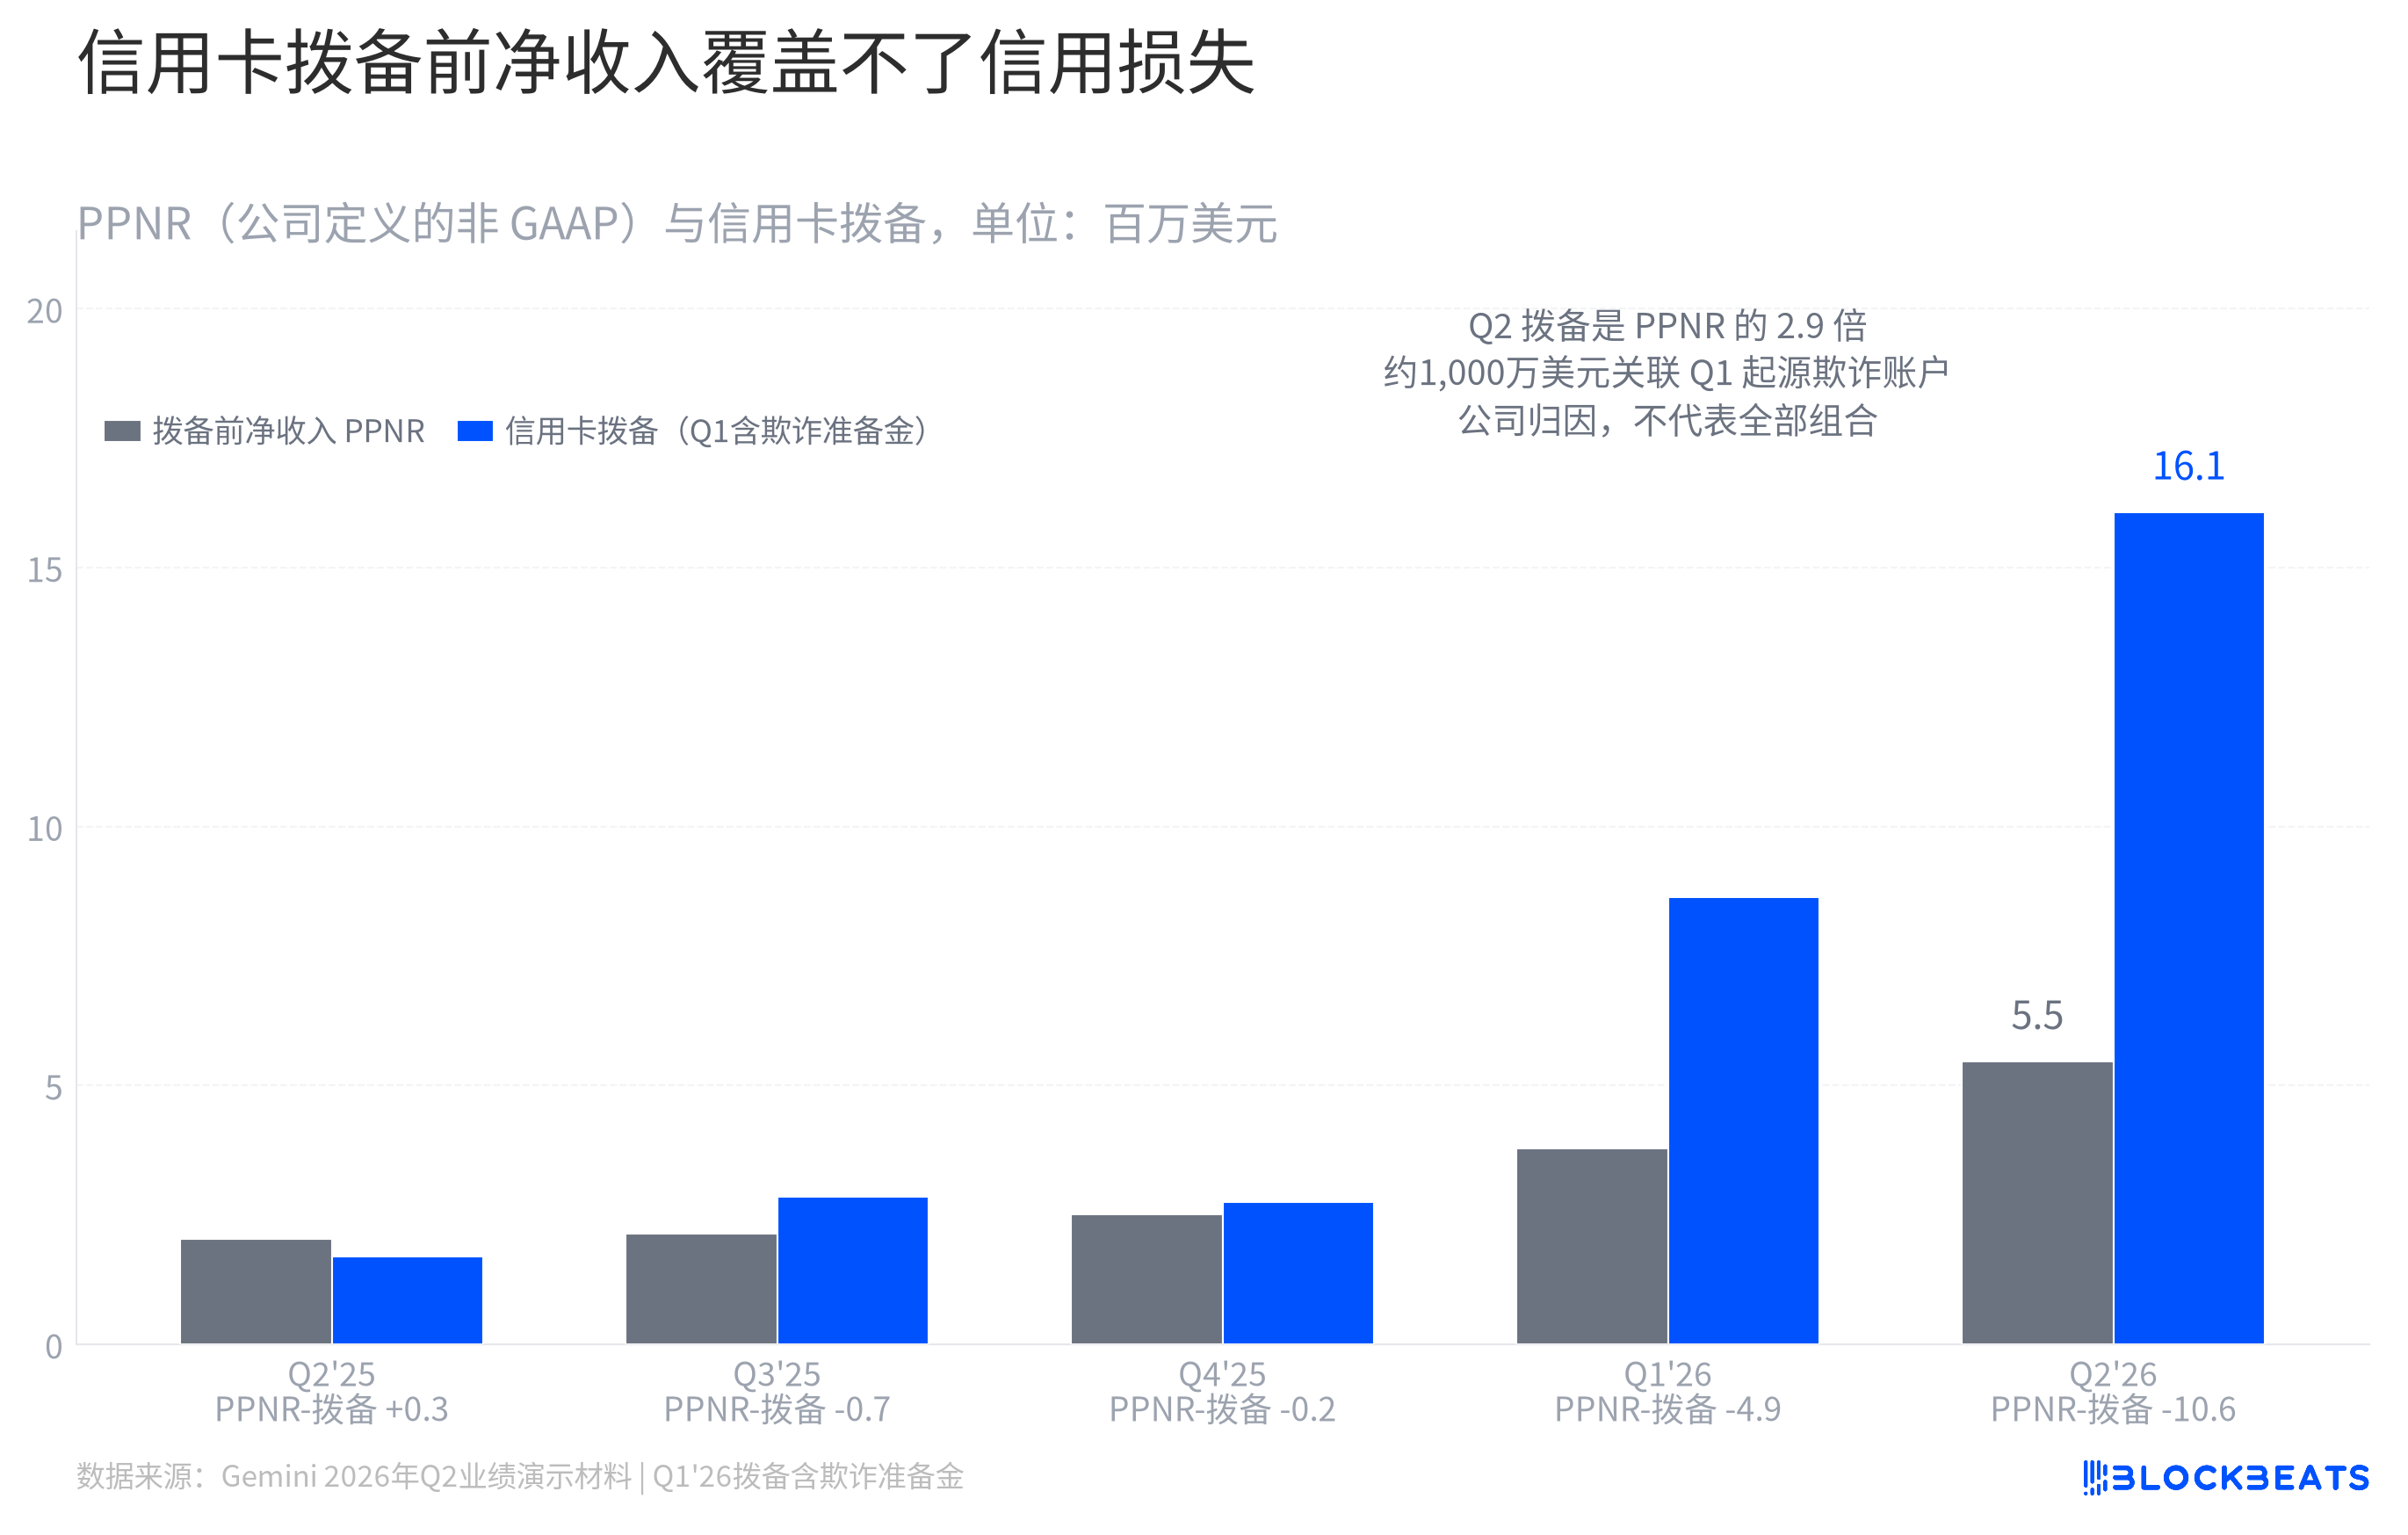
Credit card revenue growth does not mean credit cards are already contributing profits of the same magnitude. According to the company's earnings presentation, the company's non-GAAP metric PPNR is calculated as credit card net revenue less financing debt interest and crypto rewards expenses. In Q2, PPNR was $5.457 million, while the credit card provision was $16.062 million.
Based on the two disclosed metrics, the gap between them is $10.605 million. The label on the second row of the chart's horizontal axis reads "PPNR - Provision," not Gemini's net profit. It answers only a narrower question: whether the credit card business's net revenue before credit costs is sufficient to cover this provision.
According to the company's press release, approximately $10 million of the provision is related to a batch of accounts opened in Q1 involving identified identity fraud activity. This is management's attribution for a specific account cohort and should not be extrapolated as widespread bad debt across the entire card portfolio.
But the qualifiers do not erase the risk-control pressure. The proportion of receivables past due by more than 30 days rose from 3.8% in the previous quarter to 9.4%, as disclosed in the company's earnings presentation. For a business that has just become the largest revenue source, the revenue curve and the credit cost curve now need to be examined together.
Gemini's revenue sources have multiplied, and the operating variables supporting that revenue have extended from trading activity to credit costs and risk management.





