
BTC's Three Post-Market Scenarios and a Clash of Two Strong Forces | Expert Analysis
- Core Thesis: Based on Elliott Wave Theory and multi-timeframe technical analysis, this article projects the trajectories of BTC and HYPE. It posits that BTC is currently at a critical decision point, while HYPE needs to focus on breaking through the $45.76 resistance level. Accordingly, it provides specific trading strategies and risk control plans.
- Key Elements:
- BTC's daily chart adjustment structure presents three projections: A new upward wave starting (bullish view), a complex five-wave correction (bearish view one), and a larger-scale correction (bearish view two). Among these, Projection Two is considered a low-probability event due to excessive time extension in the D wave.
- The core focus for BTC this week is the 4-hour level pivot zone C (approximately $75,000 - $78,500). Holding above the upper boundary would signal continued consolidation, while breaking below the lower boundary could initiate a daily-level adjustment.
- The short-to-medium-term strategy for BTC is clear: Maintain a neutral stance on the medium term. For the short term, use 30% of capital to go long above $78,500 - $79,500 or go short below $73,500 - $75,000, with strict stop-losses in place.
- The HYPE daily chart shows a seven-segment structure, with segments 1-2, 2-3, and 3-4 forming a "bullish pivot." The core focus this week is whether the price can break through the previous high of $45.76 to confirm the continuation of the upward structure.
- The short-term HYPE strategy revolves around the pivot's upper and lower bounds ($38.41 and $34.44). Go long when the price pulls back to and stabilizes at the support level; go short if the support level is effectively broken. Position size should be controlled below 30% in both cases, with strict adherence to stop-losses.
The market never lies; it only remains silent.
As prices hover within a critical range, both bulls and bears are awaiting a decisive answer.
Over the past week, Bitcoin completed the anticipated wide-range consolidation within the core area of $79,500 to $80,600, confirming the validity of our previous technical analysis. But validation is just the starting point; the real game begins this week.
BTC's daily-level adjustment structure now stands at a crossroads with three potential paths: Is this the start of a new upward wave, or merely a relay leg within a larger-scale correction? Wave analysis can provide a framework, but the market ultimately votes with price. For HYPE, a clear seven-segment structure is identifiable, and whether it breaks through the $45.76 level will be the most critical variable to watch this week.
In this week's article, we will continue to analyze from a multi-timeframe perspective, sorting out structures, judging directions, and formulating plans. Strategies are prepared; the rhythm is maintained.
Core Trading Thesis Summary for This Week:
• Analysis of BTC’s multi-timeframe structure (details in Part 1)
• BTC price forecast for this week and medium/short-term trading strategies (details in Part 2)
• Analysis of HYPE’s daily-level trend structure (details in Part 3)
• HYPE price forecast for this week and short-term trading strategies (details in Part 4)
Market Validation of Last Week's Trading Strategy and Core Views:
• Market validation of BTC price forecast: In last week's article, we highlighted focusing on the battle between bulls and bears over the core $79,500 to $80,600 area, predicting a high probability of wide-range consolidation. Current market movements have largely confirmed our earlier assessment.
1. Analysis of Bitcoin's Multi-Timeframe Structure
1.1 BTC Daily-Level Structure Analysis: (Three wave count projections for BTC's subsequent movement)
Bitcoin Daily Candlestick Chart:
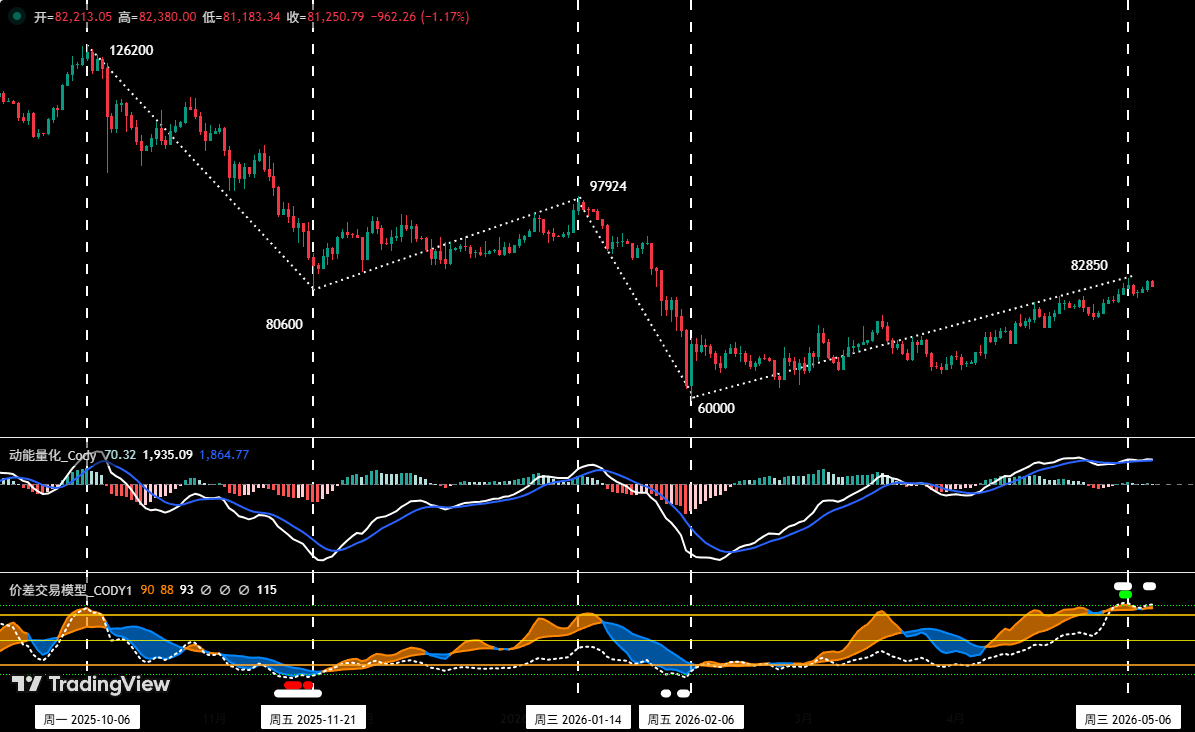
Figure 1
As shown in Figure 1, since hitting the $126,200 high in October 2025, Bitcoin has entered an adjustment cycle lasting approximately 7 months (216 days). Current market sentiment shows significant divergence regarding the subsequent path. The bearish view suggests the downtrend hasn't ended; after the recent rebound concludes, prices will continue adjusting and break below the $60,000 low. The bullish view argues that the correction starting from $126,200 ended at $60,000, marking a trend reversal, and the rebound since February is the start of a new upward trend. Next, based on Elliott Wave Theory rules, we will sort out this daily adjustment structure and propose three technical projections for your reference.
① Projection 1: Correction Complete, New Upward Wave Initiated (Bullish View)
This view posits that the daily-level correction from the previous high of $126,200 completed a clear A-B-C three-wave structure, with Wave C ending at $60,000. The market is currently in Major Wave I (the initiating upward wave).
• Wave A (Down): $126,200 (2025-10-06) to $80,600 (2025-11-21), lasting 46 days, max decline of ~36%.
• Wave B (Up): $80,600 (2025-11-21) to $97,924 (2026-01-14), lasting 54 days, max gain of ~21.5%.
• Wave C (Down): $97,924 (2026-01-14) to $60,000 (2026-02-06), lasting 23 days, max decline of ~38.7%.
• Major Wave I (Up): From $60,000 (2026-02-06) to present, running for 94 days, max gain of ~38.1%, still ongoing.
• Potential Major Wave II (Correction): The corrective wave expected after Major Wave I ends, its low will not break below $60,000.
② Projection 2: Complex Five-Wave Corrective Structure, Currently in D-Wave Rebound (Bearish View 1)
This view proposes that the daily-level correction from $126,200 might complete an A-B-C-D-E five-wave structure, with the market currently in the D-wave rebound.
• Wave A (Down): $126,200 (2025-10-06) to $80,600 (2025-11-21), lasting 46 days, max decline of ~36%.
• Wave B (Up): $80,600 (2025-11-21) to $97,924 (2026-01-14), lasting 54 days, max gain of ~21.5%.
• Wave C (Down): $97,924 (2026-01-14) to $60,000 (2026-02-06), lasting 23 days, max decline of ~38.7%.
• Wave D (Up): From $60,000 (2026-02-06) to present, running for 94 days, max gain of ~38.1%, still ongoing.
• Potential Wave E (Down): The corrective wave expected after the D-wave rebound ends, its low could break below $60,000.
③ Projection 3: Larger Degree (e.g., Weekly) Corrective Structure, Currently in B-Wave Rebound (Bearish View 2)
This view suggests the daily-level correction from $126,200 might form a larger-degree A-B-C three-wave correction, with the market currently in a B-wave rebound.
• Wave A (Down): $126,200 (2025-10-06) to $60,000 (2026-02-06), lasting 112 days, max decline of ~52.5%.
• Wave B (Up): From $60,000 (2026-02-06) to present, lasting 94 days, max gain of ~38.1%, still ongoing.
• Potential Wave C (Down): The corrective wave expected after the B-wave rebound ends, its low could break below $60,000.
④ Summary:
• From the perspective of Elliott Wave time rules and structural harmony, in Projection 2, Waves B and D are corrective waves of the same degree. However, the current D-wave rebound period (94 days) has significantly exceeded the B-wave rebound period (54 days). This excessive extension in time for the D-wave has destroyed the balance of the wave structure, significantly reducing the probability of this projection occurring.
• Based on the above analysis, excluding Projection 2, the probabilities for Projection 1 (Bullish) and Projection 3 (Bearish) correspondingly increase. Determining which has a higher probability involves a more comprehensive assessment of multiple dimensions, which we will delve into in next week's review.
2. In-depth Analysis of BTC's Hourly Level Structure: (Analyzing on the 4-hour timeframe)
Bitcoin 4-Hour Candlestick Chart
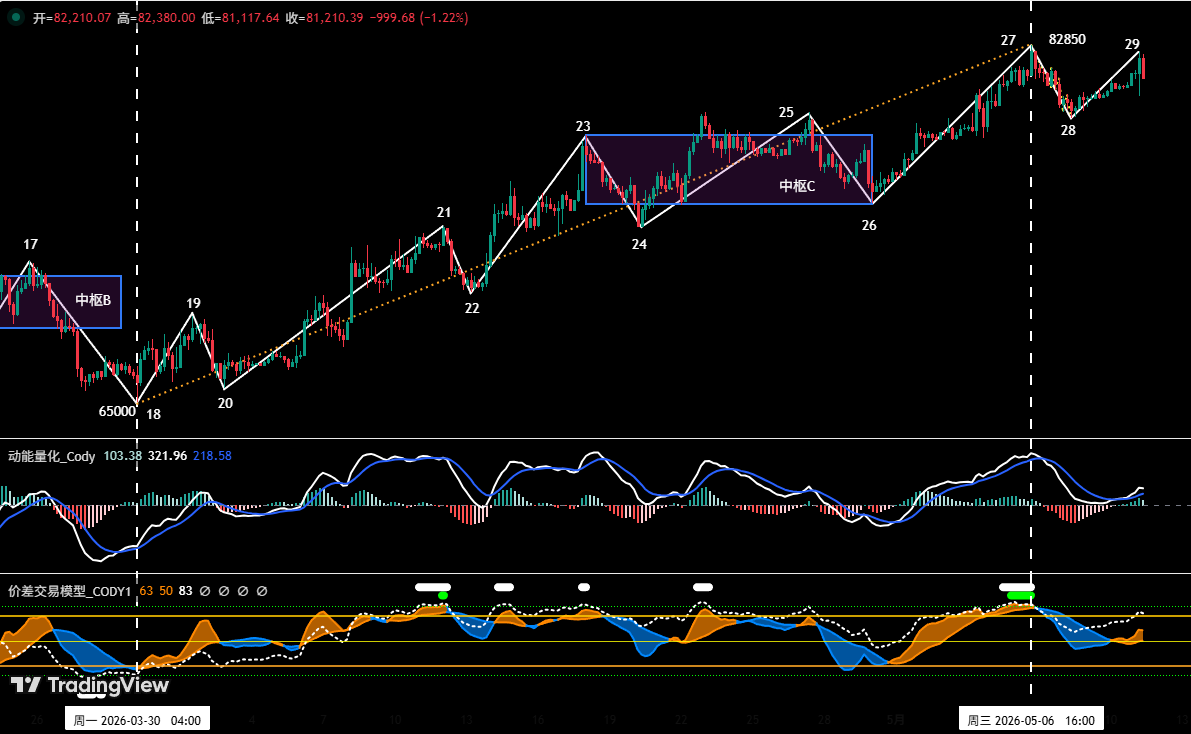
Figure 2
As shown in Figure 2, the price is currently above the central pivot C, moving within segments 28-29.
• If the price effectively establishes support above the upper boundary of pivot C (approx. $78,500), it maintains a high-range consolidation pattern.
• If the price effectively breaks below the lower boundary of pivot C (approx. $75,000), the daily-level correction might commence.
2. Bitcoin Price Forecast and Trading Strategies for This Week
2.1 BTC Price Forecast for This Week:
This week's core view: The key is observing the battle between bulls and bears over the upper and lower boundaries of pivot C. The outcome regarding this zone serves as a crucial basis for judging whether the price can continue its rebound or reverse downward.
2.2 Key Resistance Levels:
• First Resistance Zone: $83,500 ~ $84,500 (Previous dense trading zone)
• Second Resistance Zone: $89,000 ~ $90,500 (Previous consolidation platform)
2.3 Key Support Levels:
• First Support Zone: $78,500 ~ $79,500 (Near pivot upper boundary)
• Second Support Zone: $73,500 ~ $75,000 (Previous key support)
• Third Support Zone: $69,500 ~ $70,500 (Previous key support)
2.4 Trading Strategy for This Week (excluding sudden news impacts)
① Medium-term Strategy:
Bitcoin Daily Candlestick Chart: (Position Sizing Model)
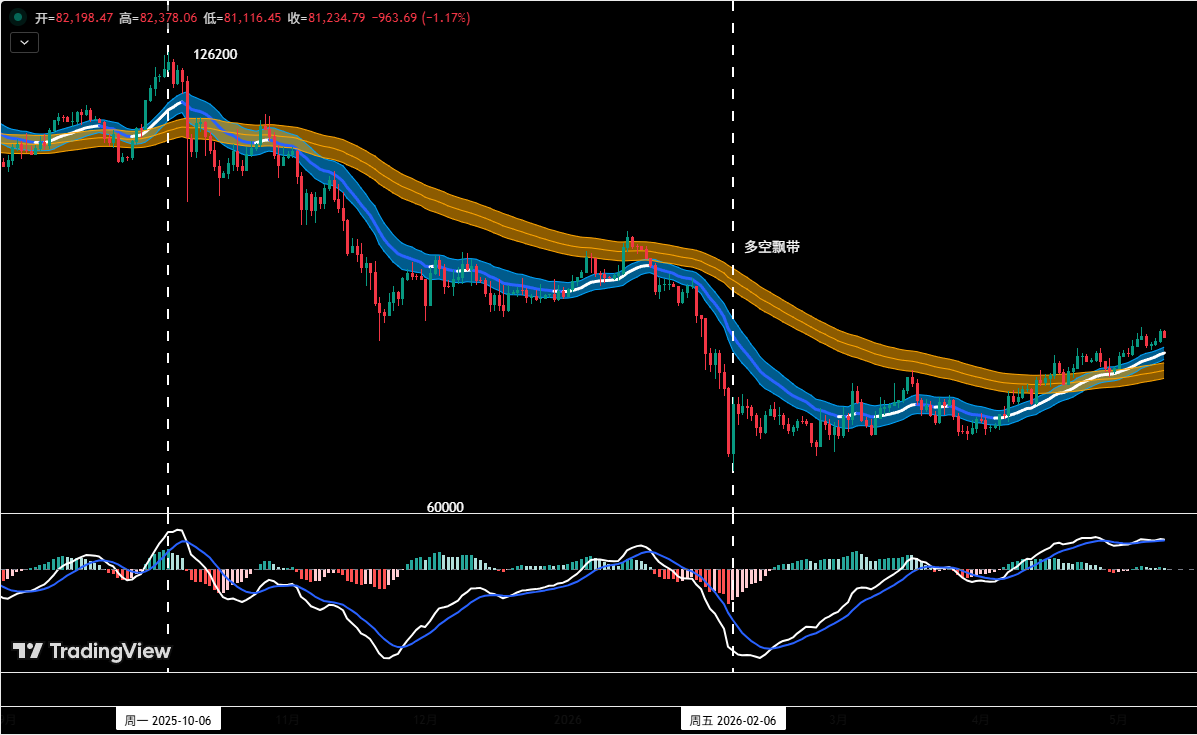
Figure 3
Position Sizing Model: As shown in Figure 3, based on trading rules, the medium-term direction is not yet clear. This week, maintain a cash position for medium-term views, patiently waiting for a clear direction before entering, and avoid chasing highs or selling lows.
② Short-term Strategy: Use 30% of capital with a stop-loss, seeking "spread" opportunities based on support and resistance levels (using the 30-minute/60-minute chart as the operating timeframe).
③ For short-term operations, to dynamically navigate complex market developments, we have prepared A/B two specific action plans in advance.
• Plan A: Effectively hold support, follow the trend and go long on dips.
• Entry: When the price effectively holds above the $78,500 ~ $79,500 zone, combined with a bottom signal from quantitative models, establish a long position of up to 20% of capital.
• Risk Control: Set initial stop-loss below $78,500.
• Exit: When the price approaches a key resistance level combined with model signals, gradually close the position to take profits.
• Plan B: Effectively break support, sell short on bounces.
• Entry: When the price effectively breaks below the $73,500 ~ $75,000 support zone combined with a top signal from models, establish a short position of up to 30% of capital.
• Risk Control: Set initial stop-loss above $76,500.
• Exit: When the price drops to a key support level combined with model signals, gradually close the position to take profits.
3. Analysis of HYPE's Daily Trend Structure
HYPE Daily Candlestick Chart
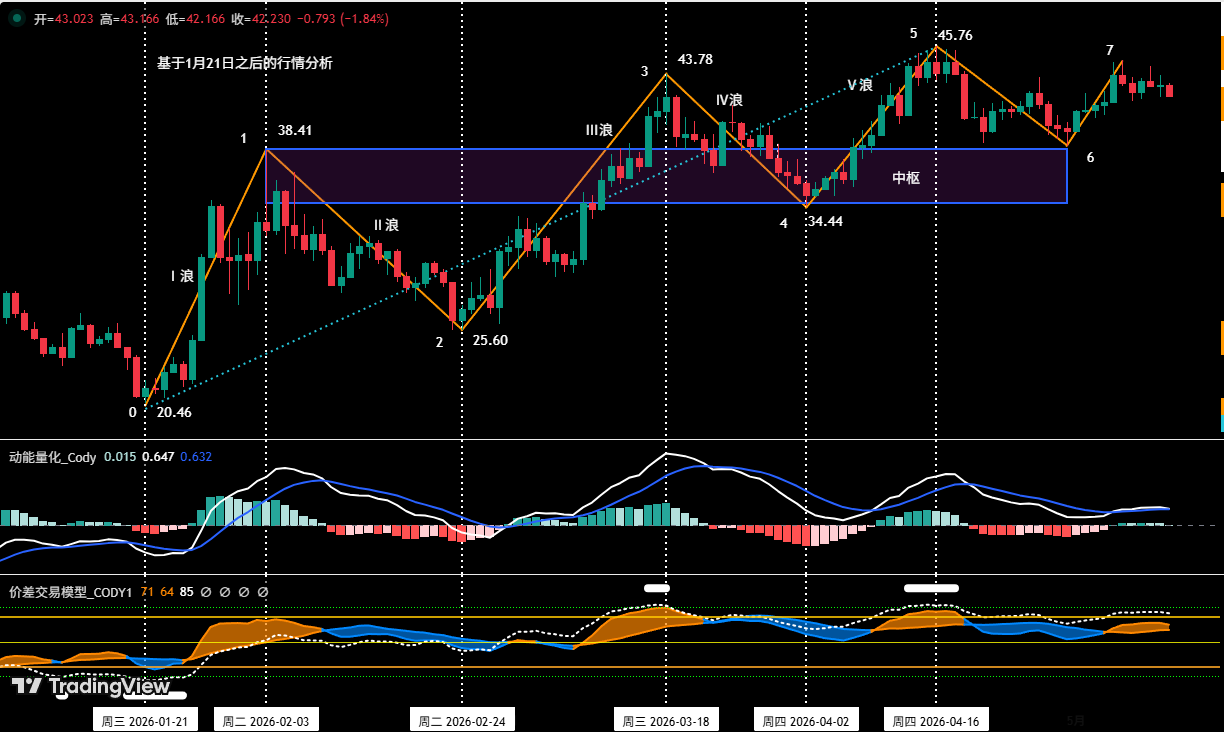
Figure 4
1. As shown in Figure 4, the bullish move starting from HYPE's low of $20.46 on January 21 can be divided into a seven-segment structure on the daily chart: 0-1, 1-2, 2-3, 3-4, 4-5, 5-6, 6-7. The first five segments saw price making higher highs, forming a rising consolidation structure. In the last two segments, because endpoint 7 ($44.79) is lower than endpoint 5 ($45.76), it is tentatively considered a corrective structure.
2. Figure 4 shows that segments 1-2, 2-3, and 3-4 overlap with each other, collectively forming an "upward pivot zone".
4. HYPE Price Forecast and Short-Term Trading Strategy for This Week
4.1 HYPE Price Forecast for This Week:
This week's core view for HYPE:
• Focus on whether the price can break through the previous high of $45.76 in subsequent movements. If it does, the current trend likely remains within the daily-level upward structure.
• Monitor the battle between bulls and bears near the upper and lower boundaries of the pivot zone.
4.2 HYPE Short-Term Trading Strategy for This Week:
• This week's short-term strategy will be formulated around the gains and losses at two key price levels: the pivot upper boundary ($38.41) and the pivot lower boundary ($34.44).
• Long Strategy: If the price retraces to around $38.41, finds support, and shows signs of stabilization, combined with bottom signals triggered by our two major models, consider a light long position. Position size must be controlled below 30%, strictly adhering to stop-loss rules.
• Short Strategy: If the price effectively breaks the support near $34.44, combined with top signals triggered by our two major models, consider a light short position. Position size must be controlled below 30%, strictly adhering to stop-loss rules.
5. Special Reminder:
1. On Entry: Immediately set the initial stop-loss.
2. At 1% Profit: Move the stop-loss to the entry cost (break-even point) to protect capital.
3. At 2% Profit: Move the stop-loss to the 1% profit level.
4. Continuous Tracking: For every additional 1% gain in price, correspondingly move the stop-loss by 1% to dynamically protect and lock in profits.
Financial markets are highly volatile; all market analyses and trading strategies require dynamic adjustment. All views, analytical models, and operational strategies mentioned herein are derived from personal technical analysis, intended solely as a personal trading journal. They do not constitute any investment advice or operational basis. The market carries risks; investment should be cautious. Do not make decisions based solely on this.


