
When Bitcoin Returns to the 60k Range: What Signals Is the Market Awaiting After an Oversold Decline? | Guest Analysis
- Core View: Based on technical analysis, the article argues that Bitcoin's correction since the October 2025 high exhibits a three-wave A-B-C structure, and it is currently in the main declining phase of wave C. While a short-term oversold rebound is possible, the medium-term downtrend is not yet over, with $60,000 being a key support level.
- Key Elements:
- Structural Analysis: This correction is divided into wave A (down 36%), wave B (rebound 21.5%), and wave C (current, down 38.7%). Wave C is highly likely to complete with a three-part internal structure.
- Strategy Validation: The author's short-term operations last week (two trades) yielded a cumulative profit of 10.72%. The medium-term short position (entered at $89,000) is held with a profit of approximately 20.97%, validating the effectiveness of the bearish strategy.
- Technical Indicators: The weekly chart remains in a bearish trend, but bearish momentum shows signs of weakening. The daily chart has triggered a short-term bottom warning signal, suggesting a short-term rebound may have already begun.
- Key Levels: This week, watch the $60,000 support. Key resistance zones above are at $72,000-$74,500 and $80,000-$80,600.
- Operation Plan: Maintain a 60% medium-term short position. For short-term trading, plan to establish short positions for swing trading based on model signals when encountering resistance at $74,500-$75,200 or $80,000-$80,600.
Shortly after the conclusion of last week's report, Bitcoin once fell to around $60,000. Many friends sent me private messages expressing concern about Bitcoin's future trajectory. For investors who had positioned themselves around $80,000 or earlier, the pressure from paper drawdowns is self-evident, an emotion I can fully understand—we have all experienced similar moments to varying degrees in different cycles. Anxiety, helplessness, and even the choice to give up.
But it is precisely at such stages that emotions can become a greater source of risk than direction. Rather than being led by short-term volatility, it's better to stabilize your mindset and re-examine your positions and timing. Because moving forward, the market does not rule out the possibility of a phased rebound, and such fluctuations themselves often provide investors with a window for proactive adjustment: By gradually reducing risk exposure, or through more flexible and rapid swing trading, one can gradually average down costs, alleviate pressure, and face upcoming uncertainties with greater composure.
I hope my article can provide some new perspectives when you feel confused and uncertain:

Core Summary of the Trading Weekly Report:
• Analysis of the internal structure subdivision of the decline Wave C triggered since January 14th. (Detailed explanation in Figure 1)
• Strategy Execution (Short-term) Performance Verification: Last week's trading strictly followed the established short-term strategy, completing a second short-term operation (1x leverage) and successfully achieving a cumulative return of approximately 10.72%.
• Strategy Execution (Mid-term) Performance Verification: Last week followed the established mid-term strategy, continuing to hold the short position established at $89,000 (1x leverage). As of last week's close, the profit was approximately 20.97%, with a maximum profit during the period of about 32.58%.
• Core View (Short-term) Verification: Last week, under the pattern of bearish resonance on weekly and daily charts, the price successively broke through multiple support levels, ultimately finding support near $60,000. The market movement aligned with our previous expectations for a Wave C correction.
The following sections will provide a detailed review of market predictions, strategy execution, and specific trading processes.
1. Analysis of Bitcoin's Correction Structure and Projection of Future Wave C Movement Structure
Bitcoin Daily K-line Chart:
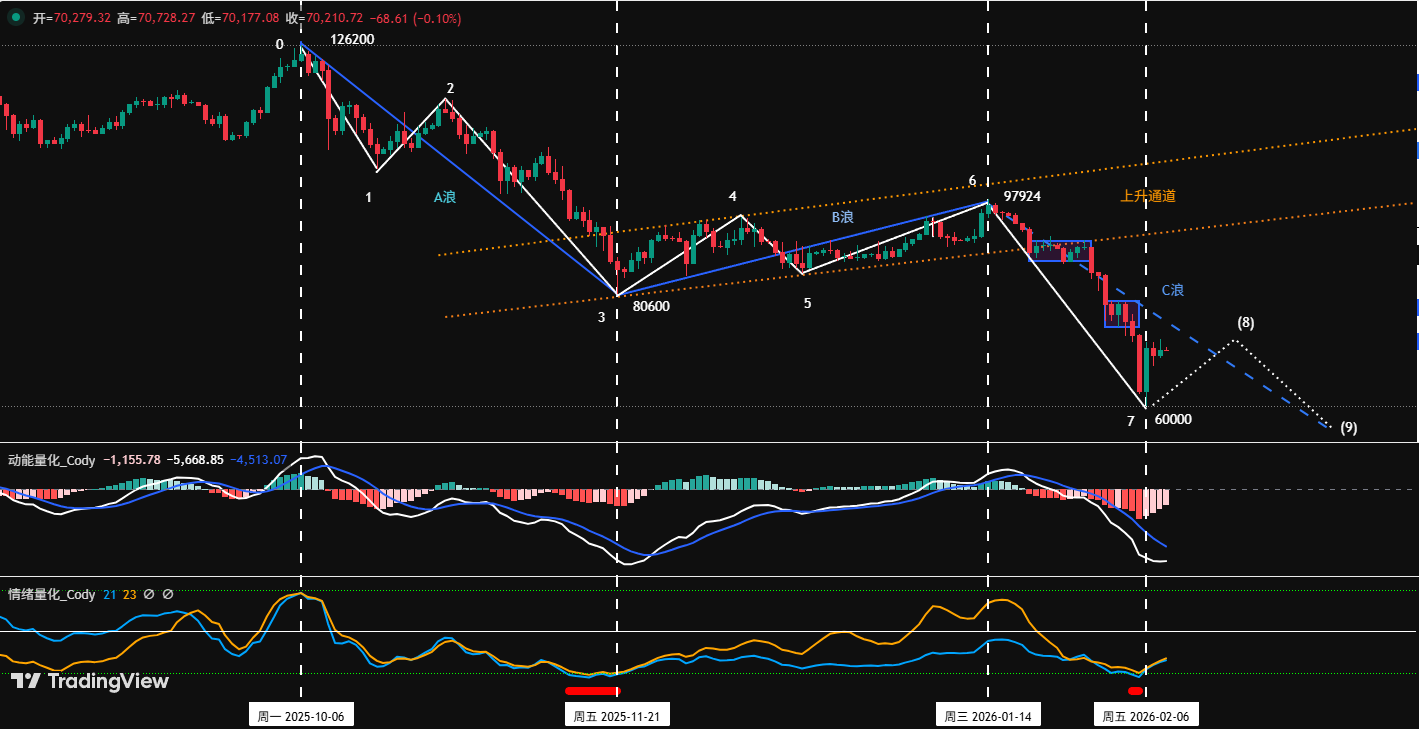
Figure 1
1. Primary Structure Analysis:
Currently, the ongoing correction starting from the October 2025 high of $126,200 presents an A-B-C three-wave structure:
• Wave A (Impulsive Decline Wave): $126,200 (2025-10-06) to $80,600 (2025-11-21), lasting 46 days, with a maximum decline of 36%.
• Wave B (Corrective Rebound Wave): $80,600 (2025-11-21) to $97,924 (2026-01-14), lasting 54 days, with a maximum increase of 21.5%.
• Wave C (Primary Decline Wave): $97,924 (January 14th) to present, lasting 25 days, with a maximum decline of 38.7%.
2. Secondary Structure Analysis: Detailed Dissection of Impulse and Corrective Waves
① Wave A can be decomposed into a 3-segment structure, namely segments 0-1, 1-2, 2-3:
• Segment 0-1: $126,200 (2025-10-06) to $103,528 (2025-10-17), lasting 11 days.
• Segment 1-2: $103,528 (2025-10-17) to $116,400 (2025-10-27), lasting 10 days.
• Segment 2-3: $116,400 (2025-10-27) to $80,600 (2025-11-21), lasting 25 days.
② Wave B can be decomposed into a 3-segment structure, namely segments 3-4, 4-5, 5-6:
• Segment 3-4: $80,600 (2025-11-21) to $94,589 (2025-12-09), lasting 18 days.
• Segment 4-5: $94,589 (2025-12-09) to $84,450 (2025-12-18), lasting 9 days.
• Segment 5-6: $84,450 (2025-12-18) to $97,924 (2026-01-14), lasting 17 days.
③ Projection of the internal movement structure of Wave C can be divided into the following three scenarios:
First Projection (High Probability): Wave C presents a 3-segment internal structure.
• Segment 6-7 (First Impulsive Decline), target completed: $97,924 (2026-01-14) to $60,000 (2026-02-06), lasting 23 days, maximum decline 38.7%. (Based on correction time and magnitude, $60,000 is highly likely the low point of the first segment within Wave C.)
• Segment 7-8 (Expected Rebound): The dashed line in the chart, representing the rebound segment that is about to or has already begun. The rebound height is unlikely to exceed $97,924 (the peak of Wave B). Key resistance zones to watch are $72,000-$74,500 and the higher $80,000-$80,600 area.
• Segment 8-9 (Final Decline Segment): The dashed line in the chart, representing the initiation of the final decline. Its theoretical target range can be projected by measuring the magnitude of Wave A. The $60,000 level will likely be broken in the future, and the price will test lower technical support levels.
Second Projection (Low Probability): Wave C presents a 5-segment or more complex internal structure.
This scenario is based on the completion of the first 3-segment structure without clear bottom reversal signals, requiring judgment based on the correction intensity and movement structure type at that time. It implies a significant extension of the correction period, potentially evolving into complex structures like a "falling wedge" or "multiple three-wave" patterns. This path is typically triggered by a continuous deterioration in macro conditions or a drying up of market liquidity. Its probability is relatively low in the current environment but cannot be entirely ruled out.
Third Projection (Very Low Probability): V-shaped reversal, correction ended, reversal begins.
• Segment 6-7 (First Impulsive Decline), target completed: $97,924 (2026-01-14) to $60,000 (2026-02-06).
• Segment 7-8 (V-shaped Reversal): The dashed line in the chart. The rebound is exceptionally strong, not only effectively breaking through the previous high of $97,924 but also sustaining above it, accompanied by significant positive news in the financial markets. If this occurs, it would mean the entire A-B-C three-wave correction starting from $126,200 may have ended in a "simplified form" at $60,000. Although the probability is extremely low, its trigger condition (a strong break above $97,924) is clear and can serve as a key observation signal for a trend reversal.
In summary, the above three scenarios are projections based on market behavior logic, not inevitable paths. Regardless of how the market evolves, one should always remember the principle: "The market is always right."
2. Review of Last Week's Bitcoin Trading Strategy and Key Levels (02.02~02.08)
1. Short-term Trading Strategy Review: As shown in (Figure 2)
We strictly followed the trading signals generated by our self-constructed Spread Trading Model and Momentum Quantification Model, combined with market movement predictions, to complete two short-term operations, achieving a cumulative profit of 10.72%.
Specific trade details and review are as follows:
① Short-term Trading Results Display (Leverage*1x):
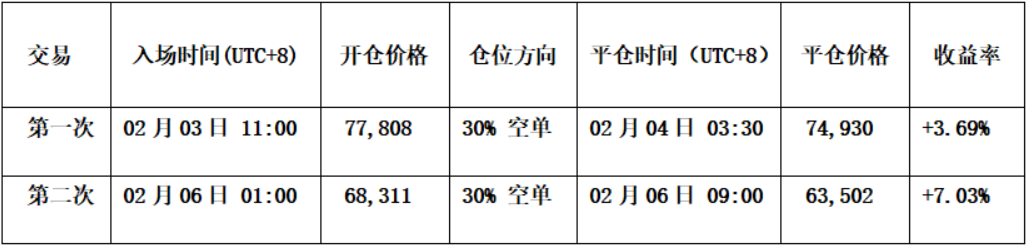
Figure 2
② Short-term Trade Review:
• First Trade (Profit 3.69%):
• Entry: Upon encountering resistance at the $80,000 pressure level during a pullback, combined with two model short signals in resonance, established a 30% short position at $77,808.
• Risk Control: Initial stop-loss for the short position set at $81,000.
• Exit: Upon approaching the support near $74,500, combined with a spread model bottom signal (red dot) and candlestick pattern bottoming signals, closed all positions at $74,930.
• Second Trade (Profit 7.03%):
• Entry: Upon encountering resistance at the $69,000 pressure level during a pullback, combined with two model short signals in resonance, established a 30% short position at $68,311.
• Risk Control: Initial stop-loss for the short position set at $71,000.
• Exit: Upon approaching the support near $63,000, combined with two model bottom resonance signals, closed all positions at $63,502.
Bitcoin 30-minute K-line Chart: (Momentum Quantification Model + Spread Trading Model)
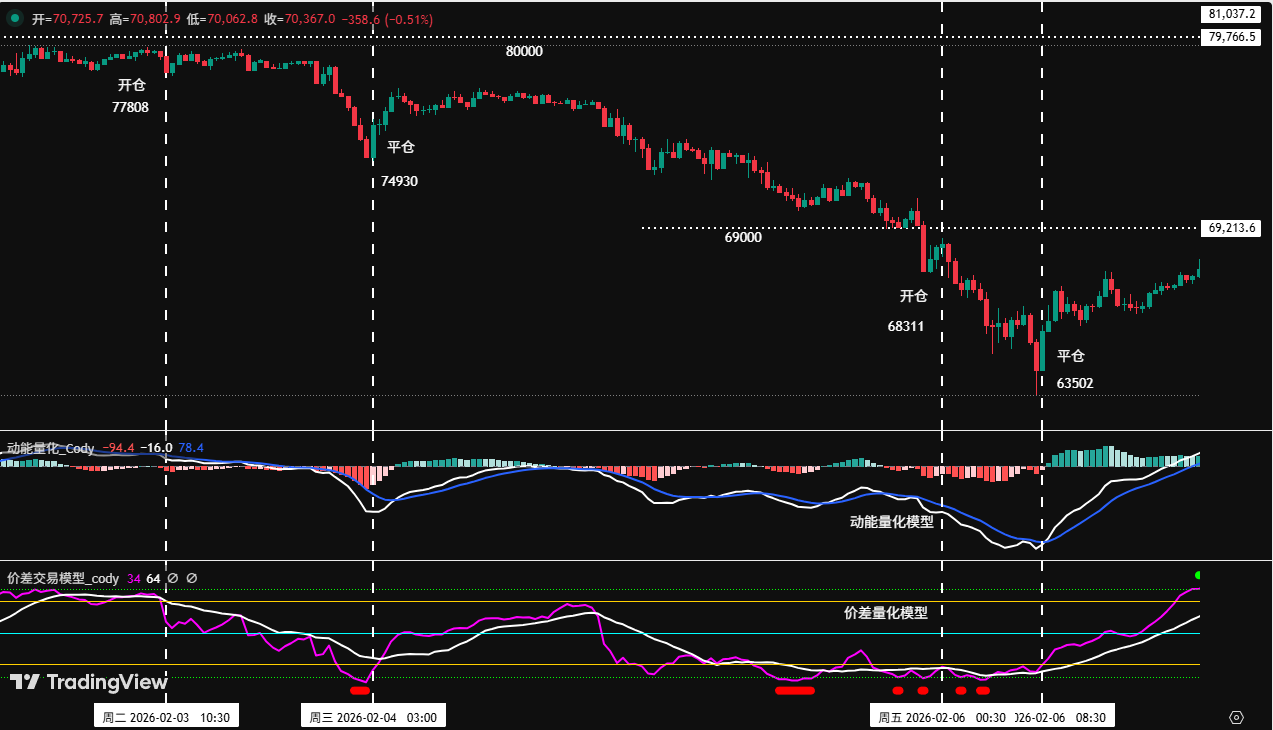
Figure 3
2. Mid-term Trading Strategy Review:
Mid-term Strategy: Continued holding the 60% short position established around $89,000 as planned.
3. Review of Last Week's Key Levels:
Resistance zone: $80,000~$80,600 area;
First support zone: $72,000-$74,500; Second support zone: $69,000-$72,500 area.
3. Technical Indicator Analysis for Bitcoin's This Week's Movement (02.09~02.15)
Combining market movements, the author conducts an in-depth analysis of Bitcoin's price structure from multiple models and dimensions based on a self-constructed trading system.
1. As shown in (Figure 4), analysis from the weekly chart:
Bitcoin Weekly K-line Chart: (Momentum Quantification Model + Sentiment Quantification Model)
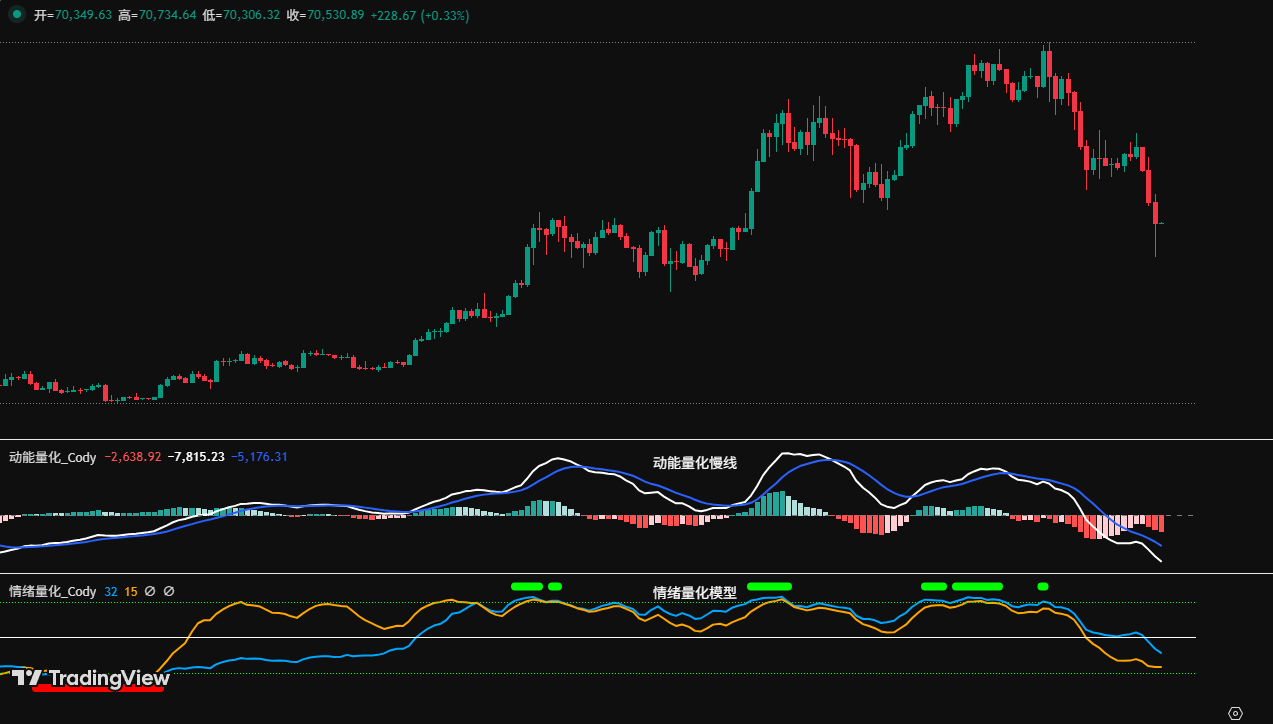
Figure 4
• Momentum Quantification Model: Technical indicators show that last week's selling momentum further intensified. Both momentum lines declined synchronously, and the negative energy bars gradually expanded, indicating an accelerating correction state.
Momentum Quantification Model indicates: Price Decline Index: High
• Sentiment Quantification Model: Blue sentiment line value 38, intensity zero; Yellow sentiment line value 11, intensity zero; peak value is 0.
Sentiment Quantification Model indicates: Price Bottom Support Index: Neutral
• Digital Monitoring Model: No (top/bottom) digital signals detected.
Digital Monitoring Model indicates: Bottom signal not present; Weekly K-line closed as a large bearish candle with a long lower shadow, declining approximately 8.63%.
The above data suggests: Bitcoin's weekly trend is bearish, but short-term selling momentum shows signs of weakening.
2. As shown in (Figure 5), analysis from the daily chart:
Bitcoin Daily K-line Chart: (Momentum Quantification Model + Sentiment Quantification Model)
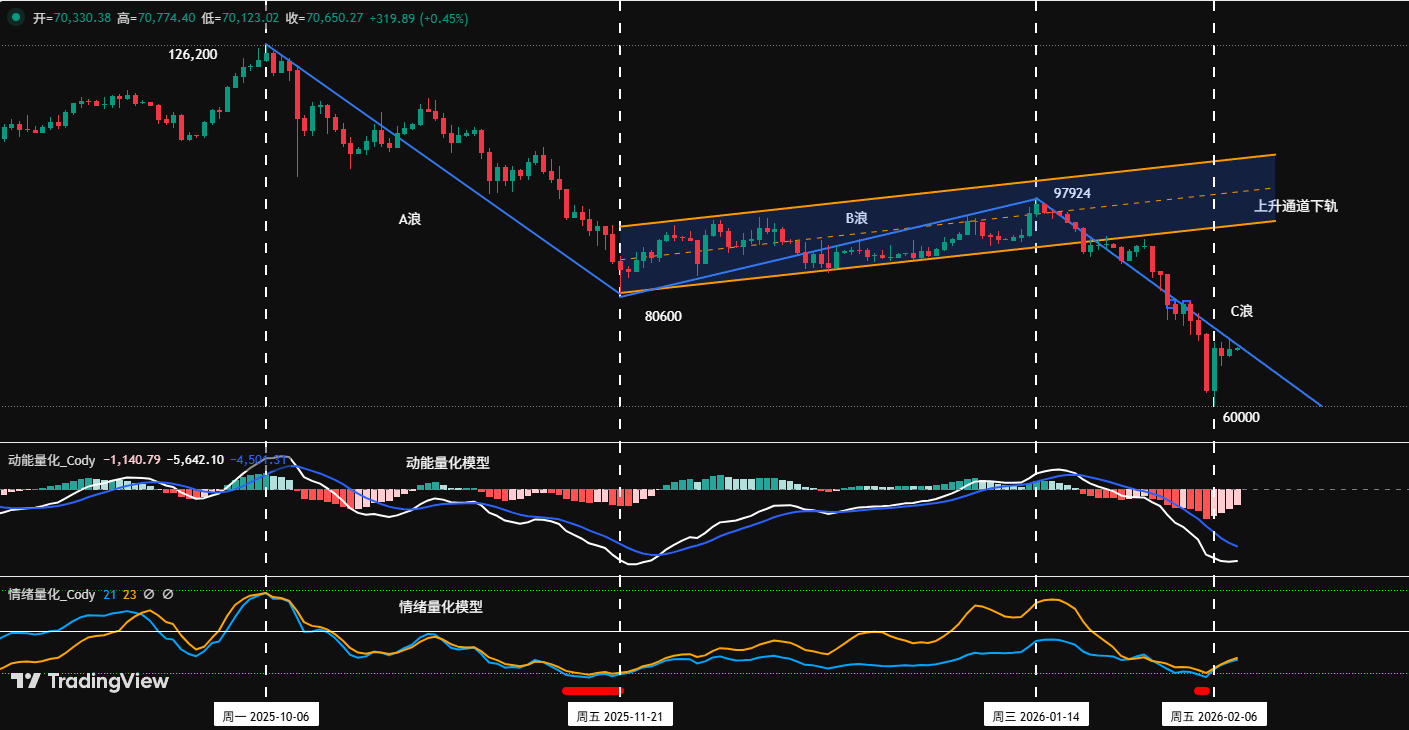
Figure 5
• Momentum Quantification Model: Last week overall presented a pattern of "accelerated decline - bottoming rebound." After Sunday's close, the white momentum line's decline slowed, and the negative energy bars have been gradually shrinking for three consecutive days.
Momentum Quantification Model indicates: Daily level bearish trend, with bulls beginning to resist.
• Sentiment Quantification Model: After last Sunday's close, following the sentiment model triggering a bottom warning signal (red dot), both sentiment lines began to turn upward.
Sentiment Quantification Model indicates: Support strength is gradually increasing.
The above data suggests: The daily level remains in a bearish trend, but a short-term bottom warning signal has been triggered, and a short-term rebound has begun.
4. This Week's Market Prediction (02.09~02.15)
1. This Week's Core View: Observe whether last week's low of $60,000 is broken, and monitor the strength of the oversold rebound initiated from this level. (If the price breaks below $60,000, it means the subdivision segment 6-7 of Wave C is still ongoing, and the rebound triggered from point 7 has not yet begun.)
2. Core Resistance Levels:
• First Resistance Zone: $72,000-$74,500 area (near last April's low)
• Second Resistance Zone: $80,000-$80,600 area (near the Wave B starting point)
3. Core Support Levels:
• First Support Zone: $60,000-$62,500 area (near recent correction lows)
• Second Support Level: Around $57,400 (near the 210-week moving average)
• Important Support Level: Around $52,500 (near the symmetrical point of 1x Wave A decline)
5. This Week's Trading Strategy (Excluding Impact of Sudden News) (02.09~02.15)
1. Mid-term Strategy: Maintain 60% short position. If the rebound effectively breaks above $74,500, the position can be reduced to 40%.
2. Short-term Strategy: Utilize 30% of capital, set stop-loss points, and look for "spread" trading opportunities based on support and resistance levels. (Using 30-minute/60-minute as the operation cycle).
3. Operationally, to dynamically respond to market evolution and combine real-time model signals, we have formulated two short-term operation plans, A/B:
• Plan A: If the price rebounds and encounters resistance in the $74,500~$75,200 area:
• Entry: When the rebound reaches this zone and triggers resistance signals combined with model top signals, a 15% short position can be established.
• Risk Control: Initial stop-loss for the short position set approximately 1.5% above the entry price (i.e., 1.015 * entry price).
• Exit: When the price falls near important support levels combined with model signals, positions can be gradually closed to take profits.
• Plan B: If the price rebounds and encounters resistance in the $80,000~$80,600


