
Bitcoin rally may have ended; be wary of correction risks | Invited Analysis
- 核心观点:比特币反弹动能衰竭,或将二次探底。
- 关键要素:
- 周线动能模型显示已进入空头市场。
- 日线反弹动能衰竭,即将形成死叉。
- 关键支撑位在87,500~89,000美元区域。
- 市场影响:短期市场或面临震荡调整压力。
- 时效性标注:短期影响
Conaldo, a featured market analyst at Odaily, holds a Master's degree in Financial Statistics from Columbia University. During his university years, he focused on quantitative trading in US stocks and gradually expanded to digital assets such as Bitcoin. Through practical experience, he has built a systematic quantitative trading model and risk control system. He possesses keen data insight into market fluctuations and is committed to continuous professional development in the trading field, pursuing stable returns. He will provide weekly in-depth analysis of BTC technical, macroeconomic, and funding changes, reviewing and showcasing practical strategies, and previewing recent noteworthy events for reference.
Key takeaways from the weekly trading report:
• The three-week rebound has come to an end, and bullish momentum has clearly weakened. Technically, the market is facing a key resistance level, and a short-term pullback to test lower support levels may be imminent, potentially leading to a second bottoming out.
• Last week's trading strictly followed the established strategy, successfully completing three short-term trades and achieving a cumulative return of 6.15%. The following section will review in detail the market prediction, strategy execution, and specific trading process.
I. Bitcoin Market Review Last Week (December 8th - December 14th)
1. Review of last week's core viewpoints and trading strategies:
In last week's issue, I clearly pointed out that the price of cryptocurrencies would most likely remain range-bound, and based on this, I proposed a short-term trading strategy of "selling on rallies and betting on rebounds after sharp declines." The following is a review and analysis of this strategy for further optimization.
① Review of market trend predictions:
Last week, I divided the market into three zones: $94,200, $91,000, $87,500, and $83,500 . We will formulate corresponding plans based on the market's direction.
• Core resistance level:
• First resistance level: $91,000
• Second resistance zone: $94,000–$96,500 area
• Third pressure zone: $98,500–$100,000 area
• Key support level:
• First support level: $85,500–$88,000 area
• Second support level: $83,500
• Key support level: $80,000
② Review of operational strategies:
• Medium-term strategy: Maintain a medium-term short position of around 65%.
• Short-term strategy: Since the market chose to trend upwards at the beginning of the week, the planned strategy should be to sell on rallies (Option A).
• Opening a position: If the price rebounds to the $91,000-$94,200 range and encounters resistance, establish a 15% short position.
• Add to short position: If the price continues to rebound to around $98,500 and encounters resistance again, add another 15% to the short position.
• Risk control: Stop loss for all short positions is set above $100,000.
• Closing positions: After the price rebound ends and moves downwards, when it falls to near the support level and encounters resistance, you can consider closing out some or all of your positions to take profits.
2. Last week, three short-term trades were successfully completed as planned (Figure 1), achieving a cumulative return of 6.93%. Detailed trade records and a recap are as follows:
Bitcoin 30-minute candlestick chart: (Momentum-based model + Spread trading model)
 Figure 1
① Summary of transaction details:
Trading Order | Entry Time (UTC+8) | Opening Price | Position Direction | Closing Time (UTC+8) | Closing Price | Profitability
First short position opened on December 8th at 20:30 at $91,877 (15% gain). Closed on December 9th at 04:30 at $90,477 (+1.55%) .
Second short position: December 11, 07:30, $92,154, 15%; December 12, 01:30, $90,083 , +2.30%.
Third time: December 12th, 20:00, $92,425, 15% short position; December 13th, 06:30, $90,349 , +2.30%
② Short-term trading review:
• First trade ( profit 1.55% ): Adhering to the "sell on rallies" strategy. After the price encountered resistance and fell back at the key level of $94,200, both the spread trading model and the momentum model issued top signals. A decisive 15% short position was established at $91,877, and ultimately closed for profit near the previous low support. Utilizing the principle of multi-indicator resonance improves the success rate of trades.
• Second trade ( profit 2.30% ): "Sell on rallies" strategy. After the price hit $94,200 and encountered resistance, a "strong top reversal" pattern appeared on the candlestick chart. The two models resonated and issued signals again. As planned, a 15% short position was established at $92,154, successfully capturing the subsequent pullback wave, and profits were taken near $90,083.
• Third trade ( profit 2.30% ): "Sell on rallies" strategy. After the price encountered resistance at $94,200 and fell back, it entered a narrow trading range, suppressed by the short-term downtrend line, with bullish momentum gradually weakening. When both models resonated and issued signals, a short position was decisively opened at $92,425, with a position size of 15% . When the price fell to the support level below and a resistance signal appeared, the position was closed for profit.
③ Analysis of key decision-making nodes:
• Forward-looking judgments on market trends provide a key basis for decision-making and risk control in short-term trading, and greatly improve the success rate of trading.
• Capture technical reversal signals at key resistance levels, enhance their reliability using the multi-model resonance principle, and lock in profits near support levels.
3. Review of Bitcoin Core Data Last Week:
• Opening price : $90,406
• Lowest price : $87,607 (Sunday)
• Highest price : $94,652 (Tuesday)
Closing price : $88,164
• Price change : Weekly decline of 2.48%, maximum fluctuation of 8.04%
• Trading volume : US$9.859 billion
• Trend : After a surge followed by a pullback, the price trended downwards in a volatile manner, with the weekly chart closing as a bearish candlestick with an upper shadow.
4. Review of last week's market performance:
Last week, Bitcoin's price action exhibited a typical "high-volume surge followed by a pullback and then a downward consolidation" pattern . The week ended with a bearish candlestick with an upper shadow, closing down 2.48% , but with a significant 8.04% range , indicating intense competition between bulls and bears. Specifically, the price initially rebounded, reaching a weekly high of $94,652 mid-week before encountering resistance and entering a downward consolidation phase. In the latter half of the week, the price trend shifted to a downward consolidation, gradually declining to around $87,607, near its lowest point, ultimately resulting in a bearish candlestick with a long upper shadow, closing down 2.48%. It's worth emphasizing that the price action throughout the week perfectly aligned with the consolidation range I defined last week . Furthermore, the mid-week high of $94,652 was only $452 away from the previously identified upper resistance level of $94,200 , an error of less than 0.5%. This once again validates the effectiveness of the author's technical positioning of key supply and demand areas (resistance and support) , and also provides a strong trend basis for continuing the "buy low and sell high within the structure" tactic.
II. Systematic Technical Analysis: Comprehensive Judgment Based on Multiple Models and Dimensions
Based on last week's market performance, this article will utilize a multi-dimensional analysis model to conduct an in-depth analysis of the evolution of Bitcoin's internal structure.
Bitcoin Weekly Chart: (Momentum-based quantification model + sentiment-based quantification model)
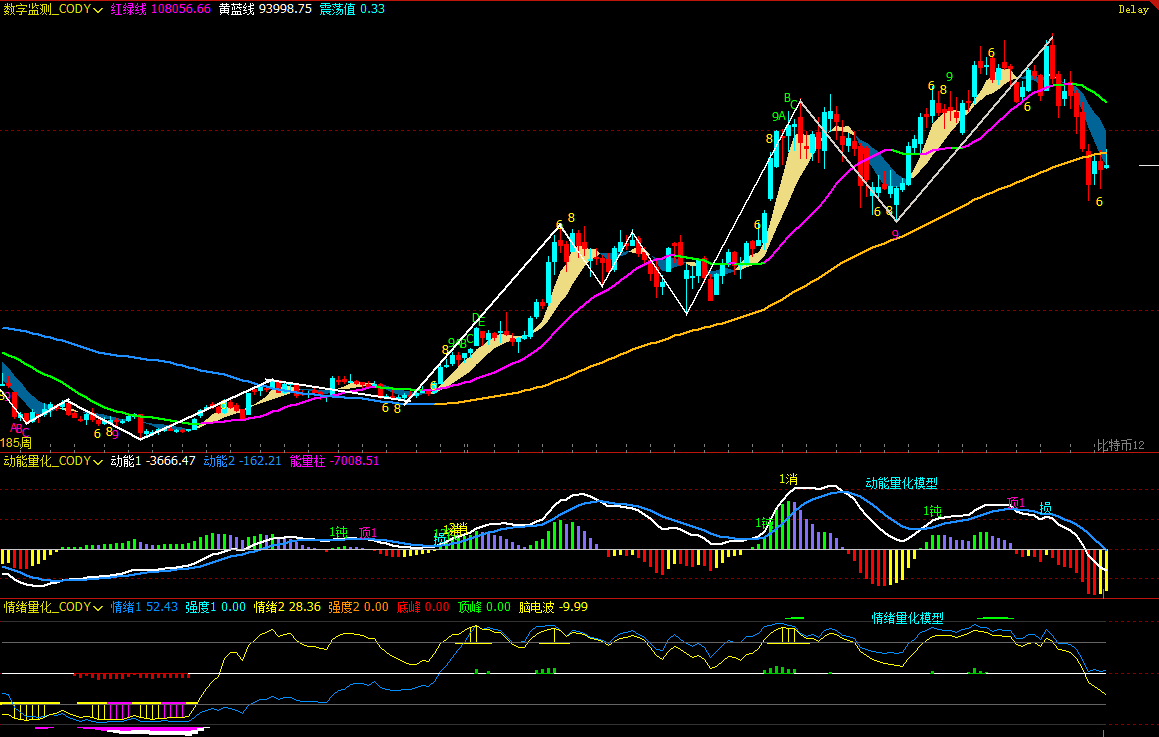
Figure 2
1. As shown in Figure 2, analysis from the weekly chart:
• Momentum Model: Following last week's market movements, both momentum lines continued their downward trend and crossed below the zero line. On a weekly chart, this is typically seen as a technical signal of increasing bearish pressure and a market turning bearish.
The kinetic energy model predicts: Price decline index: High
• Emotion Quantification Model: The blue emotion line has a value of 52.43, with an intensity of zero; the yellow emotion line has a value of 28.36, with an intensity of zero and a peak value of 0.
The sentiment quantification model predicts: Price pressure and support index: Neutral.
• Digital monitoring model: No digital signal is currently displayed.
The above data indicates that Bitcoin is in a downtrend and has entered a bear market on the weekly chart.
Bitcoin daily candlestick chart:
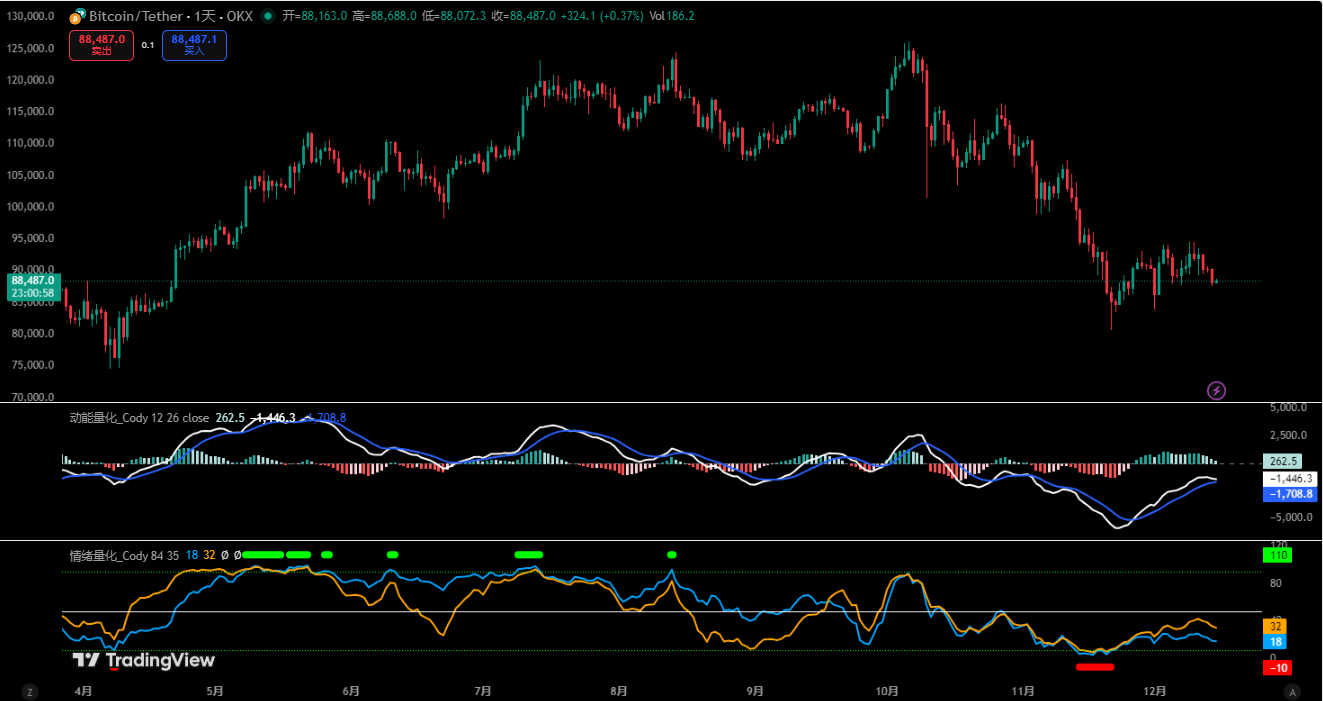
Figure 3
2. As shown in Figure 3, analysis from the daily chart:
• Momentum-based model: After a week of rebound, the two momentum lines continued to rise below the zero axis, gradually approaching the zero axis. However, momentum line 1 began to flatten out, gradually approaching line 2, and the energy bars gradually shortened compared to the previous few days.
The kinetic energy model predicts that the bullish rebound momentum is gradually weakening, and the two momentum lines are about to form a "death cross".
• Sentiment Quantification Model: After the market closed last Sunday, the blue sentiment line value was 18, with an intensity of zero; the yellow sentiment line value was 32, with an intensity of zero.
The sentiment quantification model predicts: Stress and support index: Neutral
The above data suggests that the market is in a downtrend on a daily chart, and the oversold rebound is nearing its end.
III. Market Forecast for This Week (December 15th - December 21st)
1. After three consecutive weeks of oversold rebound (the 21-day time window for a market reversal), bullish momentum has weakened, and the market faces a directional decision. Currently, the price has encountered resistance at a key resistance level and has fallen back. This week's trend is expected to be mainly one of consolidation and adjustment. The $ 87,500-$89,000 area needs to be closely monitored; if it breaks down effectively, the market may begin a second dip.
2. Core pressure level:
• First resistance zone: $ 92,500–$94,500 area
• Second resistance zone: $ 96,500–$98,500 area
• Key resistance level: $ 100,000
• Key support level:
• First support level: $ 87,500–$89,000 area
• Second support level: $ 80,000–$83,500 area
• Key support level: $ 74,500 to $76,000 area.
IV. Trading Strategy for This Week (Excluding Unexpected News) (December 15-21)
1. Medium-term strategy: Maintain a medium-term position of around 65% (short positions).
2. Short-term strategy: Use 30% of your position, set a stop-loss point, and look for opportunities to profit from price differences based on support and resistance levels. (Use 60-minute/240-minute charts as the trading timeframe).
3. My assessment is that this week will primarily see consolidation and adjustment, with the $ 87,500-$89,000 area becoming a crucial dividing line. Therefore, regarding the outcome of this area, the following two short-term trading strategies should be implemented:
• Option A : If the support in this area is effective:
• Opening a position: If the price rebounds to the $92,000-$94,200 range and encounters resistance, establish a 30% short position.
• Risk control: Set the stop loss for short positions above $95,000.
• Close positions: When the price falls to the $ 87,500-$89,000 range and finds resistance, close all short positions and take profits.
• Option B: If the area is effectively broken:
• Opening a position: If the price falls below this area and this is confirmed, establish a 30% short position.
• Risk control: Stop loss set above $89,000.
• Close positions: When the price drops to the $ 80,000-$83,500 range and encounters resistance, close all short positions and take profits.
V. Special Notes
1. When opening a position: immediately set the initial stop loss level.
2. When the profit reaches 1% , move the stop loss to the opening cost price (break-even point) to ensure the safety of the principal.
3. When the profit reaches 2%, move the stop loss to the position where the profit is 1%.
4. Continuous monitoring: For every additional 1% profit in the coin price thereafter, the stop loss level will be moved by 1% to dynamically protect and lock in existing profits.
(Note: The above 1% profit trigger threshold can be adjusted flexibly by investors based on their own risk appetite and the volatility of the underlying asset.)
VI. Macroeconomic Outlook and Key Events This Week (December 15-21)
1. Federal Reserve officials speak out in quick succession
Several key and potential voting members will speak on the economic outlook, and their wording will influence the market's reassessment of the "pace and sustainability of interest rate cuts," especially guidance on long-term interest rate expectations.
2. Inflation data becomes a key turning point.
The U.S. November CPI and core CPI data released on Thursday will be key variables determining the direction of the dollar and interest rates.
• If the CPI is lower than expected (currently around 3%, still above the 2% target), it will further validate the rationale for the interest rate cut cycle, and the US dollar may come under pressure while risk assets may gain some breathing room;
• If inflation rises again, it could weaken market confidence in continued easing, drive a dollar rebound, and suppress the performance of highly valued assets.
3. Supplementary verification of employment and inflation expectations indicators
Initial jobless claims and the University of Michigan's consumer inflation expectations data will examine whether the downward trend in inflation is sustainable from both "actual" and "expected" perspectives.
Financial markets are constantly changing, and all market analysis and trading strategies need to be dynamically adjusted. All views, analytical models, and operational strategies presented in this article are derived from personal technical analysis and are for personal trading journal use only. They do not constitute any investment advice or basis for action. The market is risky; invest with caution. DYOR.


